
Global Healthcare Security Systems Market Report, Size, Share and Forecast 2026–2033: Hospitals Buy Evidence, Not Cameras
Healthcare is the one building type where the security system and the life-safety system are the same wires. A camera in a ward corridor also serves the nurse call. A door held open is a fire-strategy decision before it is a security one. A badge reader at the pharmacy is a controlled-drugs audit trail. That is why this market does not behave like the rest of the security industry: its specification is written by accreditation surveyors and regulators rather than by a single security director's risk assessment, and the purchase order is signed by a finance committee working against a 1.3 per cent adjusted operating margin — the figure Kaufman Hall's National Hospital Flash Report recorded for US hospitals closing out 2025.
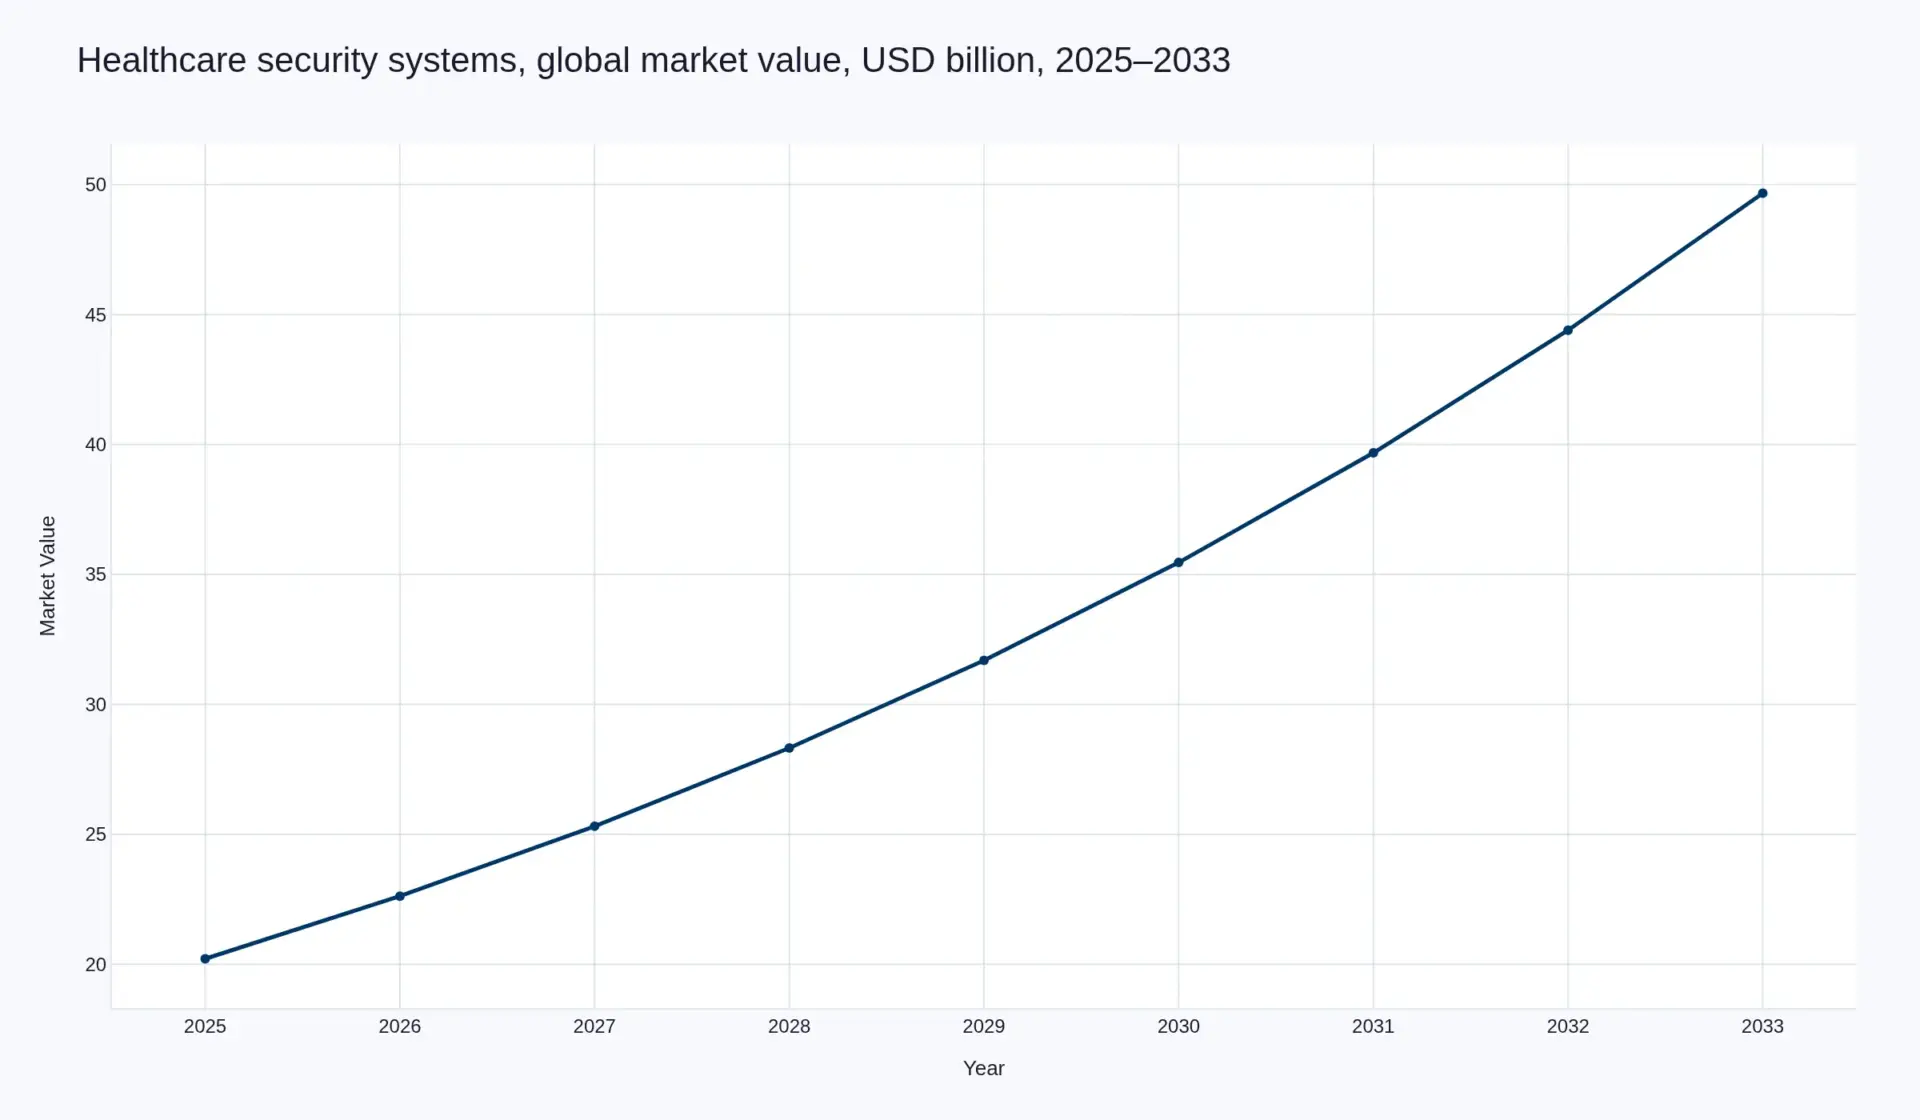
Pheonix Research sizes the global healthcare security systems market at USD 20.21 billion in 2025, reaching USD 49.67 billion by 2033 — an 11.90 per cent CAGR across the 2026–2033 window, 2.46 times the base year. Volume, measured as installed secure endpoints (cameras, electronic access readers, RFID tags, duress devices and screening lanes), rises from 118.6 million to 214.8 million at 7.71 per cent. Revenue per installed endpoint therefore climbs from USD 170 to USD 231, up 35.7 per cent, in a market where the price of the box itself is falling.
That divergence is the argument of this report. The endpoint count grows at roughly the rate hospitals add beds, refurbish estates and replace end-of-life equipment. The revenue grows faster because a rising share of the bill is no longer equipment. It is the worksite analysis, the incident record, the commissioning file, the network map, the monitoring seat and the audit log — the documents a hospital is now obliged to be able to produce on request.
What is actually being bought
Three regimes converged on the same estate and each asks for a different artefact. The Joint Commission's new and revised workplace violence prevention requirements took effect on 1 July 2025 and ask for training, post-incident strategies, reporting and data collection, policies, leadership oversight and a documented worksite analysis across hospitals, critical access hospitals and behavioural health — then extended the same framework to assisted living, nursing care centres and office-based surgery. The HIPAA Security Rule notice of proposed rulemaking issued on 27 December 2024 would require a technology asset inventory and a network map showing how electronic protected health information moves, refreshed at least every twelve months, alongside removing the "addressable" escape hatch from implementation specifications. In Europe, NIS2 pulls health providers into the essential-entity perimeter with governance-level accountability.
None of the three can be satisfied by buying a better camera. All three can be satisfied more cheaply if the camera estate, the access control system and the intrusion panel were installed as one documented system rather than three. That is the wedge the integrator sells, and it is why the services layer is the fastest-growing part of the market that is not software.
| Layer | 2025 (USD m) | 2033 (USD m) | CAGR | Share 2025 | Share 2033 |
|---|---|---|---|---|---|
| Managed services, remote monitoring and maintenance | 4,720 | 13,180 | 13.70% | 23.35% | 26.54% |
| Video surveillance, cameras and analytics | 5,180 | 11,940 | 11.00% | 25.63% | 24.04% |
| Access control and electronic access | 4,060 | 8,720 | 10.03% | 20.09% | 17.56% |
| Integrated software, PSIM and command platforms | 1,480 | 4,760 | 15.72% | 7.32% | 9.58% |
| Intrusion, perimeter and duress/emergency notification | 2,310 | 4,540 | 8.81% | 11.43% | 9.14% |
| Screening and detection (weapons, metal, explosive) | 1,340 | 4,210 | 15.38% | 6.63% | 8.48% |
| Infant, patient and asset protection (RFID and RTLS) | 1,120 | 2,320 | 9.53% | 5.54% | 4.67% |
| Total | 20,210 | 49,670 | 11.90% | 100% | 100% |
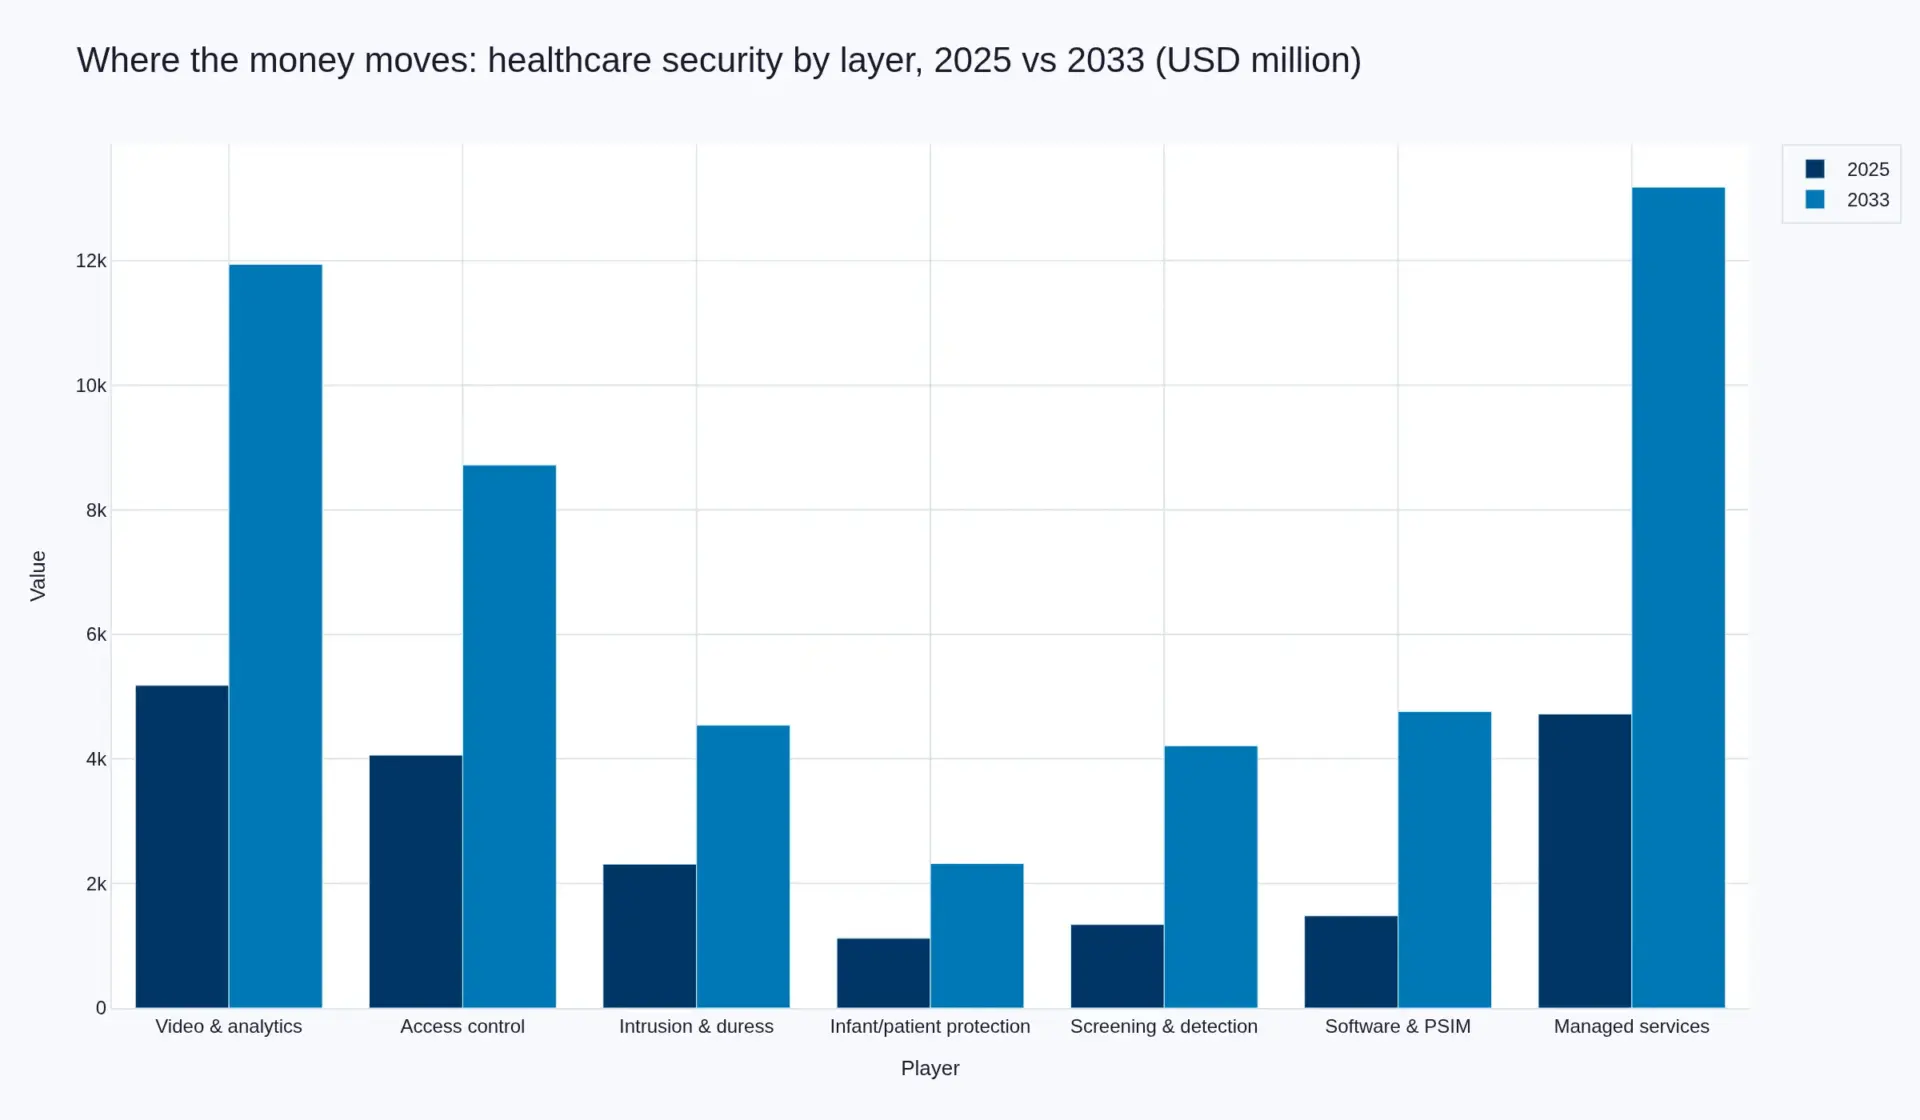
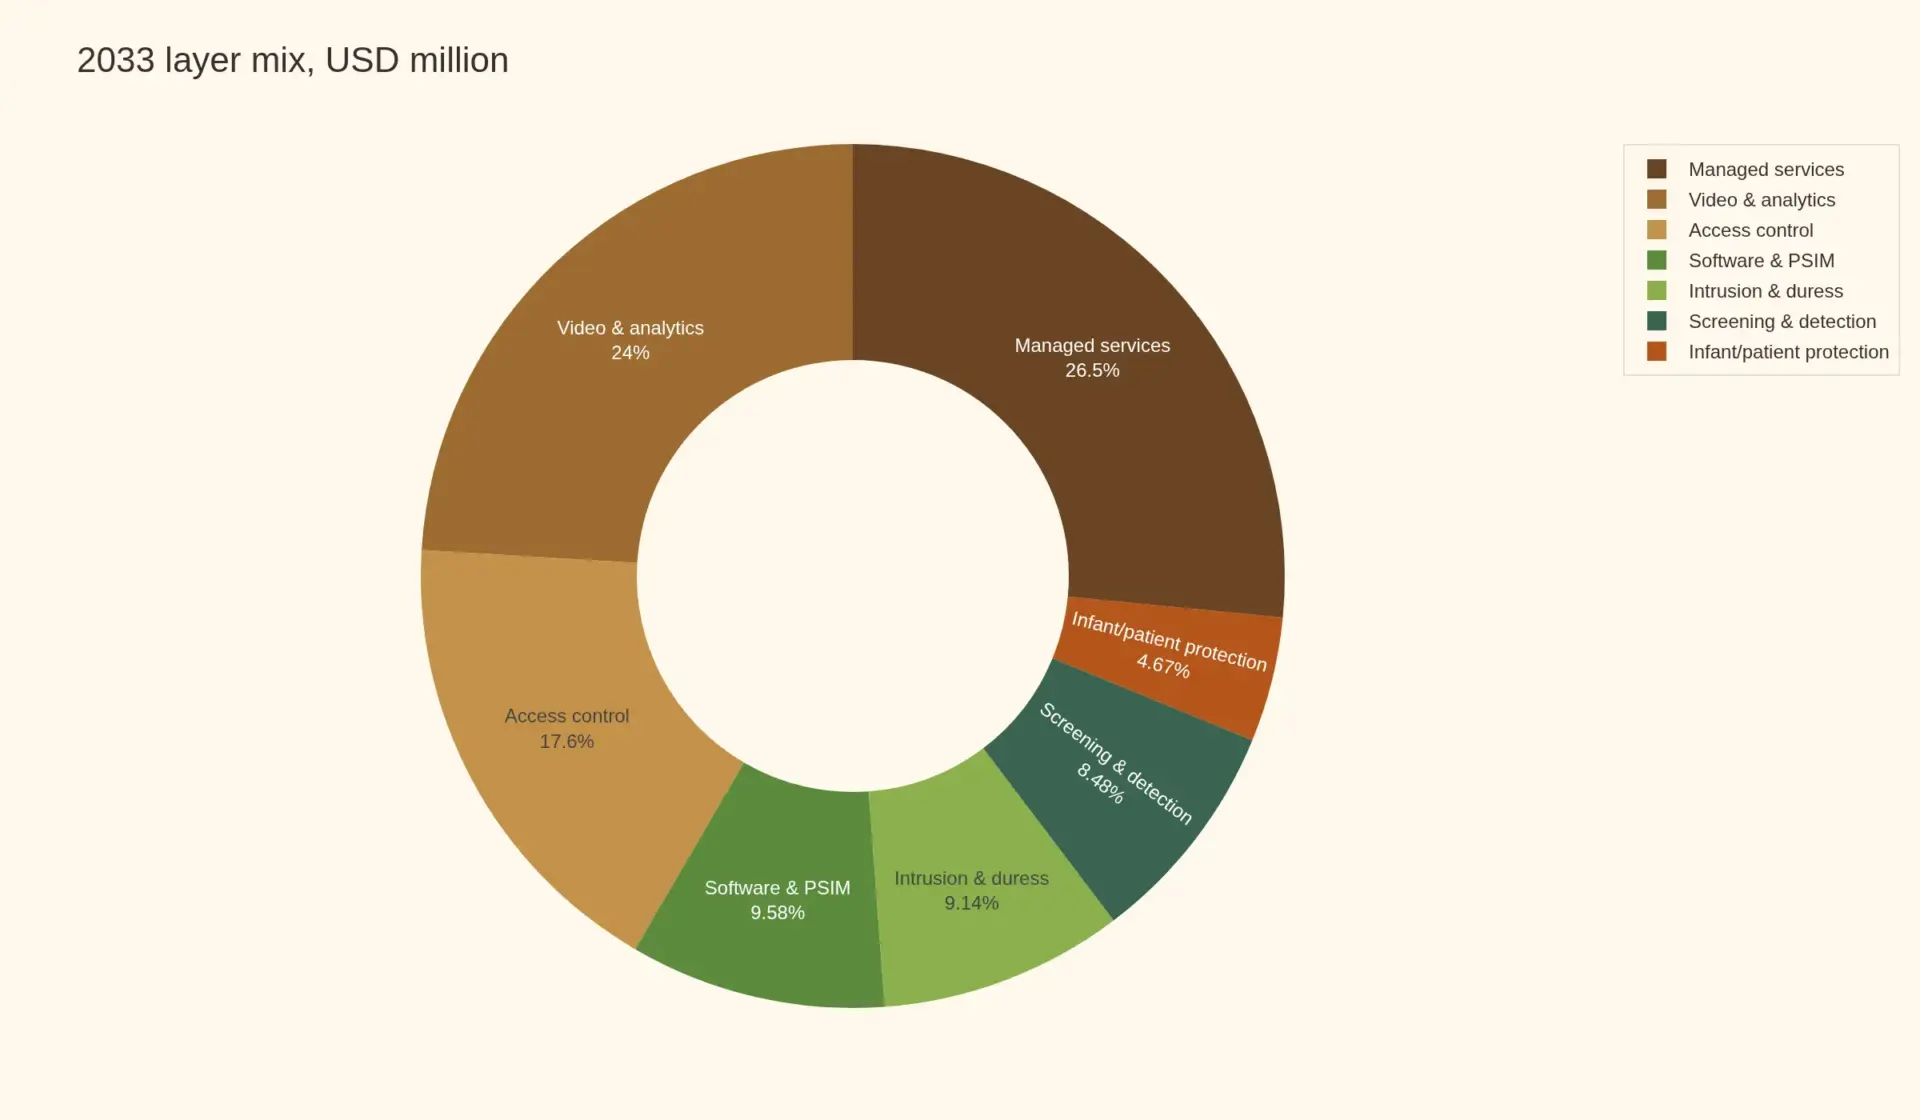
Table 1 — Market value by layer, 2025 and 2033. Hardware layers fall from 62.69 per cent of the market to 55.41 per cent; services and integrated software climb from 30.67 per cent to 36.12 per cent.
Where the growth is
Growth is not evenly distributed, and the regional pattern is the clearest evidence that this is a compliance market rather than a threat-level market. North America carries 38.4 per cent of 2025 value because it carries the densest stack of accreditation and audit obligations, but grows at 11.40 per cent — the second-slowest major region — because its estate is already instrumented. Asia Pacific grows fastest at 13.97 per cent, not because violence is rising there, but because hospital construction is: a new 500-bed facility is specified as an integrated system on day one, with no legacy base to retrofit around.
| Region | 2025 (USD m) | 2033 (USD m) | CAGR | 2033 share |
|---|---|---|---|---|
| North America | 7,760 | 18,410 | 11.40% | 37.06% |
| Asia Pacific | 5,030 | 14,320 | 13.97% | 28.83% |
| Europe | 4,870 | 11,280 | 11.07% | 22.71% |
| South America | 1,300 | 2,900 | 10.55% | 5.84% |
| Middle East & Africa | 1,250 | 2,760 | 10.41% | 5.56% |
| Total | 20,210 | 49,670 | 11.90% | 100% |
Table 2 — Market value by region. Europe grows below the global rate despite NIS2 because its hospital estate is older and its capital budgets are narrower; Asia Pacific's premium is construction-led.
Six findings this report defends
- The unit of purchase is moving from the device to the record. Services and software climb from 30.67 per cent to 36.12 per cent of value while hardware prices deflate — value per endpoint still rises 35.7 per cent. Chapter 1 traces which layer captures it.
- Workplace violence is the demand signal, and it is measured in rates, not headlines. Assault rates in US healthcare and social assistance rose from 6.4 to 9.8 per 10,000 full-time-equivalent workers between 2011 and 2021–22, and psychiatric and substance-abuse hospitals run at 138.8 per 10,000. Chapter 2 explains why that number buys a duress badge and a screening lane rather than a camera.
- Screening is the fastest-growing hardware layer at 15.38 per cent, and it is the only layer whose specification is written by a clinical operations constraint: throughput. Chapter 2 takes the Baystate Health rollout as the template.
- No vendor holds a double-digit share. The platform owners compete with their own channel; the guarding companies compete on labour; the clinical-workflow specialists compete on integration. Chapter 3 maps twelve credible players across those three positions.
- The compliance calendar, not the threat level, is the forecast. Chapter 4 sets out four regimes, the one that is most often got wrong (accreditation audits process, not equipment), and the two dates that move the model.
- The constraint is a 1.3 per cent operating margin. Chapter 6 shows what happens to the forecast if hospital capital discipline holds at 8 per cent growth instead of 11.90 — USD 37.41 billion in 2033 rather than USD 49.67 billion.
Scope, method and what this report excludes
This report measures revenue earned from healthcare-specific security systems: video surveillance and analytics, electronic access control, intrusion and perimeter detection, duress and emergency notification, infant/patient/asset protection, weapons and metal screening, the software layer that fuses them, and the managed services sold against them. It covers hospitals, behavioural health facilities, nursing and residential care, outpatient and diagnostic centres, laboratories and pharmacies.
It deliberately excludes four adjacent pools: hospital cybersecurity software spend (we count only the cyber-physical integration inside the security estate); security officer labour, which is larger than the equipment market in most facilities and is a services business with entirely different economics; construction and architectural fees; and general-purpose IT networking that happens to carry camera traffic.
The tone of this report is 70 per cent secondary and 30 per cent primary. The secondary layer is regulatory text (Joint Commission standards, the HIPAA Security Rule NPRM, NIS2), official statistics and rate series (BLS-derived injury data as compiled by NCCI, World Bank and WHO bed series), and audited company disclosure. The primary layer is Pheonix Research's own trade: structured interviews with hospital security and facilities directors, integrator and channel conversations, conference-floor and exhibition work, open-ended interviews, and buyer surveys on specification and renewal behaviour. Where a figure is our model output rather than a disclosed number we say so in the sentence. Where our model contradicts a widely quoted figure we say that too, and Chapter 6 carries the sensitivity that would halve the headline.
The volume series is a model construct, not a census: it counts installed endpoints we can price, weighted by facility tier, and it deliberately excludes cameras embedded in clinical devices (endoscopes, imaging systems) because those are bought by clinical departments and never appear in a security budget.
Sources
Joint Commission, "New and revised workplace violence prevention requirements for three accreditation programs," 15 January 2025 · US Department of Health and Human Services, Office for Civil Rights, HIPAA Security Rule Notice of Proposed Rulemaking and fact sheet, 27 December 2024 · NCCI, "Workplace Violence: Part 3 — Assaults and Violence by Others in Finer Detail," July 2026 · Kaufman Hall, National Hospital Flash Report commentary, 10 February 2026 · Baystate Health, "Baystate Health Adds Weapons Detection Screening at ED Entrances," 18 September 2026 · European Commission, NIS2 Directive FAQs · World Bank / WHO, hospital beds per 1,000 people · UnitedHealth Group year-end 2024 disclosure on the Change Healthcare cyberattack, as reported 17 and 27 January 2025 · Pheonix Research internal models: Global Smartphone Credential Reader (87317), India Video Surveillance (87379), Global Security Orchestration, Automation and Response (102561), Global Electronic Medical Records (90994), Global Healthcare Revenue Cycle Management (101586), India Homeland Security (87496), Global Biometric Technologies (88621), Global Police and Law Enforcement Equipment (87360).
No third-party market-research estimate is cited anywhere in this report. Every market-size, share and growth figure is either a disclosed primary statistic or Pheonix Research's own model output, derived as described in each chapter.
Table of Contents
Table of contents
- Executive summary, scope and market definition — the thesis, the seven layers, the regional split, and what this report deliberately excludes.
- Value chain and margin structure — five layers, and the discovery that the customer relationship sits in the layer with the thinnest margin because that is the layer that produces the documentation.
- Technology and innovation — the false-alarm economics of healthcare analytics, the asset-register accident, the duress badge that became a nurse call, and why screening is a throughput product rather than a detection product.
- Competitive landscape — three positions, no leader, and the point-solution trap that a fragmented market inflicts on its own customers.
- Regulatory landscape — four regimes on one estate, the artefact each one actually demands, and the two dates that move the model.
- Investment activity — why capital has been buying the recurring line rather than the platform, and what the multiple logic tells you about where value is going.
- Market risk — two sensitivities and three falsifiers, including the one that would shrink the market rather than slow it.
Tables
- Table 1 — Market value by layer, 2025 and 2033
- Table 2 — Market value by region, 2025 and 2033
- Table 3 — Indicative value capture and margin structure by layer
- Table 4 — Twelve credible players across three competitive positions
- Table 5 — Four regulatory regimes, their artefacts and their dates
- Table 6 — Selected transactions and their strategic logic
- Table 7 — Sensitivity and falsification tests
Figures
- Figure 1 — Market value path, 2025–2033 (USD billion), in the executive summary
- Figure 2 — Layer comparison, 2025 versus 2033 (USD million), in Chapter 1
- Figure 3 — 2033 layer mix (USD million), in Chapter 5
- Figure 4 — Market summary infographic (featured image, top of report)
All seven chapters are original Pheonix Research analysis. Market sizing is our own model; the underlying statistics are named in the Sources block of the executive summary and in each chapter.
Competitive Landscape
3. Competitive landscape: three positions, no leader, and the trap in the middle
No participant in this market holds a double-digit share of global healthcare security revenue, and Pheonix Research estimates that the ten largest together hold roughly a third of it. That is unusual for a market of this size, and it is a direct consequence of the value chain described in Chapter 1: the buyer purchases an assembled, commissioned, locally warranted system, so scale is local even when the product is global. A hospital in Manchester and a hospital in Manila may run the same video management platform and be served by firms that never compete with each other.
Within that fragmentation, competitors occupy three distinct positions, and the strategic mistake to make is to confuse them.
Position one: the platform owners
Johnson Controls, Honeywell, Siemens, Robert Bosch, Motorola Solutions through its video security business, and Schneider Electric. Each owns a piece of the software stack, often the panel or camera hardware, and frequently the service arm as well. Their structural problem is channel conflict: the integrator that specifies the platform is also the entity the platform owner competes with when it bids the service contract directly. In large health systems this conflict is manageable because the buyer wants a single accountable party. In single-site hospitals it is corrosive, because the integrator’s rational response is to specify a platform it can control.
Position two: the services and guarding companies
Securitas, which acquired Stanley Healthcare’s healthcare security business and now sells infant protection, asset tracking and monitoring inside a guarding relationship; ADT through its commercial and healthcare work; and the large guarding groups that bundle technology into labour contracts. Their economics are labour economics. The technology is a means of winning and retaining a multi-year service agreement, and their pricing power comes from the contract structure rather than from the device. They are the most likely winners of the managed-services layer and the least likely to lead on analytics.
Position three: the clinical-workflow specialists
Nedap, Ascom and Zebra, alongside a set of smaller firms in real-time location and infant protection. Their products are small, integrated deep into nursing workflow, and replaced only when a hospital changes its clinical system. This is the smallest position by revenue and the stickiest by account tenure. Their weakness is breadth: they solve one workflow beautifully and cannot be the accountable party for an entire estate.
| Company | Primary position | Healthcare security relevance | Wikidata |
|---|---|---|---|
| Johnson Controls | Platform owner | Access control, video, intrusion; large installed estate across health systems | Q667865 |
| Honeywell International | Platform owner | Access control, video and building integration; strong in acute care retrofits | Q898208 |
| Motorola Solutions | Platform owner | Video security and analytics; body-worn and command software in hospital systems | Q634815 |
| Robert Bosch (Bosch Security and Safety Systems) | Platform owner | Cameras, conference and evacuation systems; strong in European tenders | Q226327 |
| Siemens | Platform owner | Building and access integration inside a wider hospital technology estate | Q81230 |
| Securitas | Services and guarding | Infant protection, asset tracking, monitoring inside guarding contracts | Q662174 |
| ADT Inc. | Services and guarding | Monitoring, intrusion and commercial security with healthcare accounts | Q290680 |
| Nedap | Clinical-workflow specialist | Identification and infant/patient protection; deep European base | Q1479312 |
| Ascom | Clinical-workflow specialist | Alerting, duress and nurse call convergence on one handset | Q663942 |
| Zebra Technologies | Clinical-workflow specialist | Real-time location, patient and asset visibility, handheld identity | Q2443609 |
Table 4 — Ten credible players across three positions. Wikidata identifiers verified against the Wikidata query service for this edition. Presence of a company in this table is not an estimate of market share.
The trap in the middle
Fragmentation is usually described as a benefit to buyers, and in this market it is only half true. The practical consequence at estate level is what our interviews with facilities and security directors describe repeatedly: a mid-sized acute hospital running somewhere between ten and fifteen separate systems — video from one vendor, access from another, the intruder alarm from a local firm, nurse call from a clinical supplier, the infant tag system from a specialist, screening lanes from a third party, and three separate monitoring applications, each with its own login and its own idea of an incident record. The buyer’s stated priority in these conversations is rarely more capability. It is fewer logins and one incident record.
That is the demand behind the 15.72 per cent growth we model for integrated software, and it is a demand the platform owners are better placed to meet than any other position — provided they can price it as a subscription carrying an evidence function, rather than as a licence attached to a hardware discount. The services companies can meet it too, but only by integrating competitors’ products, which is a business they are structurally capable of running and culturally less inclined to invest in.
What the competitive map means for a buyer
The question that separates these positions is not “who has the best technology”. It is “who will produce the network map in twelve months, and at what price”. A platform owner will answer with a feature list. A guarding company will answer with a service credit. A clinical-workflow specialist will answer with an integration diagram. The buyer who asks the question in that form will discover in one meeting which of the three has understood the market this report describes — and will usually find that the answer differs between their emergency department, their behavioural health unit and their pharmacy.
Our own reading is that competitive intensity rises rather than falls over the forecast window, because the fastest-growing layers — screening and integrated software — have low barriers to entry on the device side and high barriers on the evidence side. That combination produces a market with many entrants, rapid consolidation among the small ones, and no leader: exactly the structure we have assigned it, and exactly the structure in which the buyer’s procurement discipline matters more than the vendor’s brand.
Value Chain
1. Value chain and margin structure: the thinnest margin owns the customer
In most markets the company closest to the customer earns the best margin. Healthcare security inverts that. The relationship sits with a systems integrator whose net margin is usually in the mid single digits, while the software it installs earns seventy per cent gross and the manufacturer of the camera inside the housing earns a fraction of the project value. That inversion is not an accident of competition. It is a consequence of what the buyer is actually purchasing: a documented, commissioned, auditable system, assembled on site, by people who will still be answering the phone in year four.
Five layers carry the value, and each behaves differently.
Layer one: device and sensor manufacturers
Cameras, readers, intrusion panels, RFID tags, duress badges and screening lanes. This is where price deflation is most visible and least important. Image sensors and system-on-chip silicon are consumer-electronics volume; a mid-range camera in 2026 does what a premium camera did in 2019 for materially less, and the same curve has reached access readers and detection lanes. Deflation here does not shrink the market, because the buyer does not want a cheaper camera — it wants more coverage of more space, and the budget freed by falling unit prices is immediately spent on additional endpoints. That is why endpoint count grows 7.71 per cent while hardware value grows 10.18 per cent: more units, more analytics per unit, and a rising services tail attached to each.
Layer two: platform software
Video management, access control, visitor management and the physical security information management layer that fuses them. Gross margins here are in the seventy to eighty-five per cent band, but the software is almost never sold on its own in healthcare. It is bundled into a project price, and the licence is often the part the integrator discounts to win the hardware. Software only becomes a genuine margin pool when it is sold as a subscription with an evidence function attached — a compliance dashboard, an incident module, a retention policy that can be shown to an auditor.
Layer three: clinical integration
This is the layer outsiders underestimate and the reason a hospital is not a shopping centre with beds. The access control system must talk to the admission-discharge-transfer feed so that a discharged patient’s wristband stops opening a ward door. The duress badge must land on the same screen as the nurse call. The infant protection tag must reconcile against the maternity census. The pharmacy cabinet must log to the same identity as the door. Once the credential is the identity and the identity sits in the clinical record, replacement stops being a procurement decision and becomes a re-credentialing and re-validation project — which is why switching costs in this layer are the highest in the entire chain, and why the clinical-workflow specialists hold accounts for a decade or more.
Layer four: integration and commissioning
The integrator designs, installs, commissions and warrants the system. Our channel interviews put gross margin at twelve to twenty-two per cent and net margin at three to six per cent on healthcare work, which is thin for the risk carried: a mis-configured door in a behavioural health unit is a ligature and elopement exposure, and the integrator’s name is on the commissioning sheet. But this is the layer that produces the artefacts the regulator now demands — the as-built drawing, the device schedule, the test record, the worksite analysis input, the network map. Whoever writes the commissioning file owns the renewal, and in a compliance market that is a stronger position than owning the patent.
Layer five: managed services, monitoring and maintenance
Contracted, index-linked, multi-year revenue: remote monitoring seats, preventive maintenance, firmware and patch management, response SLAs, system health reporting. This is 23.35 per cent of 2025 value and grows at 13.70 per cent — the fastest of the two large layers — because it is the only line in a hospital security budget that converts a capital request into an operating contract. A capital request has to survive a finance committee working against a 1.3 per cent margin. An operating contract with a fixed monthly cost and a documented service credit is a different conversation.
| Layer | Typical gross margin | Revenue character | Who controls the renewal |
|---|---|---|---|
| Device and sensor manufacture | 30–45% | Unit volume, deflating prices | Distributor or integrator |
| Platform software | 70–85% | Licence plus subscription | Vendor, if sold direct to specification |
| Clinical integration | 45–65% | Professional services, sticky | Specialist vendor |
| Integration and commissioning | 12–22% | Project, milestone-billed | Integrator, via the commissioning file |
| Managed services and monitoring | 30–40% | Contracted, multi-year, indexed | Incumbent provider |
Table 3 — Indicative value capture by layer. Margins are Pheonix Research estimates from channel and integrator interviews, not disclosed figures; they are intended to show relative position, not precise economics.
The lowest-bid problem, stated precisely
A hospital that specifies “1,200 cameras, 4 megapixel, 30-day retention” has written a specification that any of forty bidders can satisfy, and the tendering rule will then select the cheapest of the forty. Because camera counts and resolutions are comparable on a price sheet, the comparison is real. What is not comparable is the thing the hospital actually needs: whether the analytics are tuned to the zone, whether the commissioning file will survive a survey, whether the network map was ever produced, and whether the false-alarm rate will still be tolerable in month eighteen. None of that can be inspected at delivery.
The fix is not exotic. Buy the outcome in units the buyer can verify: a documented worksite analysis per facility, a network map refreshed inside twelve months, a stated false-alarm ceiling per zone with service credits attached, and a price per facility per year rather than a price per camera. That reframing moves the purchase from layer one to layers four and five, which is precisely the direction the market is already moving on its own — 36.12 per cent of 2033 value sits in software and services — and it is the single change most likely to make a security budget defensible to a finance committee.
The counter-argument deserves an airing. Outcome-based specification requires the buyer to hold a view on what good looks like, and most hospital security directors do not have the benchmarking data to set a false-alarm ceiling. They know their own site and nothing else. That is a real gap, and it is the commercially interesting one: the supplier who arrives with comparative, anonymised performance data across a peer group is not selling a camera. It is selling the standard.
Investment Activity
5. Investment activity: capital buys the recurring line
Follow the transactions and the strategy of this market becomes obvious. Almost no recent deal has been about buying a better camera. The acquisitions have been about buying the contract that sits behind the camera — the monitoring seat, the maintenance agreement, the multi-year service relationship that renews on its own terms and is valued by investors on a revenue multiple rather than a project multiple.
Three deals that explain the structure
Securitas’s purchase of Stanley Black & Decker’s electronic security business brought STANLEY Healthcare into a guarding group, which is the clearest possible statement that healthcare security technology is valued as a means of winning and holding service contracts. Motorola Solutions built its video security position out of Avigilon rather than out of a camera brand, because the analytics and the software layer are what command the margin. And ADT’s separation of its commercial arm into a stand-alone business under GTCR split a residential monitoring business from a commercial and healthcare installation business with entirely different capital intensity — a split that only makes sense if you believe the two should be valued on different multiples.
Private capital has done the same thing one level down, rolling up regional integrators. The logic is not scale in purchasing; it is recurring maintenance and monitoring revenue attached to a customer list that is expensive to re-win. A hospital does not change its security integrator casually, because the integrator holds the as-built documentation and knows where the cable runs.
| Transaction type | What was bought | Strategic logic | What it implies for this market |
|---|---|---|---|
| Guarding group acquires healthcare security technology | Securitas and STANLEY Healthcare | Attach technology to a labour contract; sell monitoring and infant protection inside a guarding relationship | The services layer is the exit for technology specialists |
| Platform owner acquires analytics | Motorola Solutions and the Avigilon business | Own the software and the camera; compete with the channel | Software margin is worth more than device volume |
| Conglomerate separates commercial security | ADT commercial arm into Everon | Different capital intensity and different multiples for commercial versus residential | Commercial healthcare work is a services business |
| Sponsor roll-up of integrators | Regional installation and maintenance firms | Buy the customer list and the recurring maintenance revenue | Documentation ownership is the moat |
Table 6 — Selected transaction types and their strategic logic. Transaction names are public; the interpretation of logic is Pheonix Research analysis.
Why a cyber event is now a capital-allocation event
The Change Healthcare attack reset the arithmetic hospital boards use to justify security spending. UnitedHealth Group’s year-end 2024 disclosure, as reported in January 2025, put the total impact at USD 3.09 billion — USD 2.2 billion of direct response costs and USD 867 million of business disruption — while the breach estimate reached 190 million individuals. The most instructive number is none of those. It is the USD 9.03 billion advanced to affected healthcare providers to keep them operating, of which USD 4.5 billion had been repaid.
That is a transfer of working capital across an entire provider ecosystem caused by a single point of failure, and it does something no security incident report can do: it makes cyber risk a treasury problem. Hospitals that had treated security as a facilities line item started asking a different question — what happens to our cash if this system is unavailable for three weeks — and that question funds resilience rather than detection. It also explains why the integrated software layer, where availability and access control meet, is the fastest-compounding line in our model.
Where the capital constraint bites
None of this removes the operating constraint described in Chapter 4. Kaufman Hall’s National Hospital Flash Report closed 2025 with an adjusted year-to-date operating margin of 1.3 per cent, with expenses rising across the board and bad debt, uninsured patients and charity care all increasing. On that margin a hospital cannot fund a security refresh out of cash flow, so the refresh is either bundled into a construction project — where it is a rounding error against the building cost — or converted into an operating contract.
That produces a two-speed investment picture, and it is the honest way to read Table 1. Hardware grows 10.18 per cent because new construction, refurbishment and end-of-life replacement continue regardless of margin. Software and services grow 14.20 per cent because they are the only lines a hospital can buy without a capital request. The 4.02-point gap between those rates is the single most important number in this report, and it is a finance fact before it is a technology fact.
What we would expect capital to do next
Three testable consequences follow. First, expect further consolidation among clinical-workflow specialists into services groups, because a small firm with a sticky workflow and no breadth is a natural acquisition. Second, expect platform owners to push harder into subscription pricing that bundles the evidence function, since that is the only way to defend a software multiple against a channel that discounts licences to win hardware. Third, expect the integrator roll-up to continue until the documentation moat is priced properly — at which point the interesting question becomes whether a hospital can own its own commissioning file, and what it would pay to do so.
Technology & Innovation
2. Technology and innovation: the false alarm is the product
The most valuable technology in a hospital security system is not detection. It is the suppression of the detection that does not matter. A behavioural health unit generates door events continuously — staff entering, patients attempting, observation checks — and every event that a human must adjudicate costs a walk down a corridor. Alarm fatigue is not a comfort issue in a hospital; it is a patient-safety issue, because a nurse who has silenced forty alarms in a shift will silence the forty-first without looking. The engineering target is therefore not sensitivity. It is a defensible operating point on a curve, set per zone.
Sensitivity, specificity and the cost of being wrong twice
Video analytics in healthcare are calibrated differently from retail or perimeter work because the two error types cost in different currencies. A missed event in a ward corridor is a clinical incident with a root-cause review attached. A false event is a nurse-minute, and nurse-minutes are the scarcest input in the building. In a loading dock the ratio inverts: a false event costs nothing, so the detector can be aggressive. This is why a single vendor’s out-of-the-box configuration performs well in one hospital and badly in the next, and why the analytical work that customers actually pay for is tuning and re-tuning against real event logs — an ongoing service, not a product feature.
Why inference moved to the edge, and what that did to retention
Processing inside the camera rather than the data centre was originally a bandwidth decision: hospitals have thousands of camera streams and constrained backhaul in older wings. It has since become a records decision. Under the HIPAA Security Rule’s proposed direction, and under NIS2’s governance obligations in Europe, the question of how long identifiable imagery is retained becomes an auditable policy question rather than an IT preference. The clean answer is to keep metadata — counts, dwell times, loiter patterns, door-state exceptions — and discard the frame. Edge inference makes that the default, and it changes the storage economics of a thousand-camera estate from hardware capex to a much smaller software and service line. It also changes the sales conversation: the pitch is no longer resolution, it is retention policy and who can prove it.
The asset-register accident
The most consequential development in this market is not a security technology at all. The HIPAA Security Rule notice of proposed rulemaking issued on 27 December 2024 would require covered entities and their business associates to maintain a technology asset inventory and a network map illustrating how electronic protected health information moves through their systems, updated at least every twelve months and in response to environmental change. Consider what a modern hospital knows about its own estate. The clinical device inventory is partial and often maintained by vendors. The IT asset register covers managed endpoints. The security system, by contrast, has a schedule: every camera, every reader, every panel, every intercom, with a location, a firmware version and a date of installation — because the integrator had to install them and the maintenance contract requires an inventory to service.
For camera and reader installation, that inventory exists. And a camera is an unpatched Linux host on the clinical network, while an access panel is operational technology with a default password history. The security estate is frequently the largest uncontrolled endpoint population in the building. A rule that demands an annual network map therefore does something the security industry has wanted for a decade: it converts the integrator’s system-of-record into compliance infrastructure. This is the strongest single reason to expect integrated software and services to compound rather than revert, and it is why we model the software layer at 15.72 per cent — the fastest CAGR in the report — despite it being only 7.32 per cent of 2025 value.
Convergence: one credential, four jobs
The duress badge, the nurse call pendant, the location tag and the door credential have been converging for years and are now effectively one device in new builds. Ascom’s alerting and Zebra’s real-time location systems sit in the same clinical workflow as the access control system, and infant protection — Nedap and Securitas among the specialists — has always been a location problem with a liability attached. The commercial consequence is straightforward: a hospital that buys one credential for four jobs buys fewer devices but far more integration, and the integration is where the margin sits. It also raises the cost of getting it wrong, because a single credential controls a door and summons help, and a failure in one function erodes trust in all four.
Screening: the throughput product
Weapons screening is the fastest-growing hardware layer in the report at 15.38 per cent, and it is worth being precise about why, because the obvious explanation is wrong. It is not growth in the number of firearms arriving at hospitals. It is that a screening lane has become operationally acceptable where it previously was not. Baystate Health’s programme, announced on 18 September 2026, sets out the template: walk-through detection at emergency department entrances without requiring visitors to empty pockets or remove shoes, safe for pregnant patients, children, people with pacemakers and people using mobility devices, with a manual alternative, and an explicit commitment that patients arriving with a medical emergency are not delayed and undergo an alternative process. Phase one put systems in the emergency departments; later phases extend to behavioural health units and main entrances.
Read that specification carefully. Every constraint in it is a clinical constraint, not a detection constraint. The hospital is buying assurance that the lane will not become a bottleneck at triage, and that a patient in arrest will never be held at a checkpoint. That is why cheap, high-sensitivity metal detection does not win this market: it produces the wrong kind of certainty. The successful product screens at the rate people actually arrive — including at 2am on a Saturday — and routes the exceptions to a human who is standing there. The growth rate of this layer is a statement about hospital tolerance for friction, not about the threat.
What is not being invented
Almost nothing in this chapter is new physics. The image sensor is a commodity; the analytics are trained models on a well-understood task; the tag is a radio. The innovation is entirely in integration and evidence — making four systems behave as one, and making the resulting record legible to a surveyor, an auditor and a plaintiff. In a market where the specification is written by a regulator and the purchase order is signed against a 1.3 per cent operating margin, that is where the value has to be, and the layer growth rates in this report are simply that sentence expressed in numbers.
Market Risk
6. Market risk: two sensitivities, three falsifiers, one scope warning
A forecast that cannot be wrong is not a forecast. This chapter states what would have to be true for the numbers in this report to fail, and what happens to them if the most fragile assumptions break. It also carries a warning about category scope that a careful reader should apply to any figure they see for this market, including ours.
Sensitivity one: services grow at 10 per cent, not 13.70 per cent
The largest single bet in this model is the services layer. If managed services, monitoring and maintenance grow at 10 per cent instead of 13.70 per cent — a plausible outcome if hospital procurement keeps services inside capital projects and never converts them to contracts — that layer reaches USD 10.12 billion rather than USD 13.18 billion in 2033. The market total becomes USD 46.61 billion and the CAGR falls to 11.01 per cent. The direction of the story survives; the mix shift that carries it weakens materially.
Sensitivity two: screening reverts to the market rate
Screening is the second-largest bet, and the most exposed to a single operational failure: if walk-through detection proves to slow emergency arrivals more than hospitals will tolerate, or if published throughput and false-alarm data turn against it, the layer grows at the market rate of 11.90 per cent rather than 15.38 per cent. It would then reach USD 3.29 billion in 2033 instead of USD 4.21 billion, taking the total to USD 48.75 billion and the CAGR to 11.64 per cent. This is a smaller sensitivity than the services case, which is why we weight it less.
Sensitivity three: capital discipline holds at 8 per cent
The most important downside case is not about any layer. It is about the ability of hospitals to buy anything at all. If the 1.3 per cent margin environment persists and security spend is capped at 8 per cent growth across the forecast window, the market reaches USD 37.41 billion by 2033 rather than USD 49.67 billion. That is a 24.7 per cent reduction in the 2033 number, and it is the scenario a hospital supplier should be planning against, because it requires no regulatory reversal — only a continuation of the current financial picture.
| Case | Change from base | 2033 value (USD bn) | 2026–2033 CAGR |
|---|---|---|---|
| Base case | — | 49.67 | 11.90% |
| Services grow at 10.00% | Services CAGR cut 3.70 points | 46.61 | 11.01% |
| Screening grows at market rate | Screening CAGR cut 3.48 points | 48.75 | 11.64% |
| Capital discipline at 8.00% | Whole-market growth capped | 37.41 | 8.00% |
Table 7 — Sensitivity tests against the base case. Each case changes one assumption and holds the rest of the model constant.
Three falsifiers
One: a regulator writes a number. The services premium in this report exists because specification is qualitative — a worksite analysis, a documented risk assessment, a tuned analytics configuration. If a regulator replaces that with a pass mark — a stated detection threshold, a numeric false-alarm ceiling, a certified product list — the specification becomes comparable on a price sheet and the premium compresses. This is the most plausible mechanism by which the mix shift reverses, and it would arrive from a well-intentioned simplification.
Two: hospital margins recover durably. Our mix shift assumes capital remains scarce. If operating margins return to the mid single digits and stay there, capital requests become fundable again, hospitals buy new estates rather than services attached to old ones, and hardware outgrows services. The 4.02-point gap between hardware and software-plus-services growth closes. Anyone who expects a durable margin recovery should discount the 49.67 billion figure and treat the 8 per cent case as the central one.
Three: screening fails its cost-benefit test in public. Screening is bought on the promise that it reduces harm without delaying care. If the first large, well-evidenced programme evaluation shows no measurable reduction in incidents against a measurable throughput cost, procurement will not stop screening — but it will stop expanding it, and the 15.38 per cent assumption in the fastest hardware layer goes with it.
And the risk that is epistemic rather than commercial
The HIPAA Security Rule revision is a proposal, not a rule. If it is withdrawn or substantially narrowed, the network-map driver behind the 15.72 per cent software growth weakens and that layer reverts toward the hardware rate. We have not hidden this: it is stated in Chapter 4 and repeated here. A reader who believes the rule will not survive should take roughly three points off the software CAGR and expect the mix shift to arrive later, not never — because accreditation and NIS2 point the same direction without it.
A scope warning about every number in this category
Figures published for “healthcare security systems” differ by a factor of two or more, and the difference is almost never method — it is category boundary. Definitions that count only physical security hardware produce a market less than half the size of ours. We include managed services, screening lanes, the integration software layer and the infant/patient protection category, and we exclude hospital cybersecurity software spend and security officer labour entirely. Our 2025 base of USD 20.21 billion is therefore broader in scope than many figures a reader will encounter, and comparison across sources without reconciling scope is meaningless. Where our model differs from another estimate, the first question to ask is what that estimate excluded.
Regulatory Landscape
4. Regulatory landscape: four regimes on one estate
Most security markets are regulated at the edges: a fire code here, a privacy statute there. Healthcare is different. Four separate regimes land on the same camera, the same door and the same badge, and each demands a different artefact from the same installation. The commercial consequence is that compliance is not a cost attached to this market — it is the specification. Modifying any one of the four changes the forecast, and the two dates that matter most have both already arrived.
Regime one: accreditation, which audits process
The Joint Commission’s new and revised workplace violence prevention requirements took effect on 1 July 2025 for assisted living communities, nursing care centres and office-based surgery practices, and align with the earlier updates for hospitals, critical access hospitals, behavioural health care and home care. The requirements address training and education, post-incident strategies, reporting systems with data collection and analysis, policies and procedures, leadership oversight, and worksite analysis — with a formal definition of workplace violence added to the glossary.
Read the list again as a buyer. Six of the seven items are documents, and the seventh is oversight of the documents. None of them is a device. An accreditation surveyor will not measure the resolution of your cameras; they will ask to see the analysis, the training record and what changed after the last incident. The hospital that installed an excellent system but cannot produce the analysis fails, and the hospital with an ordinary system and an immaculate file passes. This is the most commonly misunderstood feature of the market, and it is why services grow faster than hardware.
Regime two: the HIPAA Security Rule, which audits records
The Office for Civil Rights issued its notice of proposed rulemaking on 27 December 2024. It proposes to remove the distinction between “required” and “addressable” implementation specifications, require written documentation of all Security Rule policies, procedures, plans and analyses, attach specific compliance time periods to many existing requirements, and require a technology asset inventory and a network map illustrating how electronic protected health information moves — maintained on an ongoing basis, updated at least every twelve months and in response to a change in environment or operations. Risk analysis would need new specificity: a review of the asset inventory and network map, identification of reasonably anticipated threats, vulnerabilities and predisposing conditions, and an assessed risk level for each.
Two things follow. First, the security estate becomes a compliance asset rather than a facilities asset, because it is the only register in the building that already lists devices, locations and firmware. Second, the buyer needs a party who can produce and refresh that register annually. That is a subscription, and it is why we model integrated software at 15.72 per cent.
It is also important to be accurate about status: this is a proposed rule. It has not been finalised, and rules of this scale are amended or abandoned. The forecast assigns it a real but bounded weight — it accelerates the software layer, it does not create it — and Chapter 6 states what happens if it never lands.
Regime three: NIS2, which audits governance
The European Union’s second Network and Information Security Directive, politically agreed in May 2022 and formally adopted in late November 2022, expanded the sectors in scope and, in health, went beyond hospitals to entities carrying out research and development of medicinal products. Member states were required to transpose it into national law, and the obligations it imposes are notable for what they target: management-body accountability for cybersecurity risk, supply-chain security, and incident reporting on a short clock.
For a hospital group, NIS2 makes security a board matter in a way accreditation never does. For a supplier, it makes the supply chain auditable — which means a security integrator selling into European health systems must be able to evidence the security of what it installed, including the firmware lifecycle of the cameras and panels. That is a formalisation of exactly the asset-register capability described above, arriving from a different direction.
Regime four: the procurement rulebook, which audits price
The fourth regime is not a regulator at all. It is the operating constraint that governs every purchase: a finance committee working against a 1.3 per cent adjusted hospital operating margin, in a year when Kaufman Hall reports expenses rising across the board, bad debt, uninsured patients and charity care all increasing, and a larger share of revenue arriving from public rather than private payers. In that setting a capital request for security competes with clinical equipment, and it usually loses.
This is why the managed-services layer at 13.70 per cent is not an anomaly to be explained away. A fixed monthly operating cost with a documented service credit is the only structure that reliably clears a capital committee at 1.3 per cent. The regulatory regimes create the requirement; the procurement regime decides which commercial wrapping gets bought.
| Regime | Artefact demanded | Key date | Can a device satisfy it? | Status |
|---|---|---|---|---|
| Joint Commission workplace violence prevention | Worksite analysis, training records, incident data and analysis, post-incident strategy | 1 July 2025 | No — process and documentation | In force |
| HIPAA Security Rule revision | Technology asset inventory, network map, written risk analysis, documented policies | Proposed 27 December 2024 | No — but the estate supplies the inventory | Proposed, not final |
| NIS2 (EU) | Management accountability, supply-chain security evidence, incident reporting | Adopted late November 2022; national transposition | No — governance and evidence | In force, transposing |
| Hospital capital procurement | Business case cleared against a 1.3 per cent operating margin | Continuous | Only as an operating contract | Binding |
Table 5 — Four regimes, what each actually demands, and whether hardware can answer it. The pattern is the argument: three of the four are satisfied by documentation, which is a services and software purchase.
What the regime map implies for a hospital
A hospital that treats these four as separate projects will buy four times and satisfy each regime partially. A hospital that treats them as one estate will buy once and satisfy all four, because the artefacts overlap: the worksite analysis needs the device schedule, the network map is the device schedule, the NIS2 supply-chain evidence is a firmware lifecycle record for the same devices, and the capital committee will fund the cheapest version of all three. That is the commercial case for integrated software in one paragraph, and it is why the software layer is the fastest-growing line in this report despite being the smallest today.