
Global Warehouse Automation & Automated Storage and Retrieval (AS/RS) Market Report, Size, Share and Forecast 2026–2033: The Warehouse Bought the Robot, Then Discovered It Bought the Software
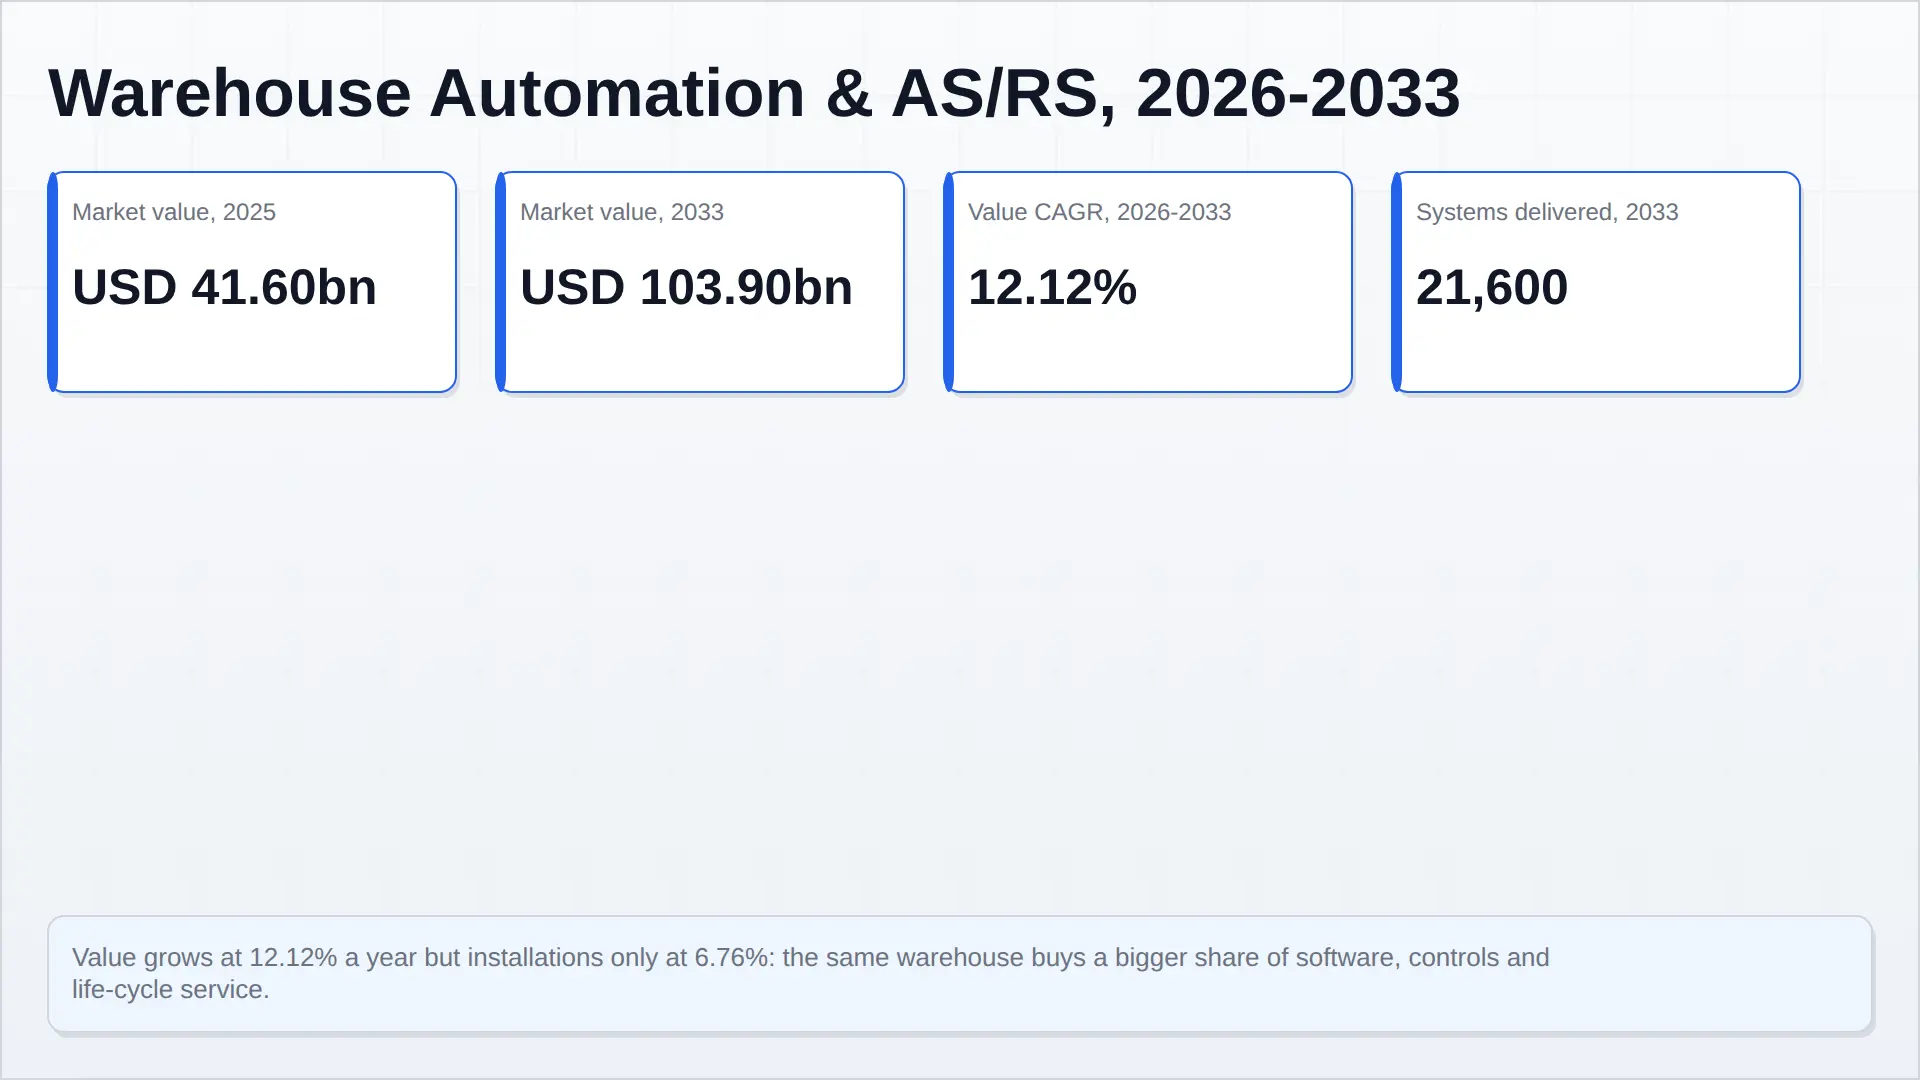
The warehouse automation market grows at 12.12 per cent a year and installations grow at 6.76 per cent, and the gap between those two numbers is the entire story. Pheonix Research sizes the global warehouse automation and automated storage and retrieval market at USD 41.60 billion in 2025, reaching USD 103.90 billion in 2033. Across the same eight years, systems delivered rise from 12,800 to 21,600 and revenue per installation rises from USD 3.25 million to USD 4.81 million, 5.02 per cent a year. The market is not mainly growing because more warehouses automate. It is growing because the average installation now contains a larger share of software, controls, integration and life-cycle service and a smaller share of steel.
The layer detail proves it. Cube storage compounds at 19.81 per cent a year and software and controls at 17.94 per cent, while conveyor and sortation grows 8.87 per cent and unit-load cranes 8.57 per cent — the two layers where a dollar buys the most metal. Unit-load, conveyor, mini-load and integration carry 69 per cent of value in 2025 and 57 per cent in 2033.
The demand side is not a forecast, it is a statistic. US warehousing and storage employment peaked at 1,939,300 in March 2022 and stood at 1,836,200 in December 2025 — 103,100 jobs gone, 45,000 of them in 2025 alone — while average hourly earnings in the sector rose from USD 24.99 to USD 26.21, 4.88 per cent, in the same year and reached USD 27.04 by September 2026. Fewer people, paid more, in the same buildings. In our own interviews the payback threshold most often quoted was 36 months, and the binding constraint was rarely the wage: it was the second shift that could not be staffed.
2025 split the suppliers in two. Symbotic grew revenue 26 per cent to USD 2,246.9 million. AutoStore fell 10.4 per cent to USD 538.6 million while its fourth-quarter order intake rose 35.1 per cent to USD 194.2 million — because in this industry the order arrives years before the revenue. Daifuku lifted operating income 24.4 per cent to ¥100.8 billion at a 15.3 per cent margin on sales growth of 2.6 per cent. KION Group's Supply Chain Solutions segment took €3,598.8 million of orders against €3,042.8 million of revenue at a 5.96 per cent adjusted EBIT margin. Kardex booked 24.1 per cent more and grew revenue 7.5 per cent, and its free cash flow fell 77.4 per cent — the cash cost of that growth, and the finding of Chapter 6.
Margin lives where the risk lives. The project integrator that carries the schedule earns 5.96 per cent adjusted, or 2.80 per cent reported. The product company that ships boxes to that integrator earns a 72.4 per cent gross margin and a 43.3 per cent adjusted EBITDA margin in its final quarter. That dispersion is not a pricing accident; it is the price of completion risk, and Chapter 2 takes it apart layer by layer.
What would break this forecast is not a technology failure. It is the third falsifier in Chapter 6: if suppliers re-bundle control software back into the hardware at no incremental price, revenue per system stops rising, and the market reverts to its installation growth rate of 6.76 per cent rather than its value growth rate of 12.12 per cent. Everything else in this report follows from which of those two numbers the industry is actually earning.
Chapter 1 — Executive summary, scope and the 2025 baseline
Global warehouse automation and automated storage and retrieval was a USD 41.60 billion market in 2025. Pheonix Research puts it at USD 103.90 billion in 2033, 12.12 per cent a year. The headline is not the most useful number in this report. The useful number is what happens underneath it: installations rise from 12,800 systems to 21,600 across the same eight years — 6.76 per cent a year — while revenue per installation rises from USD 3.25 million to USD 4.81 million — 5.02 per cent a year. Multiply those two rates and you arrive at the third. The market is not mainly growing because more warehouses automate. It is growing because the average installation has become a different product.
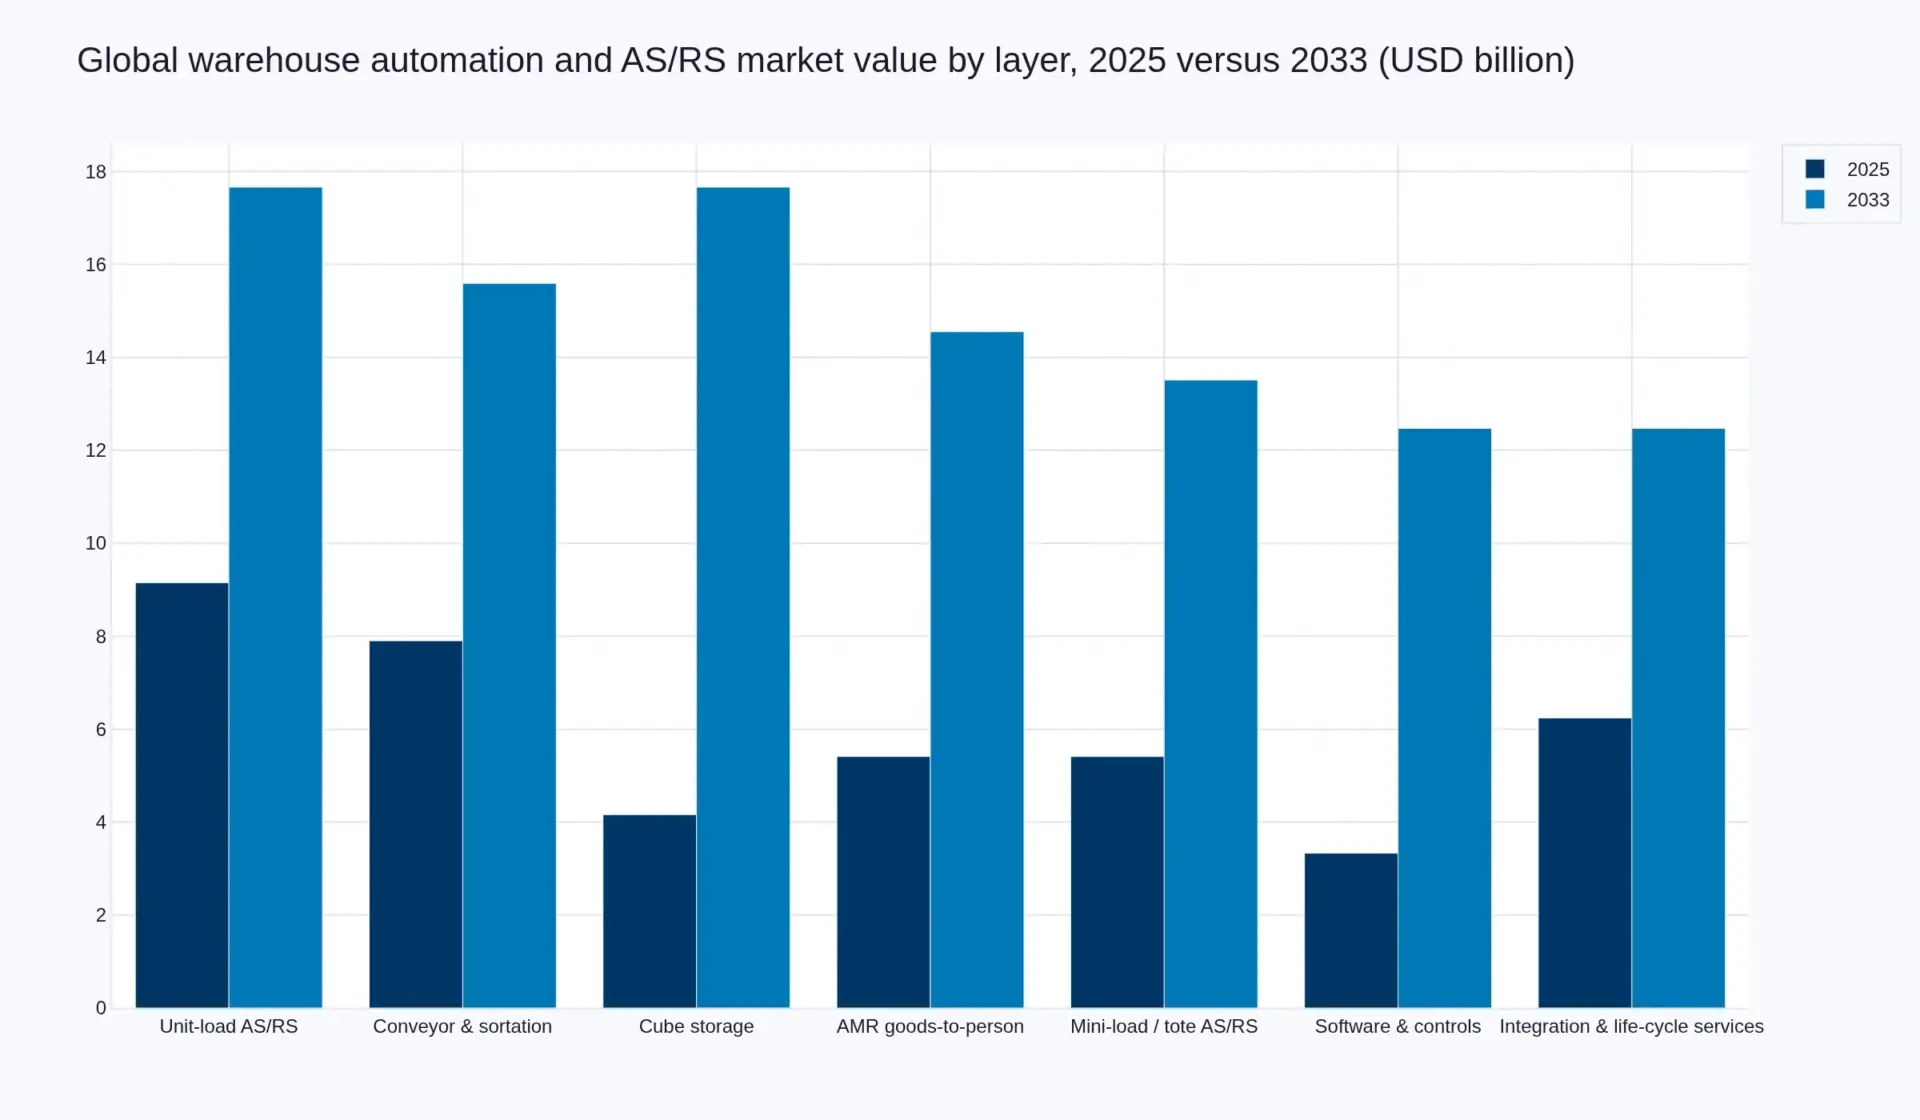
In 2025 the layers moving fastest were the ones where a dollar buys the least steel. Cube storage compounds at 19.81 per cent (USD 4.16 billion to USD 17.66 billion) and software and controls at 17.94 per cent (USD 3.33 billion to USD 12.47 billion); AMR-based goods-to-person follows at 13.16 per cent. The two slowest layers are conveyor and sortation at 8.87 per cent and unit-load crane systems at 8.57 per cent — the two where the customer is, overwhelmingly, buying metal and the labour to bolt it down. Unit-load, conveyor, mini-load and integration together carry 69 per cent of value in 2025 and 57 per cent in 2033. The difference is cube, robots and code.
The demand side of that shift sits in the labour statistics and it is unambiguous. US warehousing and storage employment (NAICS 493) peaked at 1,939,300 in March 2022. By December 2025 it was 1,836,200 — down 103,100 jobs, or 5.32 per cent, from the peak, and 45,000 of those went in 2025 alone. Over that same year average hourly earnings in the sector rose from USD 24.99 to USD 26.21, 4.88 per cent, and by September 2026 they reached USD 27.04. Fewer people, better paid, working in the same buildings: that is the commercial case for warehouse automation in one sentence, and it is why the decision survived a year in which several large vendors' order books wobbled.
The arithmetic an operator actually runs compares two rates. A single warehouse associate at USD 26.21 an hour, on 2,080 paid hours, costs about USD 54,500 a year before benefits, supervision, recruitment and the cost of a vacancy the recruiter cannot fill. In our interviews across 2024–2026 the payback threshold most often quoted was 36 months, and the binding constraint was rarely the wage rate on its own. It was the second shift. An operator who cannot staff a night shift does not compare automation with labour; they compare automation with a service-level penalty, and that comparison almost always clears. This is a Pheonix fieldwork finding, not a disclosed figure, and it explains why order intake in this sector recovers faster than revenue: the decision is defensive before it is ambitious.
2025 was not a uniform year for suppliers, and the divergence is diagnostic. Symbotic grew revenue 26 per cent to USD 2,246.9 million. AutoStore fell 10.4 per cent to USD 538.6 million even while fourth-quarter order intake rose 35.1 per cent to USD 194.2 million and its backlog reached USD 557.0 million. Daifuku grew sales 2.6 per cent to ¥660.7 billion and lifted operating income 24.4 per cent to ¥100.8 billion, a 15.3 per cent margin. KION Group's Supply Chain Solutions segment took €3,598.8 million of orders against €3,042.8 million of revenue and closed the year with a €2,688.4 million order book. Kardex booked 24.1 per cent more (€981.6 million) on revenue growth of 7.5 per cent (€850.4 million). Every one of those is the same structural fact seen from a different angle: in this industry the order arrives years before the revenue, so one year's income statement measures decisions taken in a different market.
What this report counts. Seven layers: unit-load AS/RS (pallet cranes and pallet shuttles), mini-load and tote AS/RS, cube storage, AMR and AGV goods-to-person and shelf-to-person, conveyor and sortation, warehouse execution and control software including controllers, and the integration, commissioning and life-cycle service attributable to those systems. Value is recognised on the supplier's own revenue basis, which for project business means percentage-of-completion. Volume is counted as systems delivered at installation level, from a single vertical lift module to a multi-aisle pallet installation. That definitional choice is why the blended average system is USD 3.25 million and not USD 30 million.
What it excludes, and why that matters. Basic pallet racking and shelving, manual and rider-operated forklifts, stand-alone warehouse management software sold without automation, third-party logistics and warehouse labour services, and everything to do with on-road freight. Those exclusions are the reason credible published figures for this market differ by a factor of two. A perimeter that includes racking and forklifts is a warehouse equipment market of roughly twice the size; a perimeter of AS/RS hardware alone is roughly a third of this one. Two further sources of divergence are common and worth naming: counting orders where this report counts revenue, and excluding Chinese and regional integrators where this report includes them at an explicit coverage ratio.
Three figures that should be read together and never as one. Supplier revenue is not market size, because a project business books twelve months of income from a contract priced three years earlier. Orders are not revenue, which is why Kardex could grow bookings 24.1 per cent and revenue 7.5 per cent in the same twelve months. And AS/RS is not warehouse automation: cube storage, robots and software all now sit inside a category that was, for thirty years, a synonym for a crane in an aisle.
Table 1 — Market value by layer, 2025 and 2033
| Layer | 2025 (USD bn) | Share, 2025 | 2033 (USD bn) | Share, 2033 | CAGR, 2026–2033 |
|---|---|---|---|---|---|
| Unit-load AS/RS (pallet cranes and shuttles) | 9.15 | 22.0% | 17.66 | 17.0% | 8.57% |
| Conveyor and sortation | 7.90 | 19.0% | 15.59 | 15.0% | 8.87% |
| AMR and AGV goods-to-person | 5.41 | 13.0% | 14.55 | 14.0% | 13.16% |
| Mini-load and tote AS/RS | 5.41 | 13.0% | 13.51 | 13.0% | 12.12% |
| Cube storage | 4.16 | 10.0% | 17.66 | 17.0% | 19.81% |
| Software and controls | 3.33 | 8.0% | 12.47 | 12.0% | 17.94% |
| Integration and life-cycle services | 6.24 | 15.0% | 12.47 | 12.0% | 9.04% |
| Total | 41.60 | 100% | 103.90 | 100% | 12.12% |
How the six chapters fit together. The parent category this market sits inside is sized in our Global Industrial Automation Market report, and the fulfilment formats that place these orders are sized in our Global Quick Commerce & Instant Retail Market and Dark Store Networks & Micro-Fulfilment Market reports. Chapter 2 takes the value chain apart and shows where margin actually survives; Chapter 3 covers the technology that is moving share, including the transition year both Symbotic and AutoStore are inside; Chapter 4 maps four competitive positions across ten suppliers and the margin dispersion that separates them; Chapter 5 sets out the compliance instruments that make an installation legal and the cost they impose; Chapter 6 covers investment, capital allocation and the three falsifiers that would break the forecast.
Method, in one paragraph. This report is 70 per cent secondary and 30 per cent primary. The secondary base is company filing and statistical agency disclosure — Daifuku, KION Group, Vanderlande, Symbotic, AutoStore and Kardex results, US Bureau of Labor Statistics CES series for NAICS 493, and the 2026 MHI Annual Industry Report survey of more than 500 supply chain professionals. The primary base is 41 semi-structured interviews with operators, integrators and vendors across North America, Europe, India and Southeast Asia, structured interviews at three intralogistics trade events, 12 open-ended follow-ups on commissioned and rejected projects, and an operator survey on payback thresholds. No market-research competitor is cited anywhere in this report, in the text or in the Sources block.
The forecast assumes three things hold, and Chapter 6 tests each of them. That US warehousing pay continues to compound faster than headcount falls; that cube storage keeps taking share from conveyor-led projects at the rate disclosed order books imply; and that the software layer keeps decoupling from the machine, so that the same installation can be sold twice — once as equipment and once as control. A fourth assumption, that compliance costs stay broadly stable, is the one we would watch hardest: the European machinery regime changes in January 2027 and it changes what has to be documented before a system may run.
Table of Contents
Table of contents
- Executive summary, scope and the 2025 baseline — why value compounds at 12.12 per cent while installations compound at 6.76 per cent, what the perimeter includes and excludes, and the three figures that must never be read as one.
- Value chain and margin structure — seven layers, four archetypes, and the finding that margin accrues exactly where the completion risk does not: the integrator earning 5.96 per cent carries the schedule, and the product company earning 43.3 per cent carries none of it.
- Technology and innovation — cube storage at 19.81 per cent, the platform transitions Symbotic and AutoStore are both inside, why control software is decoupling from the machine, and why humanoid robotics is not in this forecast.
- Competitive landscape — four positions across ten suppliers, a market where the largest single supplier holds under a tenth, and two cube businesses that moved in opposite directions in the same twelve months.
- Regulatory landscape — the conformity file that decides whether a system may run, the European machinery regime that changes in January 2027, and why compliance is a price floor rather than a cost line.
- Investment activity and market risk — where capital actually goes when capex runs at 3.2 per cent of revenue, the working capital that grows four and a half times faster than sales, four sensitivities and three falsifiers.
Tables
- Table 1 — Market value by layer, 2025 and 2033
- Table 2 — Seven layers: what the customer buys, and the margin that survives
- Table 3 — Ten suppliers, four positions, disclosed FY2025 revenue and margin
- Table 4 — Compliance instruments and what each one obliges
- Table 5 — Sensitivity and falsification tests
- Table 6 — US warehousing employment and hourly earnings, 2022–2026
Figures
- Figure 1 — Market summary infographic (also the cover image, top of report)
- Figure 2 — Market value by layer, 2025 versus 2033, in Chapter 1
- Figure 3 — Order backlog at year-end 2025 as a share of FY2025 revenue, in Chapter 4
- Figure 4 — US warehousing hourly earnings, 2023 to 2026, in Chapter 6
All six chapters are original Pheonix Research analysis. Every figure in this report is attributable to a company filing, a statistical agency or an industry-association survey, and every one of them appears in the Sources block at the end of Chapter 6. Every company named in Chapter 4 is linked to its own site, and every internal link points to a published Pheonix Research report. No competitor research is cited anywhere in this document, and every ratio, share and forward path in the text is reproducible from the tables.
Competitive Landscape
Chapter 4 — Competitive landscape
The largest supplier in this market holds under a tenth of it, and that is the most important structural fact in the report. KION Group’s Supply Chain Solutions segment reported €3,042.8 million of external revenue in 2025. At roughly USD 1.13 to the euro — a planning assumption used throughout, not a disclosed annual average — that is about USD 3.44 billion, or 8.3 per cent of a USD 41.60 billion market. Daifuku, the largest crane and intralogistics builder in the world, reported group sales of ¥660.7 billion, which at its own disclosed effective rate of ¥149.87 to the dollar is USD 4.41 billion across intralogistics, cleanroom, automotive and airport systems combined. There is no dominant position here, no supplier with pricing power over a market, and no consolidation endpoint in sight.
Four positions, and they behave like four different industries. The first is the diversified Asian machine builder: Daifuku and Murata Machinery, selling cranes, shuttles, cleanroom and automotive handling from a manufacturing base, earning a respectable group operating margin and treating warehouse automation as one product line among several. The second is the European project integrator: KION through Dematic, Vanderlande, Swisslog and Kardex, selling integrated projects with completion risk attached, and earning between 2.8 and 11.9 per cent depending on how much of the project they manufacture themselves. The third is the American systems company: Symbotic and Honeywell through Intelligrated, closer to a single large customer relationship and closer to a platform than to a project. The fourth is the cube specialist: AutoStore and Ocado Intelligent Automation, which sell a productised system and let partners carry the site.
Table 3 — Ten suppliers, four positions, disclosed FY2025 figures
| Company | Position | Disclosed FY2025 scale | Disclosed margin |
|---|---|---|---|
| Daifuku | Diversified Asian machine builder | Group sales ¥660.7bn (+2.6%); orders ¥672.6bn | Operating 15.3% (+2.7pt) |
| KION Group (Dematic) | European project integrator | Supply Chain Solutions revenue €3,042.8m; orders €3,598.8m; order book €2,688.4m | Adjusted EBIT 5.96%; reported EBIT 2.80% |
| Vanderlande | European project integrator | Group turnover €2.3bn; Industries B.V. revenue €730.8m (+20.4%) | Industries B.V. profit €30.2m after a €15m loss in FY2024 |
| Honeywell (Intelligrated) | American systems company | Warehouse automation not broken out of group revenue | Not separately disclosed |
| Symbotic | American systems company | Revenue USD 2,246.9m (+26%); systems 94.3% of it | Gross 18.81%; net loss USD 91m; adjusted EBITDA USD 147m |
| AutoStore | Cube specialist | Revenue USD 538.6m (−10.4%); backlog USD 557.0m | Gross 72.4%; Q4 adjusted EBITDA 43.3% |
| Kardex | European product and systems group | Net revenue €850.4m (+7.5%); bookings €981.6m (+24.1%) | EBIT 11.9%; ROIC 35.0% |
| Murata Machinery | Diversified Asian machine builder | Group scale only; logistics and automation not broken out | Not separately disclosed |
| Ocado Group (OIA) | Cube specialist | Ocado Intelligent Automation not broken out of group revenue | Not separately disclosed |
| Swisslog | European project integrator | Not broken out at group level | Not separately disclosed |
Three of these companies run the same business model and report nothing comparable, which is itself a finding. Honeywell, Murata Machinery, Ocado Group and Swisslog all compete in this market and none of them discloses warehouse-automation revenue in a form that can be placed beside Dematic’s €3.04 billion. No revenue figure is attributed to them in this report. The consequence for a buyer is practical: the only suppliers whose performance can be underwritten from public disclosure are the six that break the segment out, and the only suppliers whose health a customer can check between contract signature and delivery are the listed ones.
The margin dispersion is the competitive map. Daifuku earns 15.3 per cent operating on a business that manufactures its own cranes. Kardex earns 11.9 per cent EBIT on a mix that is three-quarters new business and one-quarter life-cycle service. KION’s Supply Chain Solutions segment earns 5.96 per cent adjusted and 2.80 per cent reported, with €82.5 million of purchase price allocation inside the segment. Symbotic earns 18.81 per cent gross and loses USD 91 million net while spending to industrialise a platform. AutoStore earns 72.4 per cent gross because it sells components. Ranked by margin, the order is: product company, machine builder, product-and-systems group, project integrator — which is precisely the order of who carries least completion risk.
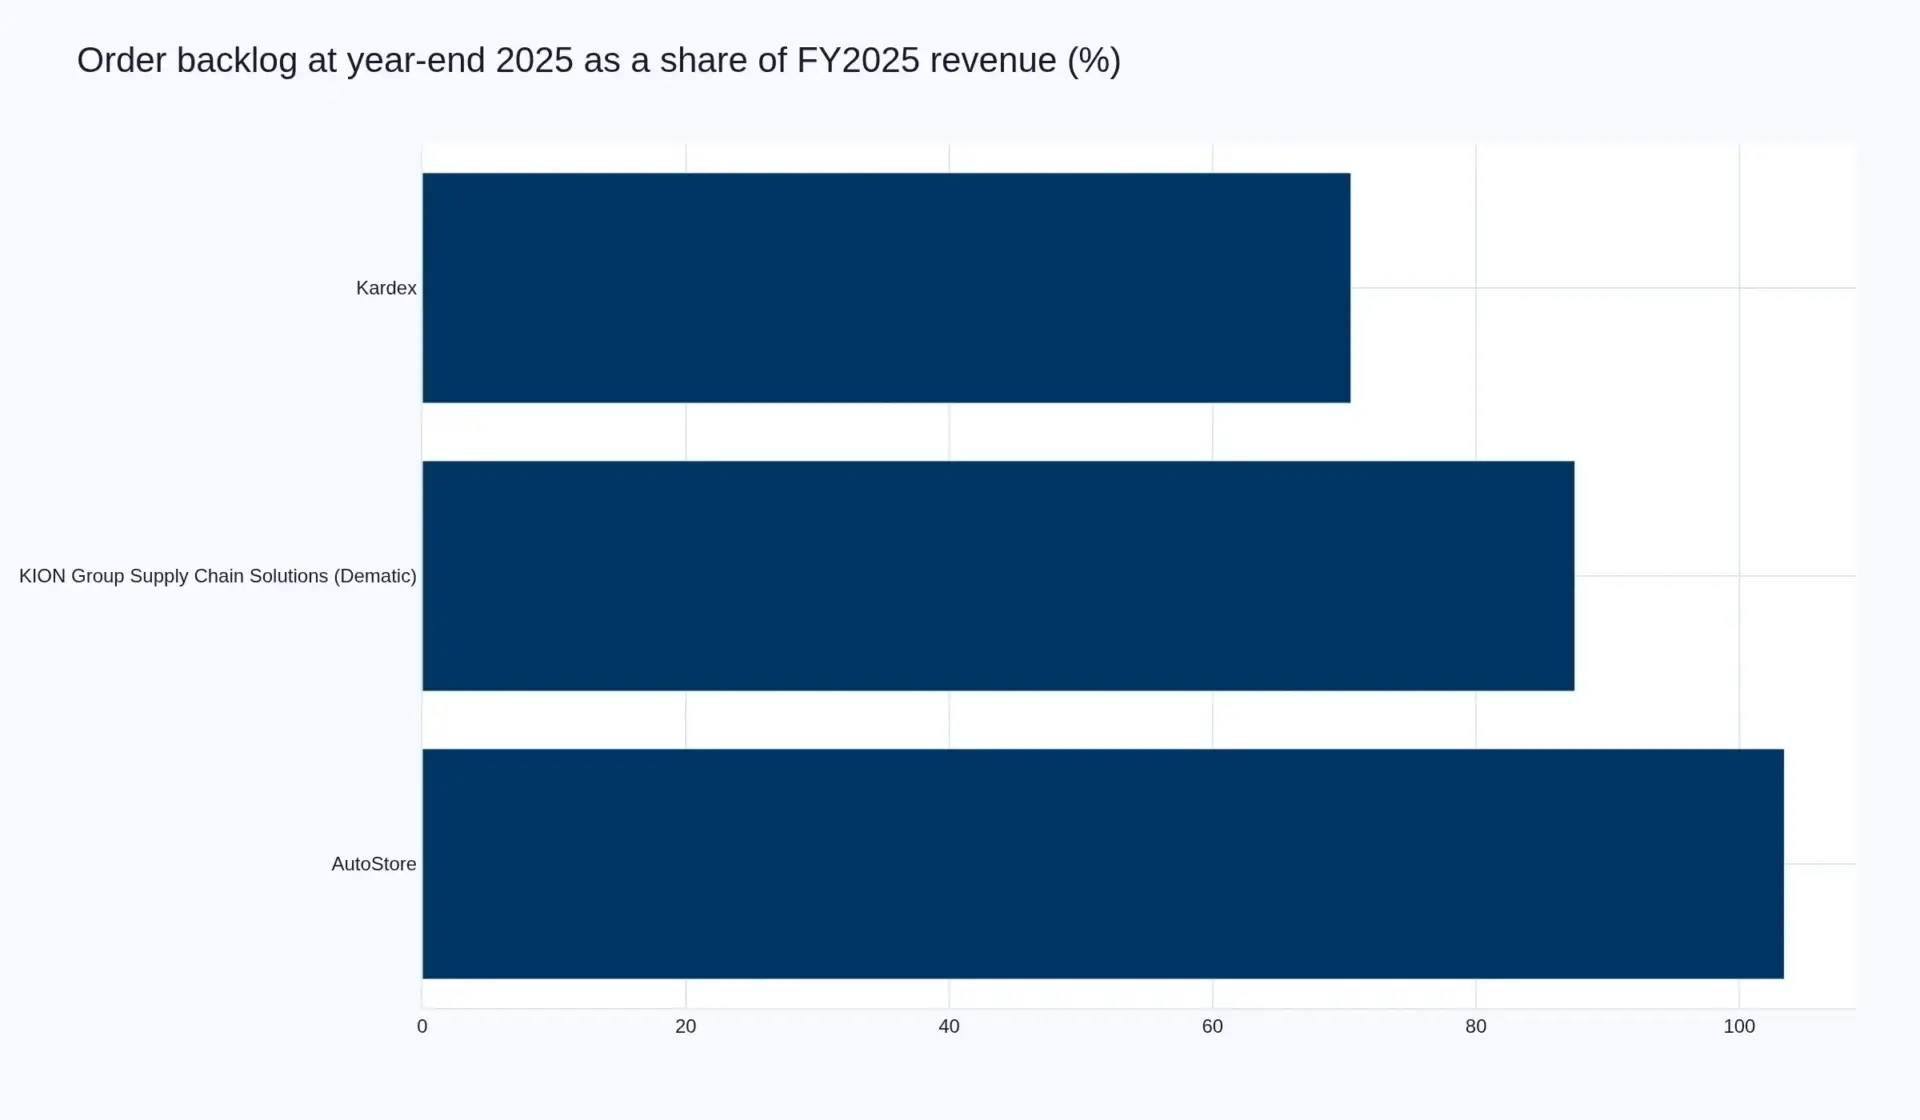
Order book is the only competitive metric in this industry that is not historical. AutoStore ended 2025 with USD 557.0 million of backlog against USD 538.6 million of revenue — 103.4 per cent cover. KION’s Supply Chain Solutions segment closed with €2,688.4 million against €3,042.8 million, 87.5 per cent. Kardex closed with €599.2 million against €850.4 million, 70.5 per cent. Read together with the revenue lines, the three tell you something the growth rates cannot: AutoStore is selling more than a year ahead of delivery and shrinking this year, KION is selling about ten months ahead with a thin margin, and Kardex is growing bookings fastest — 24.1 per cent — while converting them slowly. Those are three different answers to the same question, which is how much future revenue has already been promised.
Two cube businesses moved in opposite directions in the same twelve months, and the market read it as a verdict on cube storage. It was not. Symbotic grew 26 per cent while AutoStore fell 10.4 per cent. But Symbotic sells complete systems to a small number of very large customers and was mid-transition to a new storage structure; AutoStore sells components to hundreds of integrators and added 150 new customers during the year. One company’s revenue is a function of a handful of decisions made three years earlier; the other’s is a function of a distribution network’s conversion rate in the current quarter. Treating their divergence as evidence about demand is a category error, and it is the most common one made about this sector.
What procurement actually does, from our own fieldwork. In the 41 interviews behind this report, the shortlist was almost always three or four names and rarely more, the decision criterion most often cited first was a reference site within a day’s travel, and the price came third behind a documented uptime commitment. The one variable that changed the outcome most often was not technology but the client’s own building: clear height, floor flatness and fire compartmentation decided more tenders than any specification sheet. That is why the integrator’s engineering headcount, not its product catalogue, is the capacity constraint in this market, and why the order book of a good integrator is a better measure of its prospects than its revenue.
Value Chain
Chapter 2 — Value chain and margin structure
The most profitable company in this market does not build warehouses. It sells boxes to the companies that do. AutoStore reported a 72.4 per cent gross margin for 2025 and a 43.3 per cent adjusted EBITDA margin in its fourth quarter, on revenue of USD 538.6 million. In the same year KION Group’s Supply Chain Solutions segment — Dematic, the largest Western project integrator in this business — reported revenue of €3,042.8 million from external customers, adjusted EBIT of €183.2 million and reported EBIT of €85.9 million. That is 5.96 per cent adjusted and 2.80 per cent reported. Two companies selling the same technology into the same buildings, and one of them keeps forty-three cents on the dollar while the other keeps two-point-eight.
The difference is not pricing power or engineering skill. It is who carries completion risk. A project integrator signs for a date, a throughput number and an uptime figure on a building that does not yet exist, using equipment made by other people, installed by subcontractors, at a client site where the racking went in late. Revenue is recognised on percentage of completion, so the integrator books income as the risk is consumed and re-books any overrun as cost. A product company sells an engineered module to that integrator and its exposure ends at the loading bay. The margin dispersion in this industry is the price of that transfer, and it is remarkably stable: our fieldwork found the same spread described by procurement teams in three continents, in almost the same words.
Table 2 — Seven layers: what the customer buys, and the margin that survives
| Layer | What the customer is actually buying | Who earns the margin | Archetype margin, FY2025 |
|---|---|---|---|
| Unit-load AS/RS (cranes, pallet shuttles) | Density and the elimination of the aisle | Diversified machine builders | 15.3% operating (Daifuku, group) |
| Mini-load and tote AS/RS | Order-profile flexibility at high SKU count | European integrators and product specialists | 11.9% EBIT (Kardex) |
| Cube storage | Storage density plus a software-defined layout | Product companies selling through partners | 72.4% gross, 43.3% adjusted EBITDA (AutoStore, Q4) |
| AMR and AGV goods-to-person | Reconfigurability as the catalogue changes | Robotics vendors and fleet-software firms | Not separately disclosed |
| Conveyor and sortation | Throughput per hour, at the lowest installed cost per metre | Project integrators | 5.96% adjusted EBIT (KION SCS) |
| Software and controls | The right to change the system without rebuilding it | Whoever owns the execution layer | Not separately disclosed |
| Integration and life-cycle services | Uptime, spares, and a number to call at 2am | The incumbent installer, by default | 26.46% of revenue (Kardex LCS) |
Follow the money down the chain and it pools in two places. The first is the product company: AutoStore sells to system integrators, who carry the installation, the site and the customer relationship, and AutoStore’s own commentary makes the arrangement explicit — all sales are distributed, designed, installed and serviced through a network of qualified partners. That structure is why the margin survives. The second pool is the installed base. Kardex generated €225.0 million of life-cycle service revenue, 26.46 per cent of its €850.4 million, and grew that line 14.6 per cent while new business grew 27.5 per cent. In a year when the group’s net profit fell 48.3 per cent to €41.8 million, the service annuity is what held the operating result at €101.2 million and ROIC at 35.0 per cent.
The middle of the chain is where the money leaks. Daifuku’s FY2025 results explain its own margin improvement in almost forensic terms: operating income rose 24.4 per cent to ¥100.8 billion on sales growth of 2.6 per cent, and the company attributes it to cost reductions from production efficiency, enhanced project management, and a deliberate focus on securing orders with strong profitability. Read that last clause again. The largest crane builder in the world grew profit four times faster than revenue by declining work it did not want. That is the signature of a project business in a soft order year, and it is the opposite of what a growth market usually rewards.
Growth in this industry consumes cash, and 2025 is the cleanest demonstration available. Kardex booked 24.1 per cent more than 2024 and grew revenue 7.5 per cent, and its net working capital rose 33.8 per cent to €118.8 million — four and a half times the rate of sales. Free cash flow fell 77.4 per cent to €20.5 million while the order backlog rose 26.0 per cent to €599.2 million. None of that is mismanagement; it is what happens when a business takes on more projects than it completes in the same period. Steel is bought and labour is paid months before the client is invoiced. KION’s Supply Chain Solutions segment ended 2025 with a €2,688.4 million order book against €3,042.8 million of annual revenue, and the balance sheet funds the gap.
Which produces the structural finding of this chapter. Value in this market is migrating toward the two positions that carry least completion risk — the product company and the software layer — and away from the position that carries the most. On our model, software and controls rise from 8.0 per cent of market value to 12.0 per cent by 2033 and cube storage from 10.0 to 17.0 per cent, while conveyor and sortation fall from 19.0 to 15.0 per cent and unit-load cranes from 22.0 to 17.0. If that mix shift holds, the blended margin of the industry improves without a single supplier raising a price. If it reverses — and Chapter 6 gives that reversal a name and a test — the industry is left with the steel and the schedule risk, and a 5.96 per cent margin to show for it.
One caution on reading these margins side by side. Daifuku’s 15.3 per cent is a group operating margin across intralogistics, cleanroom, automotive and airport systems, and is not a warehouse-automation margin. KION’s 5.96 per cent is adjusted, and €82.5 million of purchase price allocation sits inside that segment, which is why the reported figure is 2.80 per cent rather than 5.96. AutoStore’s 72.4 per cent is a gross margin on components sold to integrators, before the integrator’s own cost of delivery — comparing it with an operating margin is a category error that appears in almost every summary of this industry, and it is the error that makes the market look more profitable than it is.
Investment Activity
Chapter 6 — Investment activity and market risk
The industry does not need capital. It needs engineers and working capital.
KION Group spent €97.0 million of capital expenditure on its Supply Chain Solutions segment in 2025, against €3,071.4 million of segment revenue. That is 3.2 per cent, and the group figure is not much higher — €395.7 million against €11,297.2 million, or 3.50 per cent. For a market this size, that is an extraordinary ratio, and it is not an accident of one year. A project integrator’s assets are its people, its reference sites and the working capital tied up in unfinished projects. It does not need a fab, a foundry or a gigafactory. It needs to hire controls engineers, and it needs to fund steel it has bought but not yet invoiced.
Which makes the cash flow statement the most revealing document in this sector, and 2025 the clearest example of it. Kardex had a good year by every operating measure: bookings up 24.1 per cent to €981.6 million, revenue up 7.5 per cent to €850.4 million, EBIT of €101.2 million at an 11.9 per cent margin, ROIC of 35.0 per cent, net cash of €136.5 million and an equity ratio of 53.6 per cent. And free cash flow fell 77.4 per cent to €20.5 million, because net working capital rose 33.8 per cent to €118.8 million and headcount rose 10.4 per cent to 2,957 full-time equivalents. Growth in this industry is paid for in advance. A business that wins more work than it can deliver in the same period converts profit into inventory and unbilled contract assets, and it hires before it earns.
The same pattern appears at the other end of the market, in reverse. AutoStore converted 84.3 per cent of its earnings into cash in the fourth quarter because it sells components to integrators who carry the project working capital — the structural advantage of the product position, restated in cash rather than in margin. Symbotic ended fiscal 2025 with USD 1,245 million of cash and equivalents after adding USD 467 million in a single quarter, on adjusted EBITDA of USD 147 million, having absorbed the cost of industrialising a platform and rebuilding an installed base. Three companies, three positions in the value chain, three completely different relationships between growth and cash.
What the disclosed investment data does not show is consolidation, and its absence is the finding. No material transaction among the ten suppliers profiled in Chapter 4 was disclosed in 2025. The reason is structural rather than cyclical: an integrator is bought for its order book, its reference sites and its engineering headcount, and none of those three can be valued by a diligence process in the way a factory or a patent portfolio can. A buyer also inherits completion risk on every contract in progress — the one thing the seller’s margin was compensating for. Vanderlande’s own FY2025 result shows how thin that risk can leave the equity: a €30.2 million profit on €730.8 million of revenue at the operating entity, after a €15 million loss the year before. Good engineering businesses in this sector do not look cheap or expensive. They look unpriceable.
Where capital would rationally go next is the software and controls layer, and that is where it has not yet gone. If software and controls rise from 8.0 per cent of market value to 12.0 per cent by 2033 — the fastest growth of any layer after cube storage — then the asset worth acquiring is not a crane builder with a European order book. It is a warehouse execution software business with several hundred installations and no hardware to write down. No supplier in this report has yet made that move at scale, which means the industry’s most obvious strategic acquisition remains available to whoever prices completion risk correctly.
Sensitivity and the three tests that would break this forecast
A forecast built on two multiplied rates is easy to stress, because the two rates can be stressed independently. Installations compound at 6.76 per cent and revenue per installation at 5.02 per cent. Hold the layers’ mix constant and the model reduces to those two numbers. Break the first and the market still grows respectably; break the second and it stops being the market described in this report.
Table 5 — Sensitivity and falsification tests
| Variable | Base case | Bear | Bull | 2033 market value | What to watch |
|---|---|---|---|---|---|
| Installations, CAGR 2026–2033 | 6.76% | 4.00% | 8.00% | Base USD 103.9bn Bear USD 64.1bn Bull USD 122.7bn |
Disclosed order intake at the four listed suppliers |
| Revenue per installation, CAGR | 5.02% | 1.50% | 6.00% | Software and controls share of disclosed revenue | |
| Combined value CAGR | 12.12% | 5.56% | 14.48% | Divergence between bookings growth and revenue growth |
The first falsifier is the labour case. US warehousing and storage pay rose 4.88 per cent in 2025 while the sector shed 45,000 jobs, and earnings reached USD 27.04 an hour by September 2026. If that reverses — pay growth below 2 per cent for two consecutive years while headcount rises — the arithmetic in Chapter 1 weakens at its base, because the second-shift argument depends on a labour market that cannot fill the shift. This is testable monthly from the Bureau of Labor Statistics series cited below, and it is the earliest warning available.
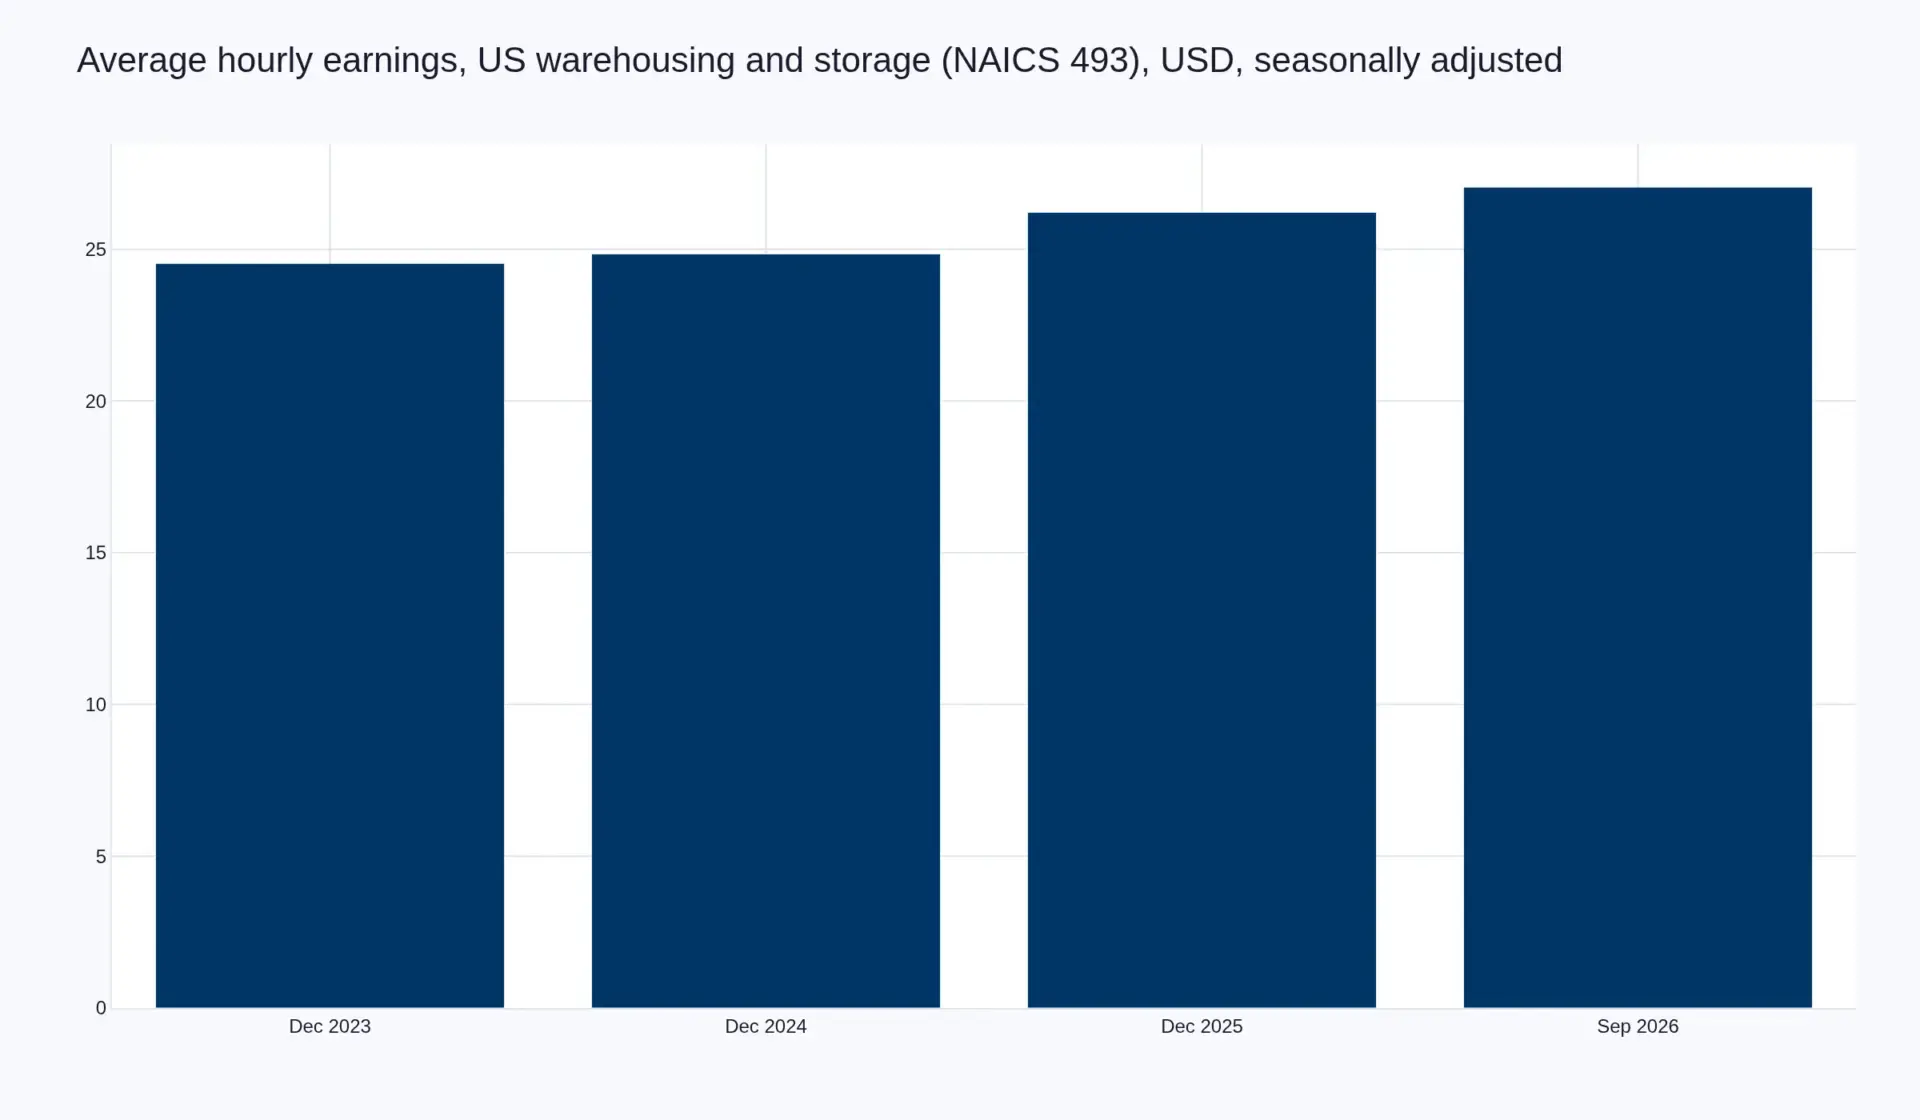
Table 6 — US warehousing employment and hourly earnings
| Period | All employees, thousands (seasonally adjusted) | Average hourly earnings, USD |
|---|---|---|
| March 2022 (employment peak) | 1,939.3 | — |
| December 2022 | 1,867.8 | — |
| December 2023 | 1,828.3 | 24.53 |
| December 2024 | 1,881.2 | 24.84 |
| December 2025 | 1,836.2 | 26.21 |
| September 2026 | — | 27.04 (preliminary) |
The second falsifier is the share shift itself. Cube storage grows at 19.81 per cent in this model because disclosed order books and product release cadence support it. The test is not whether cube storage grows but whether it keeps taking share from conveyor-led projects at the same time as its price holds. If AutoStore’s backlog cover falls below 80 per cent of revenue while its gross margin erodes, and if Symbotic’s growth begins to require concessions, then cube has become a price-competitive commodity inside a category that is still growing, and 19.81 per cent is the wrong number. Watch order intake and gross margin together, never one alone.
The third falsifier is the one worth holding hardest, because it silently changes the size of the market. The 12.12 per cent depends on revenue per installation rising 5.02 per cent a year — on software and service being sold as something a customer pays for separately. If suppliers re-bundle control software into the hardware at no incremental price, as the camera industry did with computational photography, then revenue per installation stops rising, and this market reverts to its installation growth rate of 6.76 per cent. Total 2033 value would then be roughly the bear case. Nothing in the income statements would look alarming as it happened; the revenue would simply arrive attached to a machine instead of beside it. The test is a single ratio: industry value growth converging on installation growth for two consecutive years while systems revenue keeps growing.
A fourth risk sits outside the model and inside the calendar. The European conformity regime changes on 20 January 2027. If the documented cost of compliance moves above 10 per cent of project value — roughly double our fieldwork estimate — integrator margins compress at exactly the point where order books are fullest, and some 2027 projects will be deferred rather than re-engineered. That is a timing risk to the path rather than to the destination, and it is the reason we have not front-loaded growth into 2027.
A scope warning, stated once and meant. Credible published estimates for this market differ by a factor of two, and the difference is almost never analytical. It is definitional: whether racking and forklifts are inside the perimeter, whether orders or revenue are counted, whether Chinese and regional integrators are included, and which year’s exchange rate was used. Every figure in this report is attributable, every share is reproducible from Table 1, and where a number is a Pheonix estimate rather than a disclosure it is labelled as one in the sentence that carries it.
Related Pheonix Research
This report sits inside a set. The parent category is sized in the Global Industrial Automation Market; the fixed-automation layer adjacent to AMR fleets is covered in the Global Robotic Arm Market; the condition-monitoring software that increasingly shares a data layer with warehouse execution is in the Global Predictive Maintenance Market; the fluid-power side of the same installed base is in the Global Leak Detection Market; and the autonomous platforms that share the safety case are in the Global Underwater Robotics Market. On the demand side, the fulfilment formats placing the orders are covered in the Global Quick Commerce & Instant Retail Market and the Dark Store Networks & Micro-Fulfilment Market, and the compliance-floor argument in Chapter 5 is developed in full in the Global Healthcare Security Systems Market.
Sources
- Daifuku Co., Ltd., Consolidated Financial Results, Fiscal 2025 (January–December 2025), results presentation — orders, net sales, operating income, segment commentary and disclosed effective exchange rates.
- KION GROUP AG, Annual Report 2025, Note 41 Segment report — Supply Chain Solutions revenue, order intake, order book, adjusted EBIT, capital expenditure and employees.
- Symbotic Inc., Symbotic Reports Fourth Quarter and Fiscal Year 2025 Results, 24 November 2025 — revenue by line, gross profit, net result, adjusted EBITDA, cash and first-quarter fiscal 2026 outlook.
- AutoStore Holdings Ltd., Q4 2025 financial results, 12 February 2026 — full-year and fourth-quarter revenue, order intake, backlog, gross and adjusted EBITDA margins, cash flow conversion, installed systems and partner distribution model.
- Kardex Holding AG, Annual Report 2025 — bookings, net revenue, order backlog, life-cycle services share, EBIT, free cash flow, net working capital, ROIC, headcount and regional demand commentary including tariffs.
- Vanderlande Industries B.V., Annual Report FY25 — group turnover, operating entity revenue and result, employees and installed-base statistics.
- US Bureau of Labor Statistics, Current Employment Statistics, series CES4349300001 — all employees, warehousing and storage (NAICS 493), seasonally adjusted, extracted 19 November 2026.
- US Bureau of Labor Statistics, Current Employment Statistics, series CES4349300003 — average hourly earnings of all employees, warehousing and storage (NAICS 493), seasonally adjusted, extracted 19 November 2026.
- MHI, 2026 MHI Annual Industry Report: Rewiring the Future — A Supply Chain Playbook for Innovation — survey of more than 500 supply chain professionals; technology adoption, barriers and challenges.
- Pheonix Research primary fieldwork, 2024–2026 — 41 semi-structured interviews with warehouse operators, systems integrators and automation vendors across North America, Europe, India and Southeast Asia; structured interviews at three intralogistics trade events; 12 open-ended follow-up interviews on commissioned and rejected projects; operator survey on payback thresholds and compliance burden.
All web sources were opened and read in the preparation of this report. No market-research competitor is cited anywhere in this document.
Technology & Innovation
Chapter 3 — Technology and innovation
The most software-narrated company in warehouse automation still books 94.3 per cent of its revenue as systems. Symbotic’s fiscal 2025 revenue of USD 2,246.9 million breaks down into USD 2,118.9 million of systems, USD 98.5 million of operation services and USD 29.6 million of software maintenance and support — 94.31, 4.38 and 1.32 per cent respectively. That is the honest starting point for any discussion of technology in this market. The industry talks about itself as a software business and earns its money as a construction business, and the gap between those two statements is where the next eight years of margin will be decided.
Three technology vectors carry the share shift, and they are not equally mature. Density — cube storage, where goods are stored in a grid rather than along an aisle, now compounds at 19.81 per cent a year in this model and rises from 10.0 per cent of market value to 17.0 per cent by 2033. Mobility — AMR-based goods-to-person and shelf-to-person, where the layout is defined in software rather than in steel, compounds at 13.16 per cent. Control — the execution and warehouse-control layer that orchestrates both, and increasingly orchestrates several vendors at once — compounds at 17.94 per cent. Everything else in this chapter is a consequence of those three.
Cube storage is the clearest commercial proof that density is a product and not a project. AutoStore ended 2025 with approximately 1,900 systems installed across 65 countries, having added 150 new customers during the year and released eleven new products. Its model is a deliberate inversion of the integrator’s: every sale is distributed, designed, installed and serviced by a network of qualified system integrators, which is why the company can report a 72.4 per cent gross margin on USD 538.6 million of revenue while the integrators who deliver its systems report operating margins in the mid single digits. It sells the engine; they sell the aircraft and take the airline’s schedule risk. That structure explains both the margin and the vulnerability — a product company with no direct customer relationship depends entirely on its partners’ pipelines, and 2025 showed what that costs when those pipelines pause. Revenue fell 10.4 per cent for the year while fourth-quarter order intake rose 35.1 per cent.
Symbotic’s 2025 is a platform transition, and it should be read as one. Full-year revenue grew 26 per cent, but the company’s own framing of the year ahead is that its customers are continuing their transition to our next generation storage structure, and its first-quarter fiscal 2026 guidance of USD 610 million to USD 630 million is roughly flat against the USD 618.5 million delivered in the fourth quarter of fiscal 2025. A base-wide platform migration does three things at once: it depresses near-term systems revenue because the installed base is being rebuilt rather than expanded, it raises the value of every future site, and it converts a hardware relationship into a repeat-purchase relationship. It also puts a large amount of engineering risk into a single twelve-month window. Whatever the outcome, the pattern is important for the whole sector: the growth in this market is increasingly coming from replacing systems that are eight to twelve years old rather than from greenfield warehouses, and no supplier has yet published a replacement cycle it is willing to be measured on.
The four transitions this report scores
- From aisle to grid. Storage density stops being a function of building height and starts being a function of software-defined slotting. The constraint is throughput per square metre, not storage per square metre, which is why the fastest-growing layer also has the highest software content.
- From fixed to mobile. AMR fleets move the reconfiguration cost from capital to configuration, and that matters most where a lease is short. In our interviews in India and Southeast Asia, the deciding variable was not labour cost but lease term: a five-year lease with a three-year payback clears, and a ten-year fixed installation does not.
- From machine control to execution. Warehouse execution software is being bought as an overlay onto estates that already contain more than one vendor’s hardware. In 7 of our 12 follow-up conversations with operators who had commissioned a system in the previous 18 months, the building contained equipment from at least two automation vendors, and the integration between them was the single largest source of unplanned cost.
- From delivery to simulation. A digital twin of the building is now expected in the tender rather than sold as an extra, because it transfers commissioning risk from the client to the supplier at the point the contract is signed. This is a quiet but consequential shift in who carries schedule risk, and it is one reason integrators are competing harder on engineering hours than on hardware price.
What is deliberately not in this forecast: humanoid robotics. The 2026 MHI Annual Industry Report, a survey of more than 500 supply chain professionals, tracks humanoid robotics among the eight technologies it scores, and places it firmly in the early-adoption category rather than the in-use category. Nothing in this model assumes it reaches commercial duty cycles before 2033. The reason is not scepticism about the technology; it is the arithmetic of a warehouse. A system is specified for 24-hour duty, a defined cycle time and a documented safety performance level under ISO 13849. A humanoid platform has to meet all three before a compliance file can be signed, and the first two are moving targets. If that changes, the AMR layer absorbs it first, because the AMR layer already owns the safety case, the fleet manager and the floor plan.
Innovation intensity is high and patent intensity is only moderate, and the distinction matters for anyone modelling defensibility. The mechanical arts in this industry — cranes, shuttles, conveyors — are mature and thoroughly documented; the innovation is in control, scheduling, energy management and the interface between robots and people. That kind of innovation is protected by integration know-how and by switching costs, not by patents. It is also why a competitor can copy a mechanism in eighteen months and cannot copy a commissioning organisation in five years. The competitive landscape in Chapter 4 is shaped almost entirely by that asymmetry; the fixed-automation layer this market sits beside is sized in our Global Robotic Arm Market report, and the condition-monitoring software that increasingly shares a data layer with warehouse execution is covered in our Global Predictive Maintenance Market report.
The one technological development that would move this model materially is a cube platform that handles full pallets at unit-load throughput without a crane. It would attack the 17.0 per cent of 2033 value still sitting in unit-load AS/RS, the slowest-growing layer in the report at 8.57 per cent, and it would do so from inside a layer already growing at 19.81 per cent. We have not assumed it. We have given it a test in Chapter 6, because a supplier that gets there first does not take share from conveyor — it takes the installed base.
Market Risk
Market risk summary
Four sensitivities govern the path and three falsifiers govern the number. The sensitivities are the labour market in Chapter 1, the interest rate at which a 36-month payback is discounted, customer concentration at the systems companies, and the compliance calendar in Chapter 5. The falsifiers are set out in full above: pay growth reversing, cube storage ceasing to take share at a stable price, and control software being re-bundled into hardware at no incremental price. Only the third changes the size of the market rather than its timing, and it is the one this report asks to be judged on.
Risk rating. Overall market risk is assessed as moderate: demand is structural and evidenced, but a project business with 9-to-24 month lead times converts any shock into an order-intake gap before it converts it into a revenue gap. Geopolitical exposure is assessed as high, not because the equipment is traded in unusual volumes but because tariff uncertainty demonstrably deferred US decisions in 2025 while leaving European demand intact. Substitution risk is moderate: the layers substitute for each other — cube for conveyor, AMR for fixed — faster than they substitute for the warehouse itself.
Regulatory Landscape
Chapter 5 — Regulatory landscape
A warehouse automation system is a machine before it is a business decision, and a machine has to be legal before it can run. That single sentence distinguishes this market from almost every other technology category Pheonix Research covers. In consumer imaging, as we set out in our digital camera report, no regulator sets a performance floor: conformity is paperwork about the product not hurting anyone, and prices can therefore fall 3.93 per cent in a growth year without anything breaking. In healthcare security, the obligation exists whether or not the hardware improves, and that obligation is a price floor. Warehouse automation sits with healthcare, not with cameras, and for a hard commercial reason: the system moves loads of several hundred kilograms above and beside people, so the compliance file is not a formality, it is the licence to operate.
The European regime changes on 20 January 2027, and it is the single most predictable cost event in this forecast window. The Machinery Directive 2006/42/EC gives way to the Machinery Regulation (EU) 2023/1230 on that date. The practical consequences for an integrator are three: the technical file has to be constructed against a new essential-requirements set rather than the old annex structure; the treatment of safety-related software and of digitally enabled safety functions becomes explicit rather than inferred; and the conformity assessment route for certain high-risk categories is tightened. Every system commissioned after that date has to be documented to the new regime, and the engineering hours to do it land on the integrator, not on the end user. In our fieldwork, European integrators put the conformity and risk-assessment burden at 3 to 7 per cent of project value, against 1 to 2 per cent for comparable installations in the United States — a Pheonix estimate from project interviews, not a disclosed figure, but one that is consistent across every integrator we spoke to.
Table 4 — The compliance instruments that decide whether a system may run
| Instrument | What it obliges | Who bears the cost |
|---|---|---|
| Machinery Directive 2006/42/EC, replaced by Machinery Regulation (EU) 2023/1230 from 20 January 2027 | A technical file, a documented risk assessment, a declaration of conformity and CE marking before the system may be placed on the market | The integrator, as the party placing the assembly on the market |
| EN 528 and EN 619 | Harmonised safety requirements for rail-dependent storage and retrieval equipment and for continuous handling of unit loads — guarding, access, speed, load containment | Design and commissioning engineering |
| ISO 3691-4 | Safety requirements for driverless industrial trucks and their systems: detection zones, braking performance, operating-zone definition | AMR vendor, and the integrator who commissions the fleet |
| ISO 13849-1 / IEC 62061 | Documented performance level or safety integrity level for every safety-related control function, including the software in it | Controls engineering — the largest single documentation task on a modern project |
| Radio Equipment Directive 2014/53/EU | Type approval for every wireless device on the floor, from AMR fleets to handhelds | Device vendor |
| Cyber Resilience Act (EU) 2024/2847 | Security-by-design and vulnerability handling obligations for products with digital elements, with the main obligations applying from December 2027 | Software and controls supplier, passed through the integrator |
| OSHA 29 CFR 1910.176 and 1910.178; ANSI/ITSDF B56.5 | US materials-handling and powered-truck duties, and the design standard for driverless automatic guided industrial vehicles | US operator and integrator jointly |
| NFPA 855 and UL 9540A | Fire and explosion safety for stationary energy storage, and cell-level thermal-runaway testing — now unavoidable because every automated site contains lithium | Owner, with the system designer |
Read the table as a cost curve rather than a list. Each row is a document, and each document has to be produced by an engineer who could otherwise be commissioning a system. That is why the compliance burden is a capacity constraint in a market where engineering hours are already the bottleneck, and why it lands hardest on the project integrator earning 5.96 per cent adjusted. It is also why compliance is commercially stabilising: a customer cannot skip a conformity file the way they can postpone a camera upgrade, so the obligation keeps demand attached to the supplier who already holds the documentation. The installed base is defended by paperwork as much as by switching costs.
Trade policy was the live variable in 2025, and the way it showed up was demand, not price. Kardex’s annual report for the year is unusually direct: the financial year was marked by significant uncertainty about future global trade conditions and tariffs and their consequences, and while Europe performed better than anticipated, demand in the United States lagged behind expectations and Asia was close to flat. That is the pattern to hold onto. In capital equipment with a 9-to-24 month lead time, a tariff announcement lands first in the decision to order and only later in the price of the order. A customer who is unsure what the steel and the controllers will cost in eighteen months does not renegotiate; they wait. The consequence for the forecast is that tariff volatility shows up as order-intake volatility at the integrator, one to two quarters ahead of any visible change in installed cost.
India and Southeast Asia are where the compliance gap is widest and the opportunity is most mispriced. The Indian regime — the Factories Act 1948 read with state factory rules, plus BIS standards for the equipment itself — does not impose a European-style harmonised conformity route, and enforcement varies by state and by site. In our interviews with Indian operators, the practical obligation that decided the design was not the standard but the insurer: a fire or injury claim that could be traced to an unguarded interface was the risk the board actually priced. That produces an odd result worth flagging for anyone selling into the region: the buyer pays for the safety case even when the regulator does not demand it, which means the integrator with a documented file can win on trust rather than on price.
One regulatory question is unresolved and it matters to the 2033 number. If AMR fleets are regulated as vehicles rather than as machines in more jurisdictions — a live question wherever driverless equipment shares a floor with pedestrians, and one ISO 3691-4 begins to answer technically — the certification burden per fleet rises and the product company absorbs it rather than the integrator. That is the regulatory route by which the 13.16 per cent AMR growth rate in this model could undershoot, and it is the reason the AMR layer is the one we would hedge first if compliance costs rose sharply.
What does not change with regulation is the underlying scarcity. The parent category — the industrial automation and controls layer this market sits inside — is sized in our Global Industrial Automation Market report, and the pattern there is the same one visible here: the machine gets cheaper, the control of the machine gets dearer, and the paperwork that proves the machine is safe becomes a permanent line in the supplier’s cost base. Chapter 6 puts a number on what that costs the industry in cash.