
Global Digital Camera Market Report, Size, Share and Forecast 2026–2033: The Market Grew by Getting Cheaper
The market grew by getting cheaper, and the industry has not yet adjusted to what that means. CIPA's full-year 2025 series records 9,438,876 digital camera bodies shipped for ¥880,574.519 million — up 11.2 per cent in units and 6.8 per cent in value on 2024, the second consecutive annual increase and the first back-to-back gain in nearly two decades. Those two growth rates are not the same number, and the gap is the finding: the average camera shipped worldwide fell 3.93 per cent in price, from ¥97,113 to ¥93,292.
The two live classes moved in opposite directions and the mix did the rest. Fixed-lens bodies rose 29.6 per cent in units and 48.9 per cent in value, lifting their average price 14.90 per cent to ¥62,152. Mirrorless bodies rose 12.5 per cent in units but only 3.4 per cent in value, cutting their average price 8.05 per cent to ¥110,713. An interchangeable-lens body cost 2.023 fixed-lens bodies in 2024 and 1.675 in 2025. DSLRs fell 30.7 per cent in units and 35.7 per cent in value, and now account for 3.5 per cent of the yen.
The perimeter is wider than the association's. CIPA counts its members' camera bodies. It does not count the action, 360 and pocket hardware sold by producers outside its membership, and that is where the growth sits. Adding the two disclosed non-member businesses — Insta360 at RMB 9,741.4 million of 2025 revenue, up 74.76 per cent, and GoPro at USD 545.3 million of hardware revenue, down 21.5 per cent — the pool was USD 7,787.8 million in 2025 across 14.44 million units, reaching USD 11,301.4 million by 2033 at 4.76 per cent on 18.51 million units at 3.15 per cent. Average value per unit rises from USD 539.4 to USD 610.6.
The composition is the forecast. CIPA bodies grow 1.90 per cent a year; the non-CIPA layer grows roughly six times faster. The share of the pool held outside the association's membership therefore rises from 24.62 per cent to 39.61 per cent. Body growth splits as mirrorless +1.92 per cent, fixed-lens +4.00 per cent and DSLR −25.00 per cent, which reconciles exactly to the body aggregate.
Where the money sits, one layer up. Sony held 53.6 per cent of the CMOS image sensor market by shipment value in 2025 and its Imaging & Sensing Solutions segment reported ¥1,799.0 billion of revenue — more than twice the entire global camera-body shipment value. Canon, with 2.88 million interchangeable-lens units and 41.13 per cent of that market, earns a 14.5 per cent segment operating margin inside a company where imaging is 22.7 per cent of sales. There is no scaled, independent, pure-play camera-body maker left, and the margin explains why.
The 2026 record already contradicts a demand-led recovery. CIPA's 26 February 2026 outlook has total bodies up 1.6 per cent with fixed-lens up 13.6 per cent and interchangeable-lens down 2.6 per cent. Canon reported compact sales up more than 50 per cent in a single quarter and simultaneously cut its production plan because component shortages — memory above all — will not allow it to build them. The input cost of a point-and-shoot is now set by a datacentre build-out.
Scope statement. Base year 2025, window 2026–2033, values in USD million at ¥150 to the dollar and RMB 7.10 to the dollar, constant 2025 money, no inflation or currency movement in any growth rate. Inside the perimeter: CIPA member camera bodies and disclosed non-member action, 360 and pocket hardware. Outside it: the 10.6 million interchangeable lenses shipped in 2025, and the entire second-hand market. Both are material; both are discussed where they bear on the argument; neither is in the headline figure.
The growth business is not the camera business. A supplier planning against 4.76 per cent should read S4 in Chapter 6 first: if the action and 360 layer grows at the body rate rather than at a category-creation rate, the same model produces USD 8,900.7 million in 2033 at 1.68 per cent — and that case requires nothing to go wrong. Everything else in this report explains why that is the number to hold in reserve.
The market grew by getting cheaper
CIPA's full-year 2025 series records 9,438,876 digital camera bodies shipped for ¥880,574.519 million — up 11.2 per cent in units and 6.8 per cent in value on 2024, the second consecutive annual increase and the first back-to-back gain in nearly two decades. The two growth rates do not match, and the gap is the finding: if units rise 11.2 per cent and value rises 6.8 per cent, the average camera shipped worldwide fell 3.93 per cent in price, from ¥97,113 to ¥93,292.
Every recovery narrative in this industry since 2010 has run the other way — fewer bodies, dearer bodies, flat-to-rising value. 2025 is the first year in the series that reverses the sign.
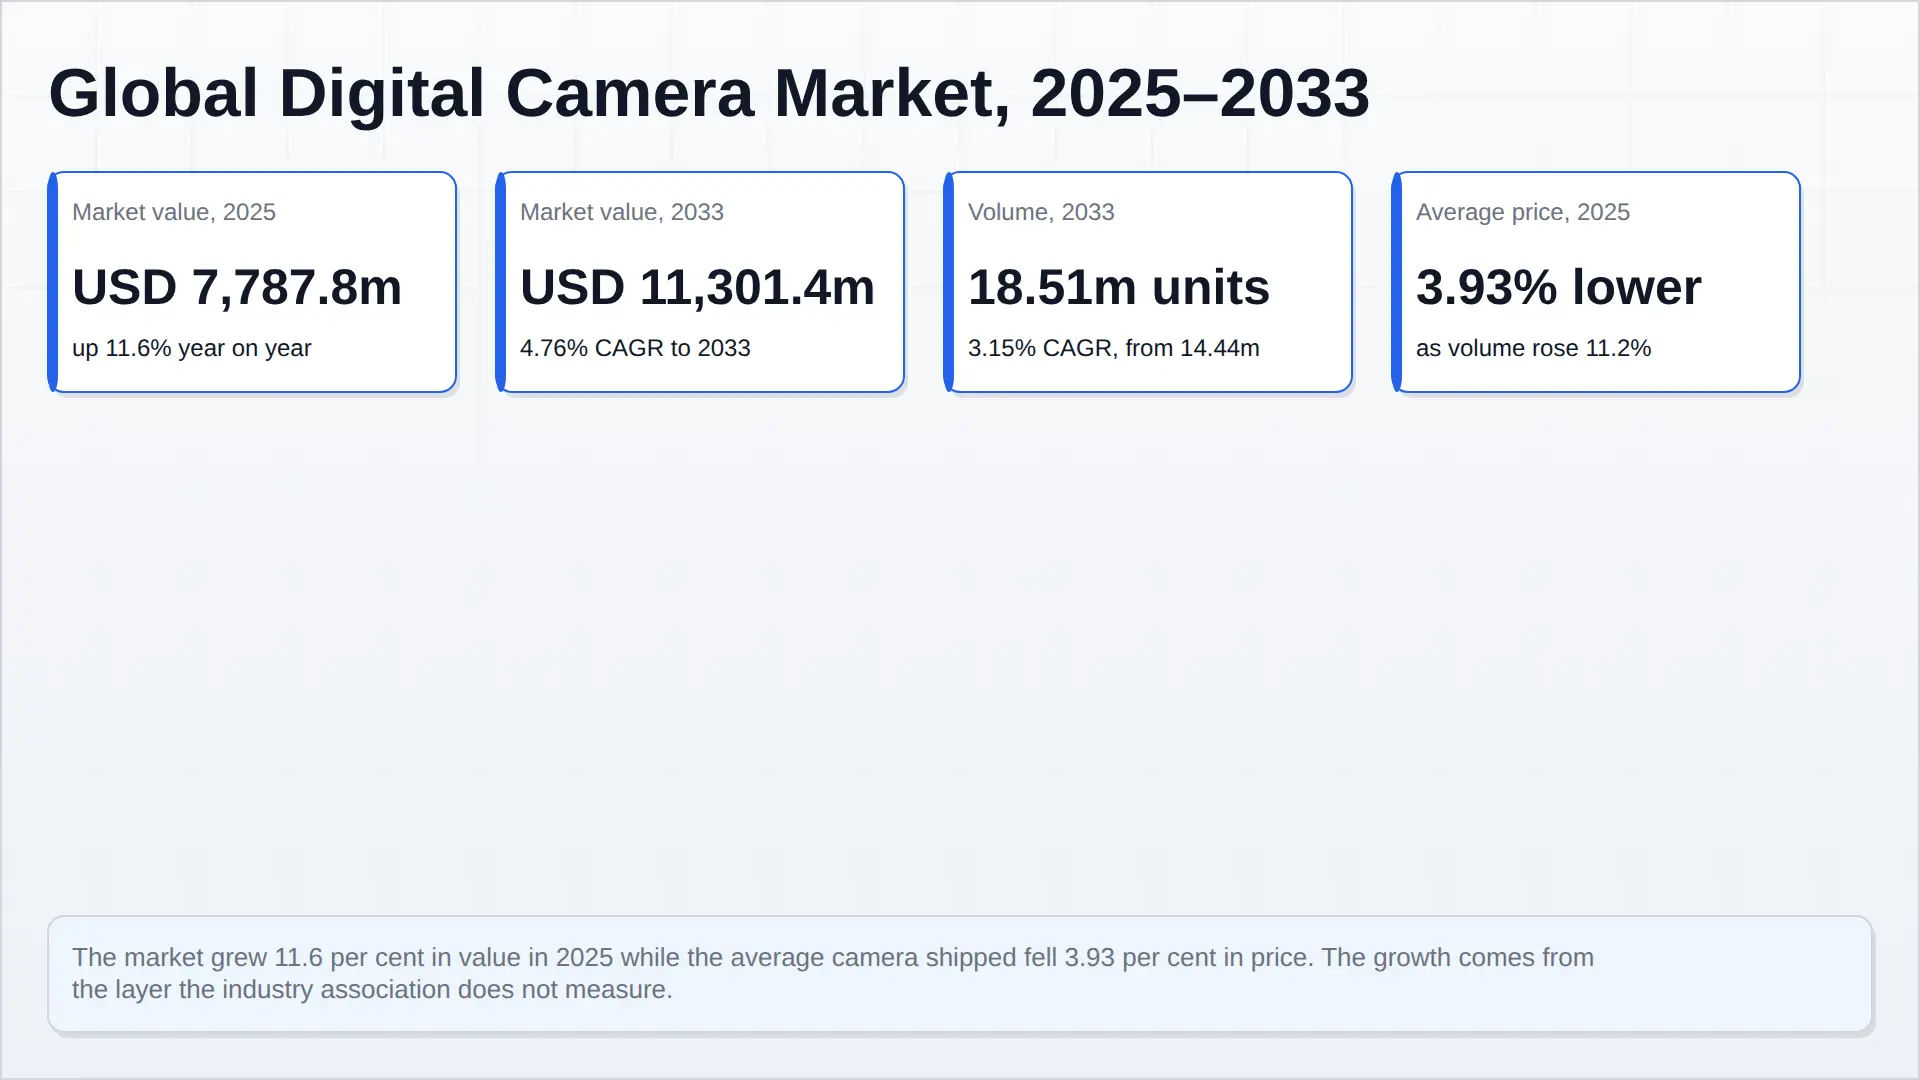
Figure 1 — Global digital camera market, 2025–2033.
This report sizes the pool more broadly than the association does. CIPA counts its members' camera bodies; it does not count the action, 360 and pocket-camera hardware sold by producers outside its membership, and that layer is where the growth has been. Adding the two disclosed non-member businesses — Insta360 at RMB 9,741.4 million of 2025 revenue and GoPro at USD 545.3 million of hardware revenue — the pool was USD 7,787.8 million in 2025 across 14.44 million units, and reaches USD 11,301.4 million by 2033 at 4.76 per cent, on 18.51 million units at 3.15 per cent.
| Segment | 2025 (USD m) | Share | 2033 (USD m) | Share | Path |
|---|---|---|---|---|---|
| Mirrorless bodies | 4,658.1 | 59.8% | 5,422.4 | 48.0% | +1.92% |
| Fixed-lens bodies | 1,009.7 | 13.0% | 1,381.8 | 12.2% | +4.00% |
| DSLR bodies | 202.6 | 2.6% | 20.3 | 0.2% | −25.00% |
| CIPA bodies, total | 5,870.5 | 75.4% | 6,824.5 | 60.4% | +1.90% |
| Insta360 | 1,372.0 | 17.6% | 4,197.0 | 37.1% | +15.00% |
| GoPro hardware | 545.3 | 7.0% | 279.9 | 2.5% | −8.00% |
| Total pool | 7,787.8 | 100% | 11,301.4 | 100% | +4.76% |
Table 2 — Market value by segment, 2025 and 2033. Body values are CIPA's yen lines converted at ¥150 to the dollar; the three class paths sum to the +1.90 per cent body aggregate exactly.
Three things follow, and the rest of this report is their consequence. The share of the pool held outside CIPA's membership rises from 24.6 per cent to 39.6 per cent — the growth in this market is largely outside the industry association that measures it. The price of a camera fell in the year the market grew, which is not what a premiumisation story looks like. And the 2026 outlook already turns against interchangeable-lens bodies — CIPA's 26 February 2026 forecast has total bodies up 1.6 per cent with fixed-lens up 13.6 per cent and interchangeable-lens down 2.6 per cent, which is a mix shift wearing a recovery's clothes.
Read Chapter 6 before using any figure here commercially. Two credible Pheonix models now exist for this market and they differ by 33 per cent in level and 3.65 points in growth, entirely because of where the perimeter is drawn. That is a scope disagreement, not a methodological one, and Chapter 6 sets both out side by side.
Sources
Primary statistical series. Every unit and value figure in this report is drawn from the Camera & Imaging Products Association's published production and shipment statistics — digital cameras, January–December 2025 and interchangeable lenses, January–December 2025 — together with the association's 2026 outlook of 26 February 2026 and its destination-region series. The three class value lines reconcile to the published ¥880,574.519 million total and the six regional lines reconcile to 9,438,876 units, so the per-unit prices in this report are measured rather than assumed.
Company disclosures. Canon's Imaging Group business briefing (18 November 2025, exchange rate ¥148.58 to the dollar) for segment sales, operating profit and interchangeable-lens units; GoPro's fourth-quarter and full-year 2025 results (5 March 2026) for revenue, sell-through, subscribers, tariff cost and gross margin; Insta360 / Arashi Vision's 2025 annual report filed on the Shanghai Stock Exchange STAR Market for revenue, net profit, research intensity and category shares. Nikon's imaging products segment and Sony's Imaging & Sensing Solutions segment are cited from their own segment disclosures.
Market share and industry reference. The CMOS image sensor shares are from the Nikkei Industry Map 2027 shipment-value table for 2025, as reported by Digital Camera Life and by PetaPixel. The Canon and Sony camera shares attributed to Nikkei come from the same map. Interchangeable-lens shipment totals and the crop/full-frame split are from PetaPixel's analysis of the 2025 CIPA lens data.
Tariffs, component supply and pricing. The IEEPA tariff timeline, the February 2026 Supreme Court ruling, the Section 122 pivot, Canon's ¥45.4 billion tariff estimate and the Leica D-Lux 8 price movement are reported by Digital Camera World. Canon's October 2026 statement on compact-camera component shortages and the memory market is from its third-quarter results as reported by Digital Camera World, with the 2027 pricing plan reported by CineD.
Pheonix prior work. This report supersedes and reconciles with Pheonix's bodies-only assessment of the same market (October 2026) and replaces the assessment previously published on this page. The difference between the three models is set out in Chapter 6.
Provenance note. Base year 2025, forecast window 2026–2033, values in USD million at ¥150 to the dollar and RMB 7.10 to the dollar, constant 2025 money, no inflation or currency movement embedded in any growth rate. Perimeter: CIPA member camera bodies plus the disclosed action and 360 hardware revenue of producers outside CIPA's membership. Interchangeable lenses sold separately (10.6 million units in 2025) and the second-hand market are outside the sized pool and are discussed where they bear on the argument. Author: Rachana Patni. Every ratio and projection in this report is computed deterministically and is reproducible from the tables.
Table of Contents
Table of contents
- Executive summary, scope and market definition — the 3.93 per cent price fall that produced the growth, the perimeter this report sizes, and the two Pheonix models it has to reconcile with.
- Value chain and margin structure — four layers, and the finding that one segment inside Sony is larger than the entire camera-body business everyone calls the market.
- Technology and innovation — why the compact revival is a design event rather than a technology event, why the sensor roadmap now serves phones first, and what shoot first, frame later did to the action category.
- Competitive landscape — four positions, a 41.1 per cent unit leader, and a market in which nobody holds a tenth of the pool.
- Regulatory landscape — no safety regulator, three real levers, and the memory shortage that is now the binding constraint on the fastest-growing category.
- Investment activity — capital buys the fab or the new category and never the camera brand, and the June 2025 listing that priced what a category-creating imaging business is worth.
- Market risk — four sensitivities, three falsifiers, and the scope warning that explains why credible published figures for this market differ by a factor of two.
Tables
- Table 1 — CIPA 2025 shipments, value and average price by camera class
- Table 2 — Market value by segment, 2025 and 2033 (USD million)
- Table 3 — Value capture and margin structure by layer
- Table 4 — Ten players across four competitive positions
- Table 5 — 2025 shipments by destination region
- Table 6 — Sensitivity and falsification tests
Figures
- Figure 1 — Market summary infographic (also the cover image, top of report)
- Figure 2 — Average shipment value per body by class, 2024 versus 2025, in Chapter 1
- Figure 3 — Market value by segment, 2025 versus 2033, in Chapter 1
- Figure 4 — One base case, four ways it breaks, in Chapter 6
All seven chapters are original Pheonix Research analysis. Unit and value statistics are CIPA’s published series, used unadjusted and reconciled internally; the perimeter additions, the forward paths and every ratio in the text are ours and are reproducible from the tables. Every company named in this report is linked in Chapter 3 and every external source appears in the Sources block.
Competitive Landscape
3. Competitive landscape
This is not one market with a leader. It is four markets that happen to share a customer. One company leads on bodies, another leads on the component inside every body, a third leads the only category that is genuinely growing, and a fourth is the incumbent of a category it invented and no longer leads. Measured against any single perimeter, one of them looks dominant; measured against the pool as this report defines it, none of them holds a share that would be called control.
The unit leader, and why its share is the hardest number in this report
Canon shipped 2.88 million interchangeable-lens bodies in calendar 2025, up 2 per cent, against CIPA’s 7.0 million interchangeable-lens total. That is 41.13 per cent of interchangeable-lens units, and it is the twenty-second consecutive year Canon has led that market. Set against the whole 14.44 million units in this report’s perimeter, Canon accounts for about a fifth.
The company also publishes ¥625.5 billion of camera net sales and a 14.5 per cent imaging segment operating margin — the best in the body business. But note what happens if you divide that ¥625.5 billion by CIPA’s ¥880,574.5 million of total body value: you get 71 per cent, which cannot be right against a 41 per cent unit share. The two figures are not the same perimeter — a company’s camera segment line includes accessories and bundled optics that the association’s body value does not — and this is exactly the trap that produces half the share claims in circulation. No share in this report is derived by dividing a company’s segment revenue by an industry shipment total.
That caution is not pedantry. The Nikkei Industry Map puts Canon at 45.7 per cent of the digital camera market and Sony at 24.6 per cent; a third published estimate circulating in 2026 puts Sony nearer 28 per cent. Three numbers for the same company in the same year, all defensible, all different, because each uses a different perimeter — all cameras or interchangeable-lens only, units or value, member companies or the whole trade. Pheonix’s bodies-only assessment of this market reaches the same conclusion from the same source data, which is the strongest argument for treating the perimeter as the finding rather than the footnote.
Four positions, and what each one is actually exposed to
Position one is the platform owners — Canon, Sony, Nikon, Fujifilm, Panasonic and OM Digital. They own mounts, lens systems and the installed base, and they compete on a specification that is now common to all of them. Their exposure is not competition from each other; it is the collapse of the price premium that used to attach to a new body. Mirrorless average price fell 8.05 per cent in 2025 in a year when every one of them launched new product.
Position two is the luxury specialists — Leica and Hasselblad, both outside CIPA’s membership and therefore outside every table in this report. Their demand is price-insensitive and their exposure is tariff policy rather than technology: a Leica compact made in China moved from USD 1,595 to USD 2,790 and back to USD 1,915 as the duty rate changed twice.
Position three is the lens specialists — Sigma and Tamron, and behind them a set of Chinese and Korean makers the association does not count at all. This is the most under-reported position in the industry and the one the 2025 data most favours: crop-sensor lenses rose 7.6 points to 54.9 per cent of lens units while full-frame fell about 2.5 points, and third-party crop glass is where that volume went.
Position four is the category creators — Insta360, DJI and, as the declining incumbent, GoPro. This is the only position growing the pool rather than redistributing it, and the only one where the competitive weapon is a reframing rather than a specification.
| Player | Position | 2025 evidence | Principal exposure |
|---|---|---|---|
| Canon | Body and mount leader | 2.88m ILC units, 41.13% of CIPA ILC; imaging ¥1,054.9bn at 14.5% | Fixed-lens component supply; US tariffs |
| Sony | Sensor leader and second body maker | 53.6% of image sensors; 24.6% of cameras by Nikkei | The smartphone sensor cycle sets its roadmap |
| Nikon | Scaled specialist | Imaging products ¥295.3bn | Almost pure interchangeable-lens exposure |
| Fujifilm | Design-led fixed-lens | Central to the retro fixed-lens franchise | Fashion-cycle risk in its best category |
| Panasonic | Niche full-frame and video | Camera line inside a appliances and energy group | Scale, and a parent with other priorities |
| OM Digital | Carved-out specialist | Independent since the imaging divestment | Compliance cost per SKU, spread over few models |
| Leica | Luxury, outside CIPA | Price-insensitive demand; China-made models exposed | Tariff policy, not technology |
| Sigma | Lens specialist | Benefits from the 54.9% crop-sensor lens shift | Access to mounts it does not own |
| Insta360 | Category creator | RMB 9,741.4m revenue, +74.76%; 66% panoramic, 57% thumb | Margin compression; DJI and GoPro response |
| GoPro | Declining incumbent | USD 651.5m revenue, −18.7%; 2.36m subscribers | Defending a category it created |
Table 4 — Ten players across four competitive positions. DJI, Tamron and Hasselblad are discussed in the text but disclose no figures that can be placed in a table of this shape.
Where the volume actually is
The regional destination data is the part of the series that most surprises people who assume this is a Japanese and European market. It is not.
| Destination region | 2025 units | Share |
|---|---|---|
| Americas | 2,346,778 | 24.86% |
| China | 2,265,515 | 24.00% |
| Europe | 2,117,229 | 22.43% |
| Asia excluding Japan and China | 1,309,651 | 13.88% |
| Japan | 996,328 | 10.56% |
| Other regions | 403,375 | 4.27% |
| World | 9,438,876 | 100% |
Table 5 — 2025 shipments by destination region, CIPA member companies.
China takes a quarter of the world’s camera bodies, and it is the one region where the highest-value lens category is contracting. That combination is the sharpest regional fact in the dataset: the largest single-country destination by value potential is also the only one buying fewer full-frame lenses. Whether that is a demand problem, a grey-market flow or a policy effect, it caps the top of the mix in the market that matters most to the premium end.
The Chinese lens makers nobody counts
CIPA’s membership does not include Viltrox, 7artisans, Laowa, Sirui or the rest of the Chinese and Korean lens trade. Neither does it include JK Imaging, which sells the Kodak-branded compact line that regularly tops marketplace sales charts. That gap is not incidental to the 2025 story — it is directionally aligned with it. The fastest-growing lens segment is crop-sensor, and the fastest-growing body segment is fixed-lens, and both are where the uncounted producers compete.
The consequence for anyone using this data commercially is that CIPA’s series is a good measure of the incumbent industry and a poor measure of the expanding one. That is why this report adds the disclosed non-member hardware to the pool and why Chapter 6 makes the perimeter its first warning rather than its last.
What competition looks like from here
Three structural judgements follow from the shares. No body maker can win on specification, because the specification is the sensor supplier’s and the supplier sells it to everyone. No sensor supplier can capture the consumer relationship, which is why Sony earns more from the component than from the camera and still cannot price the camera. And the only durable competitive advantage in the pool is a category someone else has not entered yet — which is precisely the asset Insta360 is spending 80 per cent of its net profit to acquire more of.
The same dynamic shows up in adjacent imaging markets that carry the camera into regulated settings — India’s video surveillance market, for example, where the camera is a fifth of the bill and the rest is the system around it. The pattern is identical: the hardware converges, the specification commoditises, and the margin moves to whoever owns the system the camera plugs into.
Value Chain
1. Value chain and margin structure
The camera is the least profitable thing in the photography business, and the industry reports it as though it were the whole of it. A body sold in 2025 carried four separate commercial relationships: a sensor portfolio, a body-and-mount franchise, a lens system, and a channel. Each has a different margin, a different capital intensity and a different owner — and only two of the four are camera companies.
The sensor layer is larger than the market it supplies
Sony held 53.6 per cent of the CMOS image sensor market by shipment value in 2025, up 1.2 points, according to the Nikkei Industry Map. OmniVision took 13.4 per cent and displaced Samsung, at 13.2 per cent, into third place; SmartSens rose 1.7 points to 5.6 per cent and GalaxyCore 0.6 points to 3.9, so the two Chinese suppliers now hold 9.5 per cent between them. The residual is 10.3 per cent — and Canon, which ships more cameras than any company on earth, is inside that residual.
That one fact is the architecture of the industry. Canon fabricates its own sensors and sells none of them, so it does not appear in a supplier league table at all. Everyone else buys. Sony’s Imaging & Sensing Solutions segment reported ¥1,799.0 billion of revenue in FY2025 — more than twice the ¥880,574.5 million that the entire global camera-body industry shipped for. Most of that is smartphone sensors, so the comparison is about capital intensity rather than like-for-like competition, but the asymmetry is real and it explains everything downstream: the component layer can fund a fabrication generation out of a single product cycle and the body layer cannot fund one at all.
The Chinese entry matters for a different reason. SmartSens and GalaxyCore are not competing for the flagship full-frame socket; they are supplying the fixed-lens and action categories, which is precisely where the unit growth is. The 2025 compact revival was built on sensors that cost less than the sensor in a mid-range phone.
The best margin in the body business is 14.5 per cent, and it belongs to a printing company
Canon’s imaging business posted record net sales of ¥1,054.9 billion in calendar 2025 — ¥625.5 billion from cameras and ¥429.4 billion from network cameras — at segment operating profit of ¥153.1 billion, a 14.5 per cent margin. That is the best disclosed margin in the body business, and it is earned inside a ¥4.62 trillion company where imaging is 22.7 per cent of sales. Canon’s twenty-two consecutive years of interchangeable-lens leadership are funded by a printing and office-equipment business.
The pattern repeats. Sony’s camera line sits in a segment that also sells televisions and audio. Fujifilm’s imaging sits beside healthcare and materials. Panasonic’s camera business is a rounding error inside an appliances and energy conglomerate. Nikon is the closest thing to a pure play and its imaging products segment reported ¥295.3 billion. There is no independent, scaled, pure-play camera-body maker left in this market, and the margin explains why: 14.5 per cent at the best operator does not pay for a sensor roadmap, and the sensor roadmap is where the specification comes from.
The lens layer is where the renewal lives
CIPA members shipped 10.6 million interchangeable lenses in 2025, up 2.8 per cent, and produced 9.99 million — against 7.0 million interchangeable-lens bodies. That is 1.514 lenses per body shipped, and the ratio understates the installed base, because a lens outlives two or three bodies.
The mix then moved in a direction almost nobody forecast: full-frame lens shipments fell about 2.5 points while crop-sensor lenses rose 7.6 points to 54.9 per cent of units. CIPA attributes the full-frame decline to China, where shipments fell while rising in every other region. That is the most interesting line in the lens data, and Chapter 3 returns to it.
The mount, not the sensor, is the switching cost here. A photographer holding six lenses does not change brand over a specification sheet, and the body maker that owns the mount owns the next decade of that customer’s spending. It is also the only reason the camera business behaves unlike the rest of consumer electronics: a fourteen-year-old lens still fits this year’s body, and no phone can make that claim.
Two gross margins, two entirely different businesses
GoPro earned a 33.6 per cent GAAP gross margin in 2025 and still lost USD 93 million at the net line, with adjusted EBITDA of negative USD 29 million. It absorbed USD 20 million of tariff expense and cut operating expenses by USD 93 million, or 26 per cent year on year. Insta360 earned a 9.5 per cent net margin on revenue up 74.76 per cent while spending 15.70 per cent of revenue on research and development.
Read together, those two disclosures say what no aggregate market number can. Gross margin in this industry is a statement about hardware cost; net margin is a statement about whether anyone wants the product. GoPro’s 33.6 per cent gross margin is more than twice Canon’s 14.5 per cent operating margin, and GoPro is the one losing money. Canon sells into demand that exists. GoPro is defending a category it invented and then lost to a competitor that reframed the problem.
Where the money per unit went
The value-chain story is visible in a single derived series. Average shipment value per body fell 3.93 per cent across the market, but the two live classes moved in opposite directions: mirrorless fell 8.05 per cent, from ¥120,406 to ¥110,713, while fixed-lens rose 14.90 per cent, from ¥54,094 to ¥62,152. An interchangeable-lens body cost 2.023 fixed-lens bodies in 2024 and 1.675 in 2025. The premium came out of the top and went into the bottom.
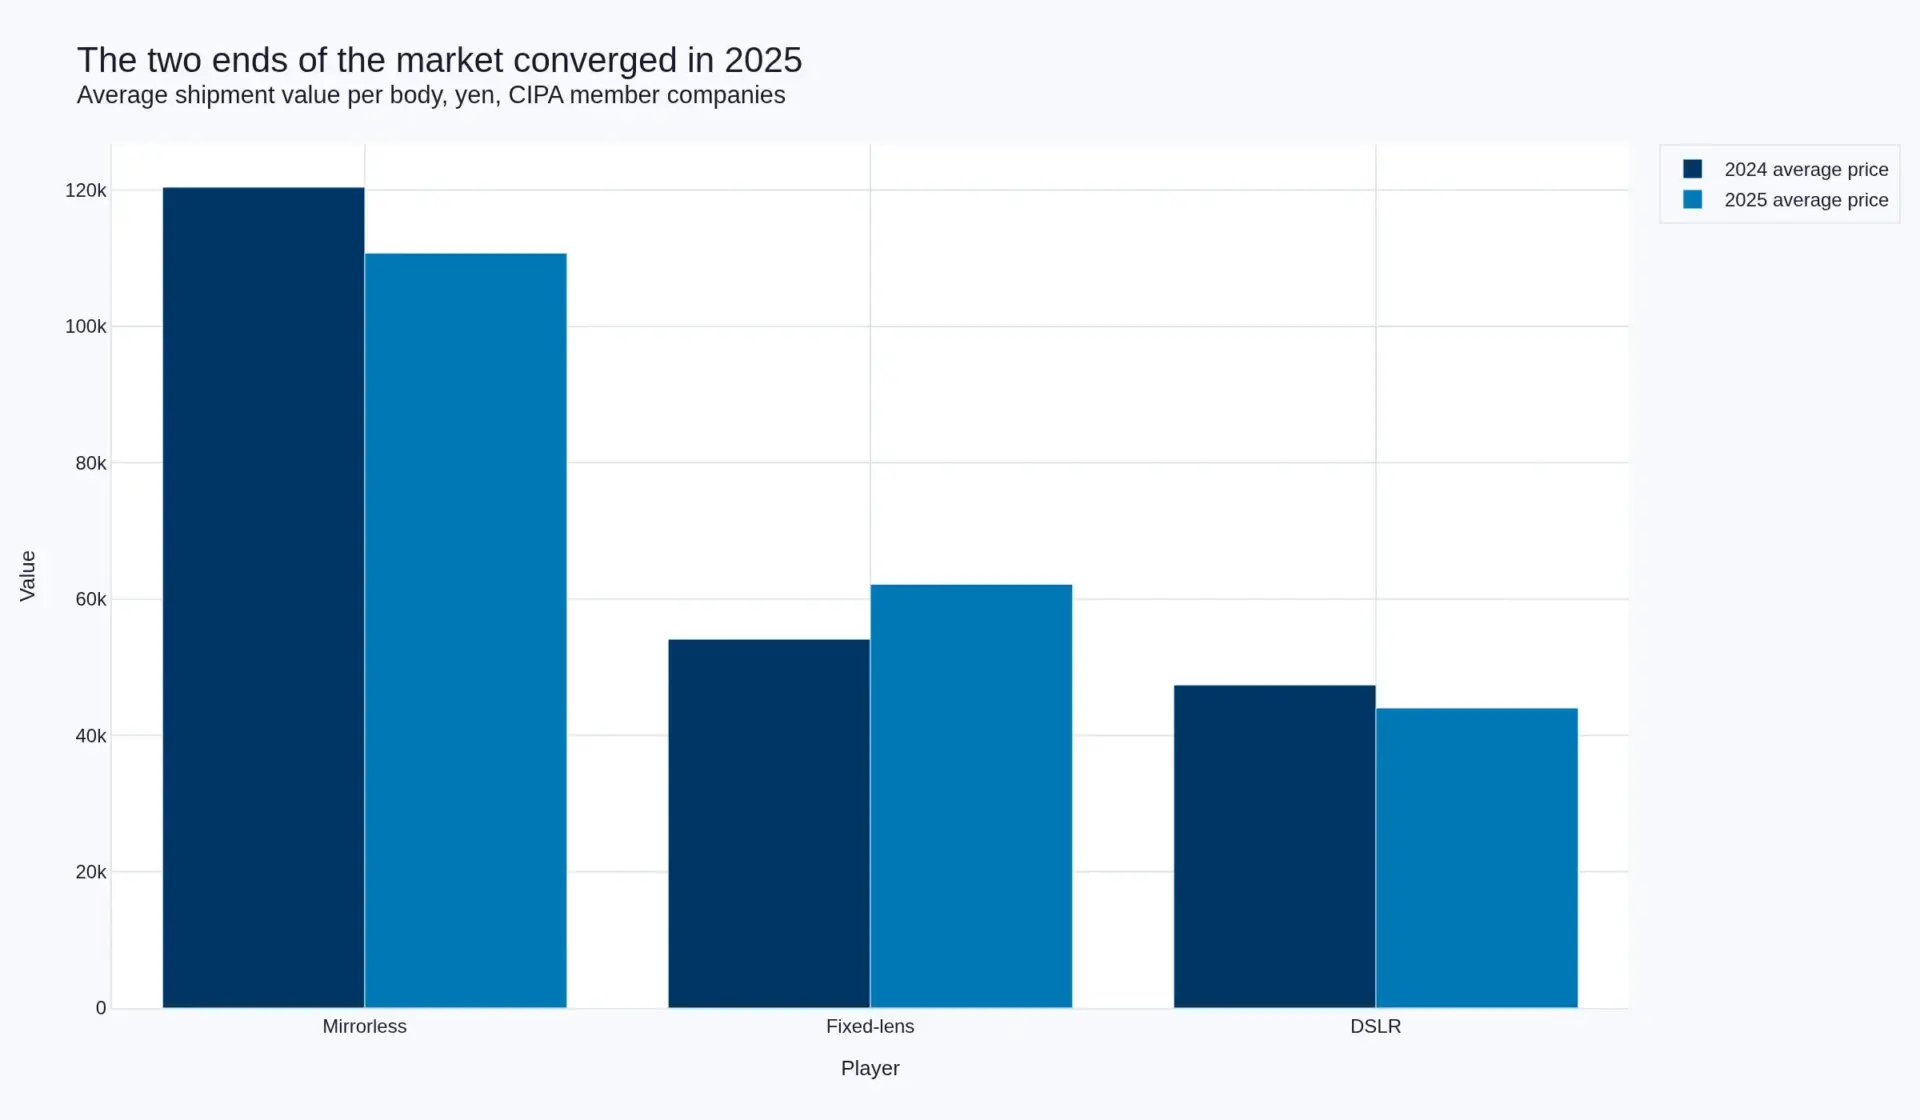
Figure 2 — The two ends of the market converged in 2025. Average shipment value per body, yen.
This is not a mix artefact of one quarter. It is what happens when a mature replacement market keeps its specification and loses its scarcity at the top, while a fashion-driven category at the bottom finds a buyer with no price anchor.
The channel layer, which sets the price nobody models
GoPro took 76 per cent of 2025 revenue through retail and 24 per cent direct, and only the direct line carries the USD 106.3 million of subscription and service revenue that is the company’s one stable asset. The retailer sets the street price; the manufacturer sets a list price that the tariff cycle has already made provisional; and outside both sits the trade-in and used market — MPB, KEH and the dealer programmes that feed them — which removes volume from the new market without appearing in any CIPA table.
| Layer | Who occupies it | What the evidence shows |
|---|---|---|
| Sensor fabrication | Sony, OmniVision, Samsung, SmartSens, GalaxyCore; Canon captive | 53.6% of shipment value to one supplier; the layer is larger than the market it supplies |
| Body and mount | Canon, Sony, Nikon, Fujifilm, Panasonic, OM Digital, Leica, Hasselblad | 14.5% segment operating margin at the best operator; no scaled pure play survives |
| Lenses | The same brands plus Sigma and Tamron | 10.6m units, 1.514 per body, and the switch a photographer does not make |
| Action, 360, pocket | Insta360, GoPro, DJI | 9.5% net margin on +74.76% revenue against −USD 29m adjusted EBITDA |
| Channel and resale | Retail, direct, and the used trade | 76% of one disclosed maker’s revenue is retail; the used market is outside every series |
Table 3 — Value capture and margin structure by layer.
What the layer structure predicts
Three predictions follow, and this report tests each of them later. First, the body layer will keep ceding price at the top, because it has no way to withhold specification that its own sensor supplier sells to everyone else. Second, the money that stays will be in systems rather than bodies — mounts, lenses and the software that decides where the frame is. Third, the fastest-growing hardware in the industry will keep coming from companies that do not make sensors, because the bottleneck in a mature category is not the component but the reason to buy.
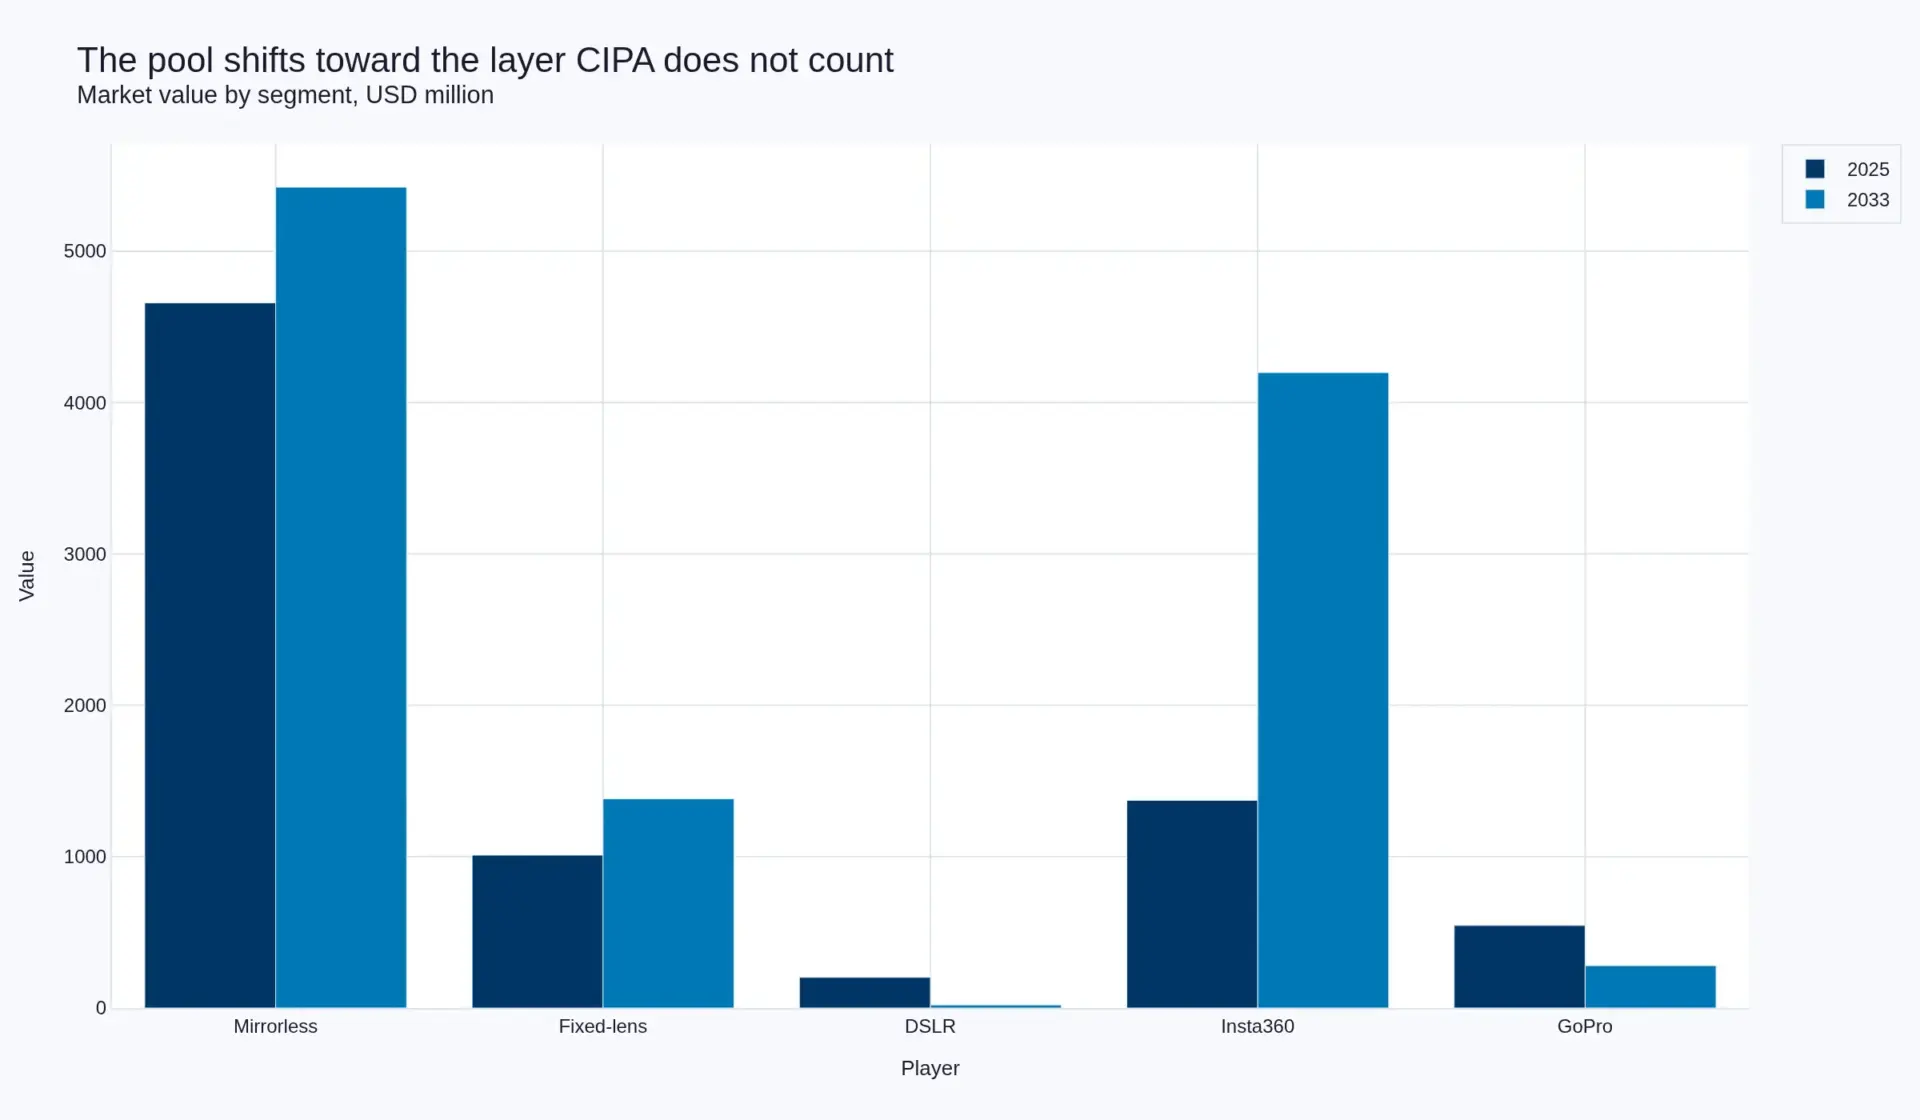
Figure 3 — The pool shifts toward the layer CIPA does not count. Market value by segment, USD million.
None of that is visible in the headline market value. It is visible in the margin, and the margin sits one layer up.
Investment Activity
5. Investment activity
Capital in this market goes to the two ends and skips the middle. It funds fabrication capacity, and it funds category creation. It does not fund camera brands, and the 2025–26 record makes the reason plain: the end that owns a fab earns a return on capital, the end that owns a category earns a growth multiple, and the middle owns a brand, a mount and a replacement cycle.
The listing that priced category creation
Insta360 — Arashi Vision Inc., code 688775 — listed on the Shanghai Stock Exchange’s STAR Market in June 2025 and then published the kind of annual report an analyst can actually use. Revenue for 2025 was RMB 9,741.4 million, up 74.76 per cent; net profit attributable to shareholders was RMB 928.9 million, down 6.62 per cent; net assets rose 82.38 per cent; research and development reached 15.70 per cent of revenue, up from 13.93 per cent.
The gap between those first two numbers is the strategy, and the company says so directly. It put RMB 762 million — roughly 80 per cent of its net profit — into strategic development in 2025, across two drones, a gimbal camera, a wireless lavalier microphone, three further new categories and three custom chips. The first quarter of 2026 continued the pattern at greater intensity: revenue RMB 2,481 million, up 83.11 per cent, on net profit of RMB 84.62 million.
So a company that created the panoramic and thumb-camera categories is spending its entire profit, and more, to buy the next ones. That is the same behaviour as a fab operator writing a capacity cheque — it is an investment in being present in a category before the category is priced. And it closed a two-year litigation with GoPro in early 2026, which removed the one legal overhang on the growth story.
The fab, which is where the capability comes from
Sony’s Imaging & Sensing Solutions segment reported ¥1,799.0 billion of revenue in FY2025, more than twice the entire global camera-body shipment value. Most of it is smartphone sensors. In 2026 Sony and TSMC formed a strategic partnership to manufacture Sony’s next-generation image sensors.
Read that as an investment statement rather than a technology one. The rate at which camera capability improves is now set by fabrication capex decided at a scale no camera company can reach, which is why a body maker’s only two options are to buy the roadmap or to fund one — and Canon is the only company still choosing the second.
The cross-subsidy that finances the camera business
Canon’s imaging segment earned ¥153.1 billion of operating profit on ¥1,054.9 billion of net sales in calendar 2025, a 14.5 per cent margin, inside a company with ¥4.62 trillion of net sales where imaging is 22.7 per cent. Sony’s camera line sits in a segment that also sells televisions and audio. Fujifilm’s sits beside healthcare and materials. Nikon reported ¥295.3 billion in imaging products.
This is the least discussed and most important financing fact in the industry: the camera business is not funded by the camera business. It is funded by printing, by medical imaging, by materials and by entertainment, and it is tolerated because it carries brand and optical capability that the parent cannot buy elsewhere. A forecast that assumes rational investment behaviour by a standalone camera company is modelling a company that does not exist.
The counter-example, managed for cash
GoPro’s 2025 results describe the other end of the range. Revenue of USD 651.5 million, down 18.7 per cent; hardware revenue USD 545.3 million, down 21.5 per cent; subscription and service revenue USD 106.3 million, down 0.6 per cent; a net loss of USD 93 million against USD 432 million the year before, a year distorted by a USD 295 million valuation allowance booked against US deferred tax assets in the first quarter of 2024; adjusted EBITDA of negative USD 29 million; operating expenses cut USD 93 million, or 26 per cent; subscribers at 2.36 million, down 7 per cent.
That is a company being run for cash flow rather than for share, and the one line that held was the subscription. It is also the clearest evidence that the growth in this pool is not a tide: two companies selling small cameras into the same creator market moved in opposite directions by roughly 95 percentage points of revenue growth in the same year.
The restructuring template nobody wants to use
The camera industry’s answer to a brand that can no longer carry its cost base has been divestment rather than closure. OM Digital Solutions took the Olympus imaging business and has operated it as an independent since. It is a rational structure — the brand, the mount and the customer list have value; the manufacturing and the R&D commitment do not — and it is the template that any further consolidation in the body layer will follow.
What the market’s own valuations say
Put Insta360 and GoPro side by side and you have the market’s own answer to the question this chapter is asking. One listed in June 2025 on a growth basis, having created two categories and reported 74.76 per cent revenue growth. The other trades on the strength of a subscription base while its hardware revenue falls a fifth a year. The spread between them is not a valuation anomaly. It is the market pricing the difference between owning a category and owning a brand.
Which is why there is no queue of buyers for a camera business, no consolidation of the DSLR franchises that are being retired by attrition, and no exit for the lens specialists who do the industry’s most technically demanding work at the thinnest margins. The capital in this market has already decided where the returns are, and it is not in the middle.
Technology & Innovation
2. Technology and innovation
The fastest-growing class of camera in 2025 was the one with the oldest technology in it. Fixed-lens bodies rose 29.6 per cent in units and 48.9 per cent in value, and their average price rose 14.90 per cent — in the same twelve months that mirrorless average price fell 8.05 per cent. Whatever drove the bottom of this market, it was not a sensor generation.
The compact revival is a design event, not a technology event
The internals of the models that sold are unremarkable: a one-inch stacked sensor, a previous-generation processor, a fixed lens. Nothing in the 2025 fixed-lens line-up out-resolves a 2023 model. What changed was the object. Canon’s own account, given with its third-quarter 2026 results, is that compact sales rose more than 50 per cent in that quarter on a continued point-and-shoot trend it describes as particularly strong among younger generations, with the PowerShot G7 X Mark III backordered at many retailers — and that component shortages will now prevent the planned production increase from being met.
That is a fashion cycle with a supply constraint on it, not a technology cycle. The proof is in the price: the class with the least new capability raised its average price 14.90 per cent, while the class where every specification improved cut its average price 8.05 per cent. Buyers were paying for an object that produces a particular look, fits in a pocket and is not a phone. That is a real demand, and it is a demand with a different clock from the one the rest of this market runs on.
What mirrorless bought with its technology, and what it paid
Mirrorless units rose 12.5 per cent to 6,311,054 while value rose 3.4 per cent, and the arithmetic on those two numbers is the end of the premiumisation story. The technology wave that carried this category from 2018 to 2023 was real and specific: stacked backside-illuminated sensors, on-chip phase detection, subject-recognition autofocus, blackout-free burst shooting, in-body stabilisation. Every one of those is now table stakes at every price point, and the entry APS-C bodies are carrying the volume.
The DSLR line tells you what happens when the technology argument is lost outright. 690,911 units, down 30.7 per cent; ¥30,397 million of value, down 35.7 per cent; average price down 7.16 per cent to ¥43,995. DSLRs now account for 3.5 per cent of the yen in a market they led fifteen years ago. Canon and Nikon have redirected engineering almost entirely to their mirrorless mounts, which means the format is being retired by attrition rather than by announcement — and the lenses are not, which is why the mount matters more than the body.
| Class | 2025 units | 2024 units | Unit change | 2025 value (¥m) | Value change | 2025 average price (¥) | 2024 average price (¥) | Price change |
|---|---|---|---|---|---|---|---|---|
| Mirrorless | 6,311,054 | 5,612,205 | +12.5% | 698,718 | +3.4% | 110,713 | 120,406 | −8.05% |
| Fixed-lens | 2,436,911 | 1,880,414 | +29.6% | 151,460 | +48.9% | 62,152 | 54,094 | +14.90% |
| DSLR | 690,911 | 997,608 | −30.7% | 30,397 | −35.7% | 43,995 | 47,387 | −7.16% |
| Total | 9,438,876 | 8,490,227 | +11.2% | 880,575 | +6.8% | 93,292 | 97,113 | −3.93% |
Table 1 — CIPA 2025 shipments, value and average price by camera class. Average prices are derived by dividing each class’s published value line by its published unit line, which is why every figure here is measured rather than assumed.
The specification that now matters is a video specification
Ask what a buyer in this market actually compares and the answer stopped being megapixels some years ago. It is frame rate at full readout, bit depth, the log curve, whether the sensor reads out open-gate, how long it records before it thermal-throttles, whether it takes a full-size HDMI and a headphone jack. A camera that overheats after twenty minutes fails a wedding, and the market now says so.
That is why bodies grew while sensors did not. The engineering has moved from the photosite to the enclosure — heat spreading, power delivery, card throughput, audio, connectivity. The consequence for the value chain is direct: thermal and interface design are things any competent contract manufacturer can execute, so they differentiate for about one product cycle and then they do not differentiate at all. The specification that stays proprietary is the mount and the autofocus logic behind it.
Shoot first, frame later — how the category boundary actually moved
Insta360’s own annual report gives an unusually clear account of how a camera category is created, and it is worth reading as a technology argument rather than a marketing one. The company’s chairman describes the sequence: by 2017 GoPro’s unit sales had begun to fall; the company solved the framing problem in skiing and diving by capturing a sphere and deciding the frame afterwards; in 2019 it moved to a thumb-sized body to solve the weight and mounting problem in cycling and running; in late 2023 it added a flip screen to move the action camera into vlogging and street shooting.
Each of those is a reframing, not a sensor. Panoramic capture converts a hardware problem — where do I point it — into a post-production problem. A thumb camera converts a mounting problem into a wearing problem. Those reframings are why a 360 camera can be sold to someone who would never call themselves a photographer, and why the category grew while the action-camera incumbent shrank: Insta360 reports 66 per cent of the global panoramic camera market and 57 per cent of the thumb camera market, on more than three million units a year, while GoPro’s 2025 sell-through was approximately 2.0 million camera units, down 20 per cent.
The sensor roadmap now serves phones first
The image sensor market is ordered by smartphone volume, not by cameras. Sony’s 53.6 per cent share is built on supplying phone makers; OmniVision’s second place rests on sensors such as the LOFIC unit in Xiaomi’s flagship; Samsung’s 13.2 per cent is a phone business. The camera gets the derivative — which is why the interesting differentiator at the top of the camera market has moved from the photosite to the readout and processing chain.
Canon’s choice to keep fabricating its own sensors now reads as a decision to pay for independence rather than a decision to buy advantage. And the capacity question is being answered at a scale no camera company can reach: Sony and TSMC formed a strategic partnership in 2026 to manufacture Sony’s next-generation image sensors. That is capital for capacity, not for capability, and it widens the gap between the two layers of this industry rather than narrowing it.
The constraint is not innovation. It is memory.
The strangest fact in this market is that the input cost of a point-and-shoot camera is now set by a datacentre build-out. Canon said in October 2026 that component shortages will limit how many compact cameras it can make, that it has secured the memory it needs at prices in line with its expectations amid what it calls the AI-driven memory shortage, and that it will offset higher component costs with price increases from 2027.
Read that against the fixed-lens path in this report. The 4.00 per cent value growth assigned to that class is as much a price assumption as a volume assumption, and it is the part of the forecast most exposed to a cycle that has nothing to do with photography. If memory inflation persists, fixed-lens value grows faster than modelled and units grow slower; the two effects do not cancel, because a camera priced out of its buyer’s reach does not come back when memory normalises.
What innovation actually decides here
Three things decide commercial outcomes in this market, and none of them is a sensor. The software that decides where the frame is. The thermal and interface design that makes a hybrid video body usable for an hour. And the mount, which is the only part of the system a customer cannot replace without replacing everything else.
That is also why the growth in the pool sits where it does. The layer that does not own a fab and does not own a mount is the layer that has to earn its growth by reframing what the product is for — and in 2025 that layer grew while the layer with all the patents grew at 1.9 per cent.
Market Risk
6. Market risk
The base case is USD 7,787.8 million in 2025 rising to USD 11,301.4 million in 2033 at 4.76 per cent, on volume up from 14.44 million to 18.51 million units at 3.15 per cent and average value per unit from USD 539.4 to USD 610.6. That last figure is the one to hold on to. The forecast does not assume the price of a camera rises much. It assumes the mix shifts toward a layer whose unit prices are higher, and that the body business stops falling in average price after the 2025 correction.
Four tests break that down. Each is a single assumption changed in isolation, holding everything else constant.
| Test | 2033 (USD m) | CAGR | What it changes |
|---|---|---|---|
| Base case | 11,301.4 | 4.76% | Bodies +1.90%, Insta360 +15.00%, GoPro −8.00% |
| S1 — CIPA’s own volume tail | 10,884.3 | 4.27% | Bodies grow 1.10% rather than 1.90%, following the association’s own long-run volume outlook |
| S2 — Insta360 at 8.00% | 9,643.9 | 2.71% | The category creator decelerates to a normal hardware growth rate |
| S3 — GoPro flat | 11,566.8 | 5.07% | The declining incumbent stops declining and holds USD 545.3 million |
| S4 — non-CIPA layer at the body rate | 8,900.7 | 1.68% | The action and 360 layer behaves like a camera business, growing 1.00% |
Table 6 — Sensitivity and falsification tests. Every figure is computed from the same model with one input changed; nothing else is held constant by assertion.
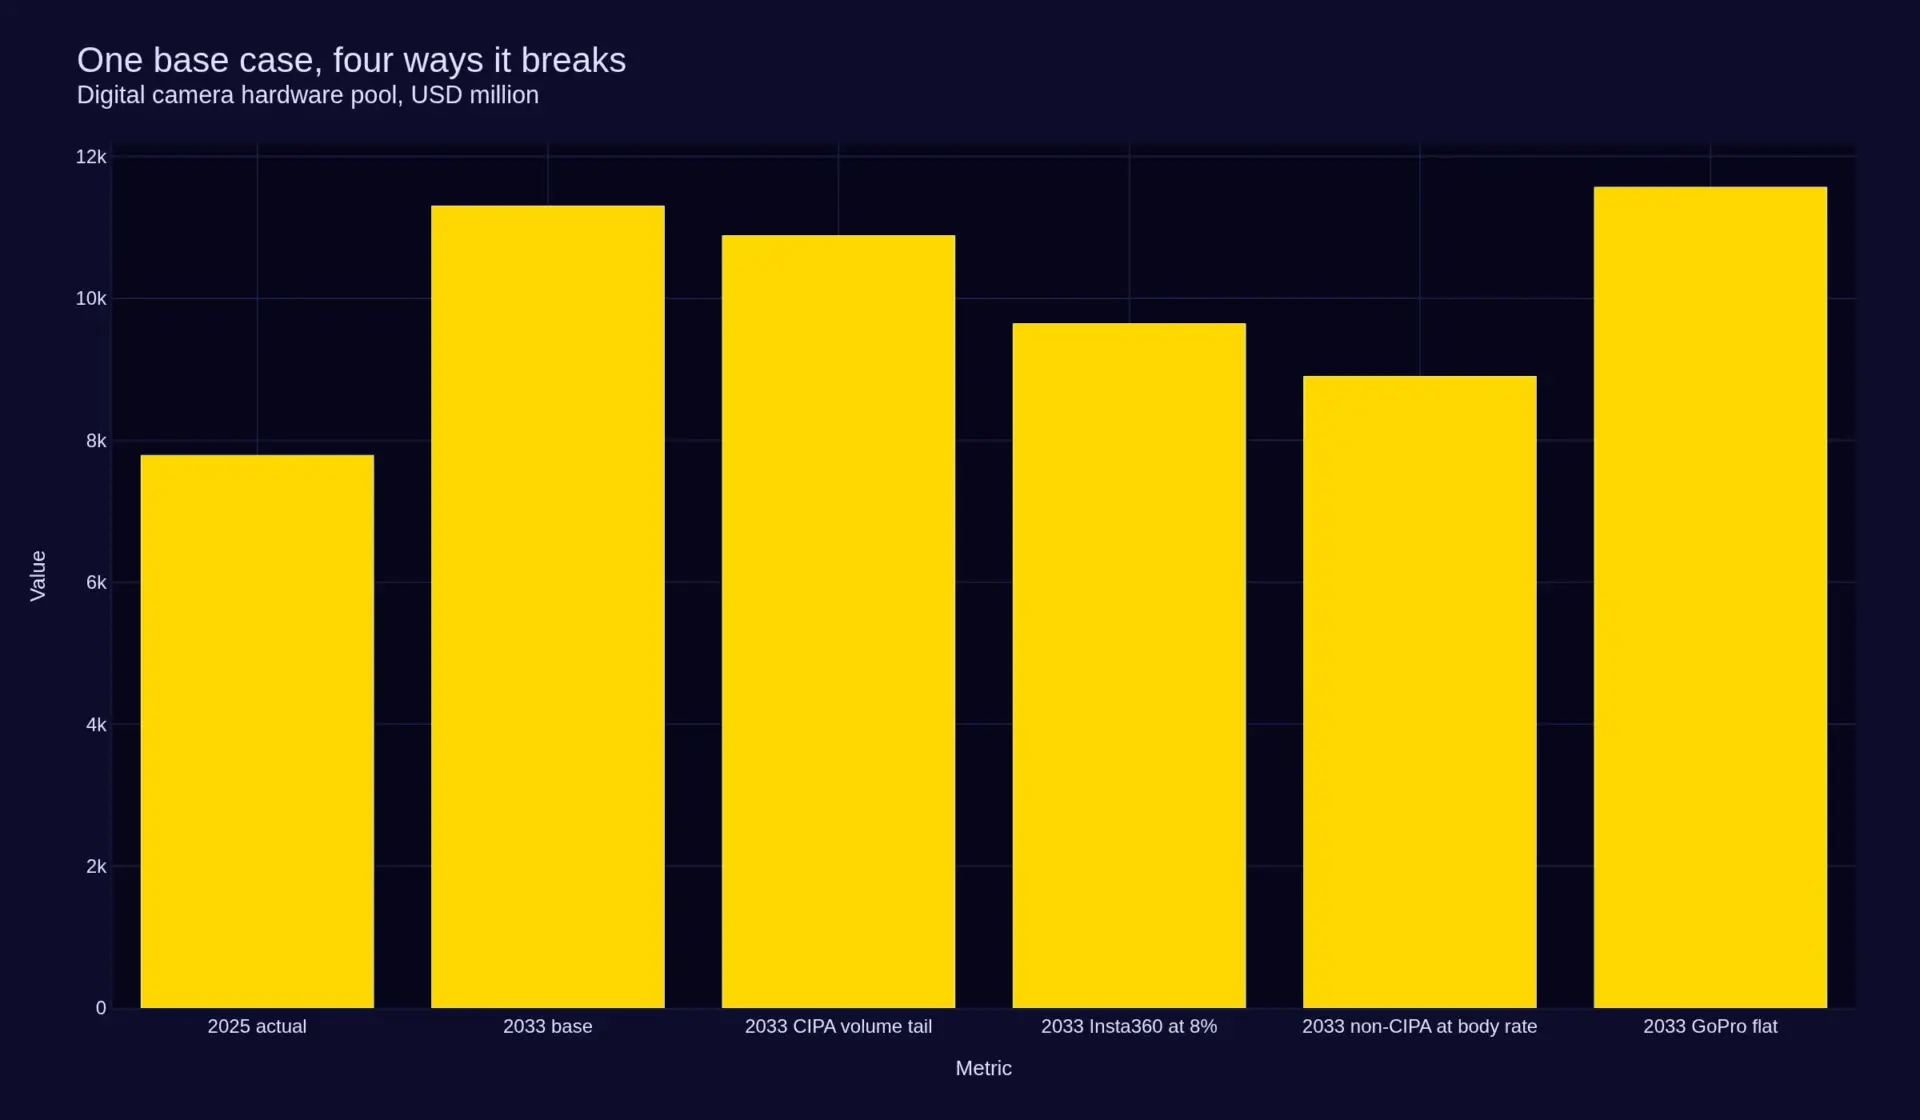
Figure 4 — One base case, four ways it breaks. Market value, USD million.
Read S4 before you read the headline
The sensitivity that matters commercially is not the one that moves the number most in percentage terms. It is S4 at 1.68 per cent, because S4 assumes nothing goes wrong. It does not require a regulator to reverse anything, a tariff to return, a technology to fail or a fashion to turn. It requires only that the action and 360 layer grow at the same rate as the body layer — that the category creators stop creating categories and become camera companies.
That is the most likely bad outcome in this market, and it is the one a supplier should plan against. The 4.76 per cent headline is a statement about the value of category creation. A company building a five-year plan on it is assuming that a business which grew 74.76 per cent in 2025 keeps finding new frames to sell.
Three falsifiers, stated as falsifiers
One: the compact revival is a fashion cycle and reverts. Fixed-lens bodies shipped 2,436,911 units in 2025 against 1,880,414 in 2024, at an average price up 14.90 per cent, with the best-selling models backordered through 2026. If that demand is aesthetic rather than functional, it fades the way every retro revival has, and the class returns toward its 2024 volume. The test is observable rather than theoretical: watch backorder lists normalise and watch resale premiums on the popular models collapse. If both happen in the same two quarters, the 4.00 per cent fixed-lens path is too high and the 2025 mix correction reverses.
Two: the category creators are taking share, not making a market. GoPro’s sell-through fell 20 per cent to roughly 2.0 million units in the same year Insta360 grew revenue 74.76 per cent and shipped more than three million units across its lines. If the growth is transfer rather than creation, it is bounded by the incumbent’s revenue — a pool of roughly half a billion dollars being redistributed, not a new market opening. The falsifier is clean: if GoPro stops declining while Insta360 keeps growing, the market is being created; if Insta360’s growth stalls as GoPro’s base is exhausted, it was transfer.
Three: the 2025 value growth was partly a tax and a shortage. Tariffs raised US list prices by roughly 10 per cent across the majors and Canon alone put its tariff cost at ¥45.4 billion in the second half. Memory allocation limited how many fixed-lens bodies could be built, which raises price and lowers volume. Both effects inflate value per unit without any change in what a customer wants. If they unwind — the Section 122 authority lapses and memory normalises — the value line flattens while units recover, and 2025’s 11.6 per cent growth reads as a price event rather than a demand event.
The scope warning, which is the real reason published figures differ
Three credible numbers exist for this market and they differ by more than a factor of two. That is not a disagreement about method. It is three different perimeters.
| Perimeter | 2025 (USD m) | 2033 (USD m) | CAGR |
|---|---|---|---|
| This report — CIPA bodies plus disclosed non-member action and 360 hardware | 7,787.8 | 11,301.4 | 4.76% |
| Pheonix’s CIPA-bodies-only assessment, October 2026 | 5,870.5 | 6,441.6 | 1.11% |
| The assessment this report replaces, 2025 | 9,800.0 | 15,600.0 | 5.90% |
Take them in order. The bodies-only assessment is not wrong — it is the same CIPA series, reconciled to the yen on three independent checks, with measured rather than assumed prices. It is simply narrower: this report adds USD 1,917.3 million of disclosed non-member revenue, which is 33 per cent more pool at the base year and lifts growth by 3.65 points because the added layer grows faster.
The number this report replaced could not be reproduced. It carried no volume line, no segment split and no stated perimeter, and a 5.9 per cent value CAGR is not reachable from a body pool whose unit growth the association itself puts near 1 per cent — not without assuming the price of a camera rises faster than it did in the best year the industry has had in a decade. It was a price assumption presented as a demand forecast.
The practical rule: when you see a digital camera market size, ask which perimeter it is. Bodies only, or bodies plus action and 360? Factory value or retail value? Are the 10.6 million interchangeable lenses inside the number or outside it? In this report they are outside, and that alone understates the pool by roughly half again. The spread across published figures is category boundary, not arithmetic.
What would make this report wrong
Three things, and none of them is a forecast error. If fixed-lens demand proves functional rather than aesthetic, the class does not revert and the base case is too low. If the 360 and pocket category keeps creating new buyers rather than redistributing existing ones, Insta360’s 15.00 per cent path is too conservative and S2 is the wrong tail. And if the body business finds a specification it can withhold again — a sensor generation it does not sell to rivals, or a mount no third party can license — then the 1.92 per cent mirrorless path is far too low and the 2025 price fall reverses.
None of those can be checked from a shipment table. All three are checkable from product launches, licensing announcements and resale prices, which is where the next revision of this report should look first.
Regulatory Landscape
4. Regulatory landscape
Nothing in this market is compulsory. That is the single most important regulatory fact about it, and it distinguishes the camera business from almost every other market Pheonix covers. In healthcare, a regulator specifies the document a hospital must produce and the document becomes the demand floor. In road safety and enforcement, a statutory instrument creates the purchase. Here there is no safety regulator, no mandatory documentation, no accreditation cycle and no procurement rule that binds a consumer. A camera is bought because someone wants one, and that is why its average price could fall 3.93 per cent in a year when the market grew 11.6 per cent.
What remains is four levers, and not one of them is about photography.
The tariff lever, which now has a legislative cliff in it
The United States raised import duties through 2025 under the International Emergency Economic Powers Act, with a 10 per cent baseline and higher reciprocal rates on some origins — Japan, where Canon, Nikon, Sony and Fujifilm are based, carried 15 per cent. Every major manufacturer raised US list prices. Many increases sat around 10 per cent; some were far larger on the models people actually wanted. Leica’s D-Lux 8, a compact made in China, moved from USD 1,595 to USD 2,790 and then back to USD 1,915 when the reciprocal rate on Chinese imports came down.
The cost was not marginal. Canon estimated that tariffs cost it ¥45.4 billion — roughly USD 294 million — in the second half of 2025 alone. GoPro absorbed USD 20 million across the full year and still held GAAP gross margin flat, which it did by cutting operating expenses 26 per cent.
Then in February 2026 the US Supreme Court struck down the IEEPA tariffs, and the picture became less certain rather than more. Yale research cited at the time put the effective US tariff rate at 9.1 per cent without the IEEPA duties, against 16.9 per cent with them. The administration immediately indicated a global 10 per cent tariff under Section 122 of the Trade Act of 1974, which requires Congressional approval to last longer than 150 days. That is the shape of the risk: not a direction, but a statutory expiry date sitting inside the forecast window.
For this report’s model the consequence is specific. Values are in constant 2025 money at a constant exchange rate, so a tariff is a price-level event rather than a growth-rate event — it moved value up and units down in 2025, and if the Section 122 authority lapses in 2027 the movement partly reverses. A forecast that treated 2025’s dollar value as a clean demand signal would be reading a tax as a preference.
The memory lever, which is not regulation but behaves like it
The binding constraint on the fastest-growing category is component allocation, and it is being set by artificial intelligence. Canon said in October 2026 that component shortages will limit how many compact cameras it can build, having already raised production repeatedly to chase demand for models such as the PowerShot G7 X Mark III; it also said it had secured the memory it needs at prices in line with expectations amid what it described as the AI-driven memory shortage, and that it will offset higher component costs with price increases from 2027.
This is the most consequential sentence in the 2026 record, and it has nothing to do with cameras. The input cost of a point-and-shoot is now determined by a datacentre build-out. Allocation, not preference, decides how many fixed-lens bodies reach the market in 2027 and 2028, which is why Chapter 2 treats the 4.00 per cent fixed-lens value path as a price assumption as much as a volume assumption.
The compliance lever: forty SKUs, forty jurisdictions
Product compliance in this industry is not a demand driver and it is not trivial. A body sold across the major markets carries the EU common-charger requirement, battery and waste-electronic rules, ecodesign and repair obligations that are tightening, radio type approval for Wi-Fi, Bluetooth and GNSS in each jurisdiction separately, and packaging rules that differ by member state. None of it improves a photograph. All of it is a fixed cost per SKU.
That structure advantages the scaled players and disadvantages the specialists. A company shipping ten models into forty markets amortises the compliance file over 400 product-market pairs. Leica, Hasselblad and OM Digital do not have that arithmetic, and the divergence between their pricing and the majors’ is partly a compliance-cost story that never appears in a specification table.
The access lever: export controls and one Chinese signal
Controls on semiconductor manufacturing equipment — coordinated across the United States, Japan and the Netherlands — affect sensor fabrication capacity rather than camera features. The camera industry is a bystander to that policy, but it is not unaffected: when leading-edge capacity is contested, the allocation that reaches a camera line is the allocation nobody else wanted.
The one regional signal worth flagging is in the lens data. CIPA reports that full-frame interchangeable lens shipments fell in 2025 while crop-sensor shipments rose, and attributes the decline specifically to China, where full-frame lens shipments fell even as they rose in every other region. Whether that is consumer demand, grey-market flows or policy, the effect is the same: the highest-value lens category is contracting in the largest unit market, and that is a fact the growth case has to absorb.
What the absence of regulation means for the forecast
Because nothing compels a purchase, this report’s model is purely a demand-and-price model. There is no compliance floor under the base case, no statutory driver that can be added to rescue a weak year, and no regulator whose timetable can be read forward. Every sensitivity in Chapter 6 is therefore a demand or a price sensitivity, and none of them can be resolved by reading a statute.
The one place regulation does bite is the used market, where repair obligations and spare-part availability are slowly changing how long a body stays in service. A camera that is repairable for twelve years instead of five is a camera that is bought half as often. No series measures that yet, and this report does not put a number on it — but it is the only regulatory lever pointed directly at the replacement cycle that the whole forecast rests on.