
Editorial Article
Warehouses Stopped Losing Jobs. They Still Can't Staff the Second Shift.
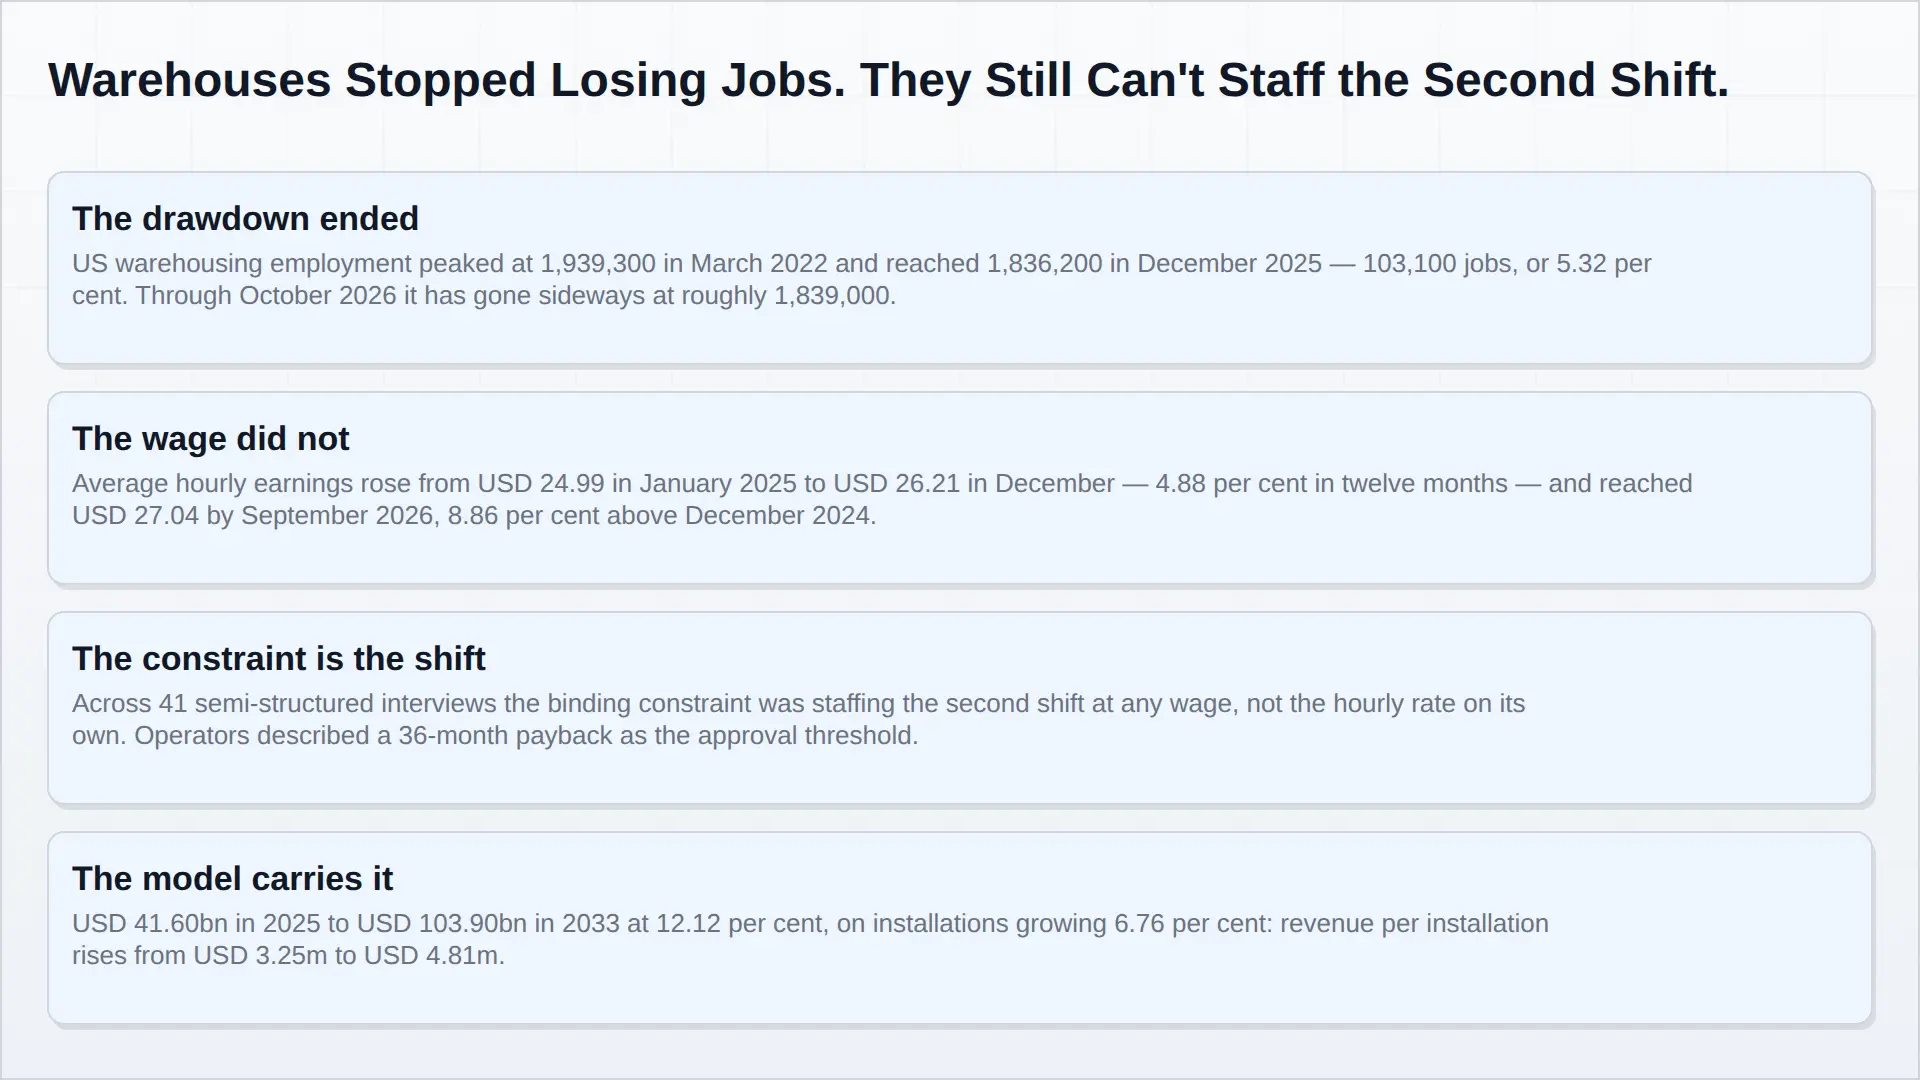
Warehousing employment in the United States peaked at 1,939,300 in March 2022. By December 2025 the seasonally adjusted count was 1,836,200 — 103,100 fewer, a fall of 5.32 per cent in under four years. For most of that period it was the most quotable single fact in warehouse automation, and it was true.
It is no longer current. Between January and October 2026 the same series moved from 1,830,400 to 1,839,200. It went sideways. The drawdown ended in the first quarter of 2026, roughly a hundred thousand jobs below the peak and no longer falling. Anyone still selling automation against a chart of disappearing warehouse jobs is selling the 2022 story into a 2026 market.
The 2026 line is not a recovery. October 2026 sits about three thousand jobs above December 2025, which is a rounding error in a series that moves six figures in a year. What it is, is a floor — and a floor changes the argument, because the case for automation no longer rests on the people who left. It rests on the price of the people who stayed.
The wage did not go sideways
The Bureau of Labor Statistics publishes a companion series for average hourly earnings of all employees in warehousing and storage: same industry, same seasonal adjustment, same survey. Over the period in which headcount stopped falling, the wage did this. USD 24.99 in January 2025. USD 26.21 in December — 4.88 per cent inside twelve months. Then USD 27.04 in September 2026, preliminary, which is 3.17 per cent above December 2025 and 8.86 per cent above December 2024’s USD 24.84.
Put the two curves next to each other and the arithmetic stops being ambiguous. Employment in October 2026 is flat against December 2025. The wage is up 3.17 per cent over the same ten months. The operator is no longer buying relief from a shrinking workforce; the operator is buying relief from a workforce whose hourly cost compounds at three to four per cent a year with no productivity offset, because there is no surplus of labour left to bid it down.
That is a different purchase, and it behaves differently. A headcount-replacement case strengthens as the labour market tightens and weakens the moment it loosens. A cost-per-hour case survives a looser labour market, because wages do not fall in one. The second kind of case is the one the market is now making, whether or not the people making it have noticed.
What the payroll series cannot tell you
Aggregate employment is a poor guide to a specific building in a specific labour market, and it is entirely silent on the mechanism that actually triggers a purchase order. That mechanism came out of the primary research programme behind our warehouse automation model: 41 semi-structured interviews with integrators, component vendors and operators, twelve open-ended follow-ups, trade-event conversations with systems engineers, and a survey of operators on approval thresholds.
The finding that reorganised our model was not about cost. It was about the shift nobody could hire. Operators described the constraint operationally rather than financially — a posted rate that produced no applicants, a line that could not be run at design throughput because the people to run it did not exist, an overtime bill that arrived as a symptom rather than a cause. Once the constraint is expressed that way, the calculation changes owner. It stops being a wage-versus-machine comparison run quietly by finance and becomes an availability-versus-throughput problem run by operations, and those two conversations reach different answers about the same project.
From the same interviews we estimate that most operators approve warehouse automation against a payback threshold of roughly 36 months (Pheonix estimate, from the operator survey element of the programme). That threshold is the practical filter in this market. It explains why goods-to-person and cube-storage configurations sell readily into new build, where the comparison can be constructed cleanly against a designed labour model, and why piecemeal retrofit struggles even where the aggregate arithmetic looks favourable: the retrofit has to justify itself against a crew that is already there, while the new build only has to justify itself against a crew that would have to be hired.
Why this shows up as revenue per installation, not installations
Our 2026–2033 model puts the market at USD 41.60bn in 2025 and USD 103.90bn in 2033, 12.12 per cent a year. Installations go from 12,800 to 21,600 — 6.76 per cent. The gap between those two numbers is the whole report. Revenue per installation rises from USD 3.25m to USD 4.81m, about 48 per cent across the period, roughly 5 per cent a year.
Labour scarcity at the shift level pushes in exactly that direction. When the missing input is a person who performed a bundle of tasks, the answer is not one machine that does one thing. It is the controls, the software, the integration and the service that let a smaller crew run the same footprint at the same throughput. That is why software and controls compound at 17.94 per cent and cube storage at 19.81 per cent, against 8.87 per cent for conveyor and 8.57 per cent for unit-load cranes. The metal-heavy layers fall from 69 per cent of value to 57 per cent across the forecast. The market grows by putting more into each installation and less steel around it.
Which means the labour argument and the mix argument are the same argument seen from two ends. Falling headcount would have produced more, cheaper boxes — volume-led growth with price deflation. A flat headcount carrying a rising wage produces fewer, fuller installations — content-led growth that can hold price. The 2026 payroll series is evidence for the second. Anyone who reads the 2022 series as the market’s permanent condition is arguing for the first.
The falsifier
Every forecast has a hinge, and this one is honest enough to name. If the 2026 plateau turns out to be the beginning of a looser labour market rather than a new floor — through participation, through immigration policy, through automation of adjacent tasks that frees labour back into the picking aisle — then the second-shift argument weakens at exactly the point where installations matter. Installation growth undershooting 6.76 per cent would leave the value case resting entirely on content per installation, which is a price story rather than a volume story, and price stories in capital equipment are always contestable.
The mirror risk is the other way. If wages keep compounding at three to four per cent while headcount stays flat, the 36-month payback threshold becomes easier to clear every year without any change in hardware cost, and the mix shift accelerates. That is the more likely path on the evidence available, but it is a path, not a certainty.
What to watch
- CES4349300001, monthly. Whether the 2026 plateau holds through the first quarter of 2027, and whether the preliminary October figure of 1,839,200 is revised. A break below 1,830,000 restarts the drawdown narrative in a way the market would notice; a sustained move above 1,850,000 undermines it.
- CES4349300003, monthly. Whether earnings growth decelerates below three per cent year on year. That single number, more than any hardware price index, determines whether the payback case strengthens or erodes.
- Order intake at the product end against revenue at the integrator end. These diverge by years, not quarters, and the divergence is the market’s leading indicator rather than its confirmation.
The labour arithmetic is not the whole report — margin structure, the conformity burden arriving in Europe in January 2027, and the working-capital constraint that sits behind every integrator’s growth are all argued in the report itself. But it is the part that decides whether the buyer is replacing people or replacing cost, and those two buyers sign different contracts.
Related research
- Global Warehouse Automation & Automated Storage and Retrieval (AS/RS) Market Report, 2026–2033 — the parent report, with the full model, layer CAGRs and primary research programme.
- Global Industrial Automation Market Report, 2026–2033 — the whole-market frame this sits inside.
- Global Robotic Arm Market, 2026–2033 — the component layer that competes with, and increasingly plugs into, automated storage.
- Global Predictive Maintenance (PdM) Market, 2026–2033 — the service layer whose economics depend on the same installed base.
Sources
- US Bureau of Labor Statistics, CES series CES4349300001 — all employees, thousands, warehousing and storage (NAICS 493), seasonally adjusted. Extracted 20 November 2026; October 2026 figures preliminary.
- US Bureau of Labor Statistics, CES series CES4349300003 — average hourly earnings of all employees, warehousing and storage, seasonally adjusted. Extracted 20 November 2026; September 2026 figure preliminary.
- Daifuku Co., Ltd., FY2025 results presentation; KION Group, Annual Report 2025 (including Note 41); Symbotic, Q4 and FY2025 results; AutoStore, Q4 2025 results; Kardex, Annual Report 2025; Vanderlande, FY25 annual report.
- MHI, 2026 Annual Industry Report, survey of more than 500 supply chain professionals.
- Pheonix Research primary research programme: 41 semi-structured interviews, trade-event interviews, twelve open-ended follow-ups and an operator survey on payback thresholds. Interview-derived figures are labelled Pheonix estimates in the text.
Frequently Asked Questions
What was peak US warehousing employment, and where is it now?
The seasonally adjusted series for warehousing and storage (CES4349300001) peaked at 1,939,300 in March 2022 and stood at 1,836,200 in December 2025 — a fall of 103,100 jobs, or 5.32 per cent. Through 2026 the series has gone sideways, moving from 1,830,400 in January to 1,839,200 in October (preliminary).
How fast are warehouse wages rising?
Average hourly earnings of all employees in warehousing and storage rose from USD 24.99 in January 2025 to USD 26.21 in December 2025, 4.88 per cent in twelve months, and reached USD 27.04 in September 2026 (preliminary) — 3.17 per cent above December 2025 and 8.86 per cent above December 2024.
How big is the global warehouse automation and AS/RS market?
Pheonix Research models the market at USD 41.60bn in 2025 rising to USD 103.90bn in 2033, a 12.12 per cent CAGR. Installations grow from 12,800 to 21,600 at 6.76 per cent, which takes revenue per installation from USD 3.25m to USD 4.81m.