
Editorial Article
Seventy-Two Per Cent of This Market's Growth Is Just More Meals. The Packaging Does Almost Nothing.
A forecast that credits packaging innovation for the growth of foodservice packaging is crediting the wrong variable. The market is worth USD 96,000 million in 2025 and reaches USD 126,471 million by 2033, a value CAGR of 3.51 per cent. Decompose that number and the credit goes somewhere else entirely.
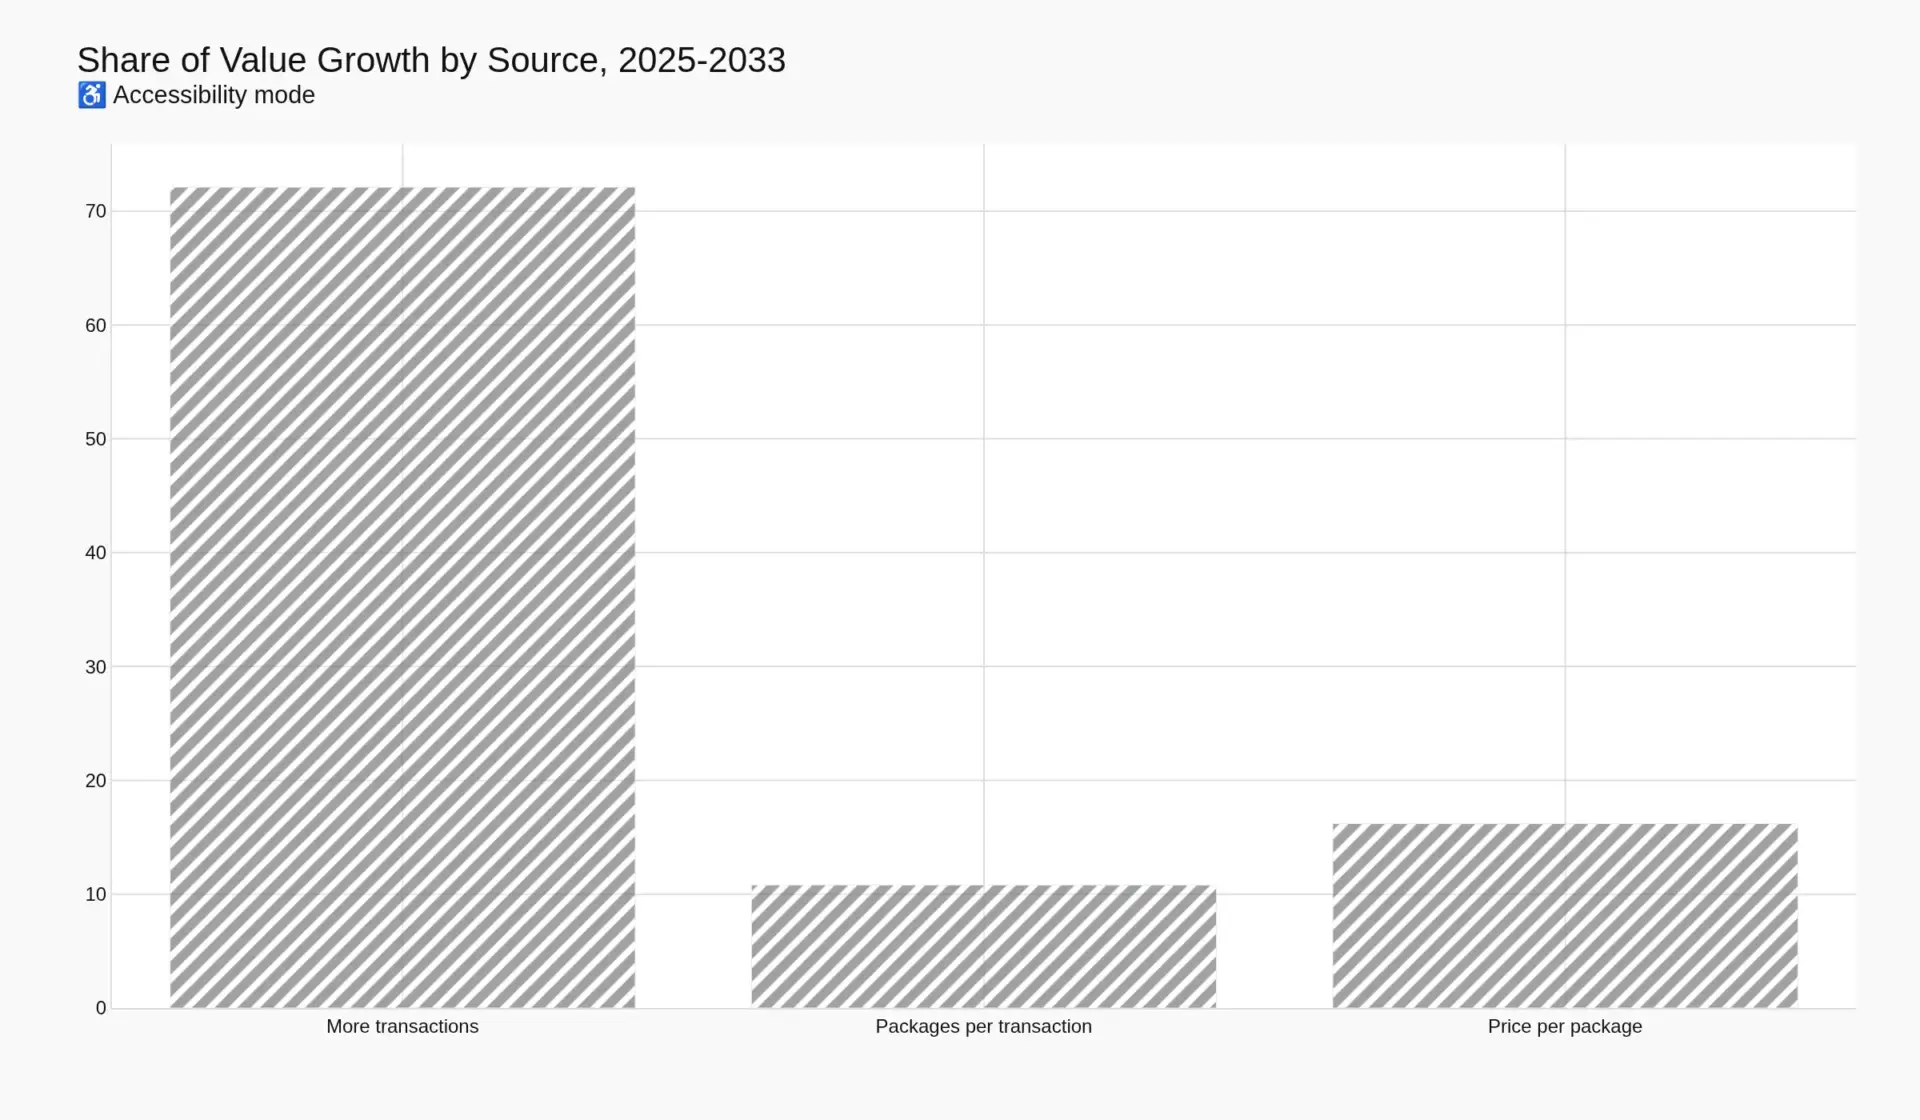
72.1 per cent of the growth is simply more away-from-home transactions. Ten point eight per cent is more packages per transaction. Sixteen point two per cent is a higher price per package. Nothing in this market grows because the package got better.
The ladder
Three terms multiply to make the 3.51 per cent, and each is knowable.
| Term | 2025 | 2033 | CAGR | Share of growth |
|---|---|---|---|---|
| Away-from-home transactions (billion) | 610 | 745 | 2.53% | 72.1% |
| Packages per transaction | 1.63 | 1.68 | 0.38% | 10.8% |
| Value per package (US cents) | 9.66 | 10.10 | 0.57% | 16.2% |
| Market value (USD million) | 96,000 | 126,471 | 3.51% | 100% |
Read the bottom two rows together and the market’s character appears. Value per transaction — the number an operator actually experiences — moves from 15.74 to 16.98 US cents. At the same time the physical volume behind it grows 2.93 per cent a year in tonnage, from 22.57 to 28.44 million tonnes, while realisation per tonne goes from USD 4,253 to USD 4,447, or 0.56 per cent a year.
This is a physical-growth business with a compliance tail. Value grows faster than tonnage; tonnage grows almost as fast as value; the price line is flat enough to ignore and important enough to explain the whole difference between the market’s 3.51 per cent and its 2.93.
Three quarters of the traffic now needs a package
The transaction term is not a proxy for population or GDP. It is a proxy for how often people eat food they did not cook, and the channel composition of that habit has moved decisively.
The National Restaurant Association’s 2025 Off-Premises Restaurant Trends report puts nearly 75 per cent of all United States restaurant traffic off-premises — almost three orders in four taken to go. It also reports that off-premises accounts for a larger share of sales than in 2019 for 58 per cent of limited-service and 41 per cent of full-service operators, and that 65 per cent of limited-service operators now offer delivery.
Seventy-five per cent is the load-bearing number in this forecast. A dine-in transaction needs a plate, a glass and a dishwasher. An off-premises transaction needs a container, a lid, a bag, a sachet and often cutlery. The move from one to the other multiplies the packaging per meal by something between three and six, and it has happened inside fifteen years without a single packaging company having to invent anything.
That is why the 1.63-to-1.68 term is small but worth watching. It is a channel variable, and delivery penetration is nowhere near settled outside North America, China and the United Kingdom. Every point of off-premises share gained in a market that is still mostly dine-in is worth more to this industry than any barrier coating.
What the mix contributes — and what it does not
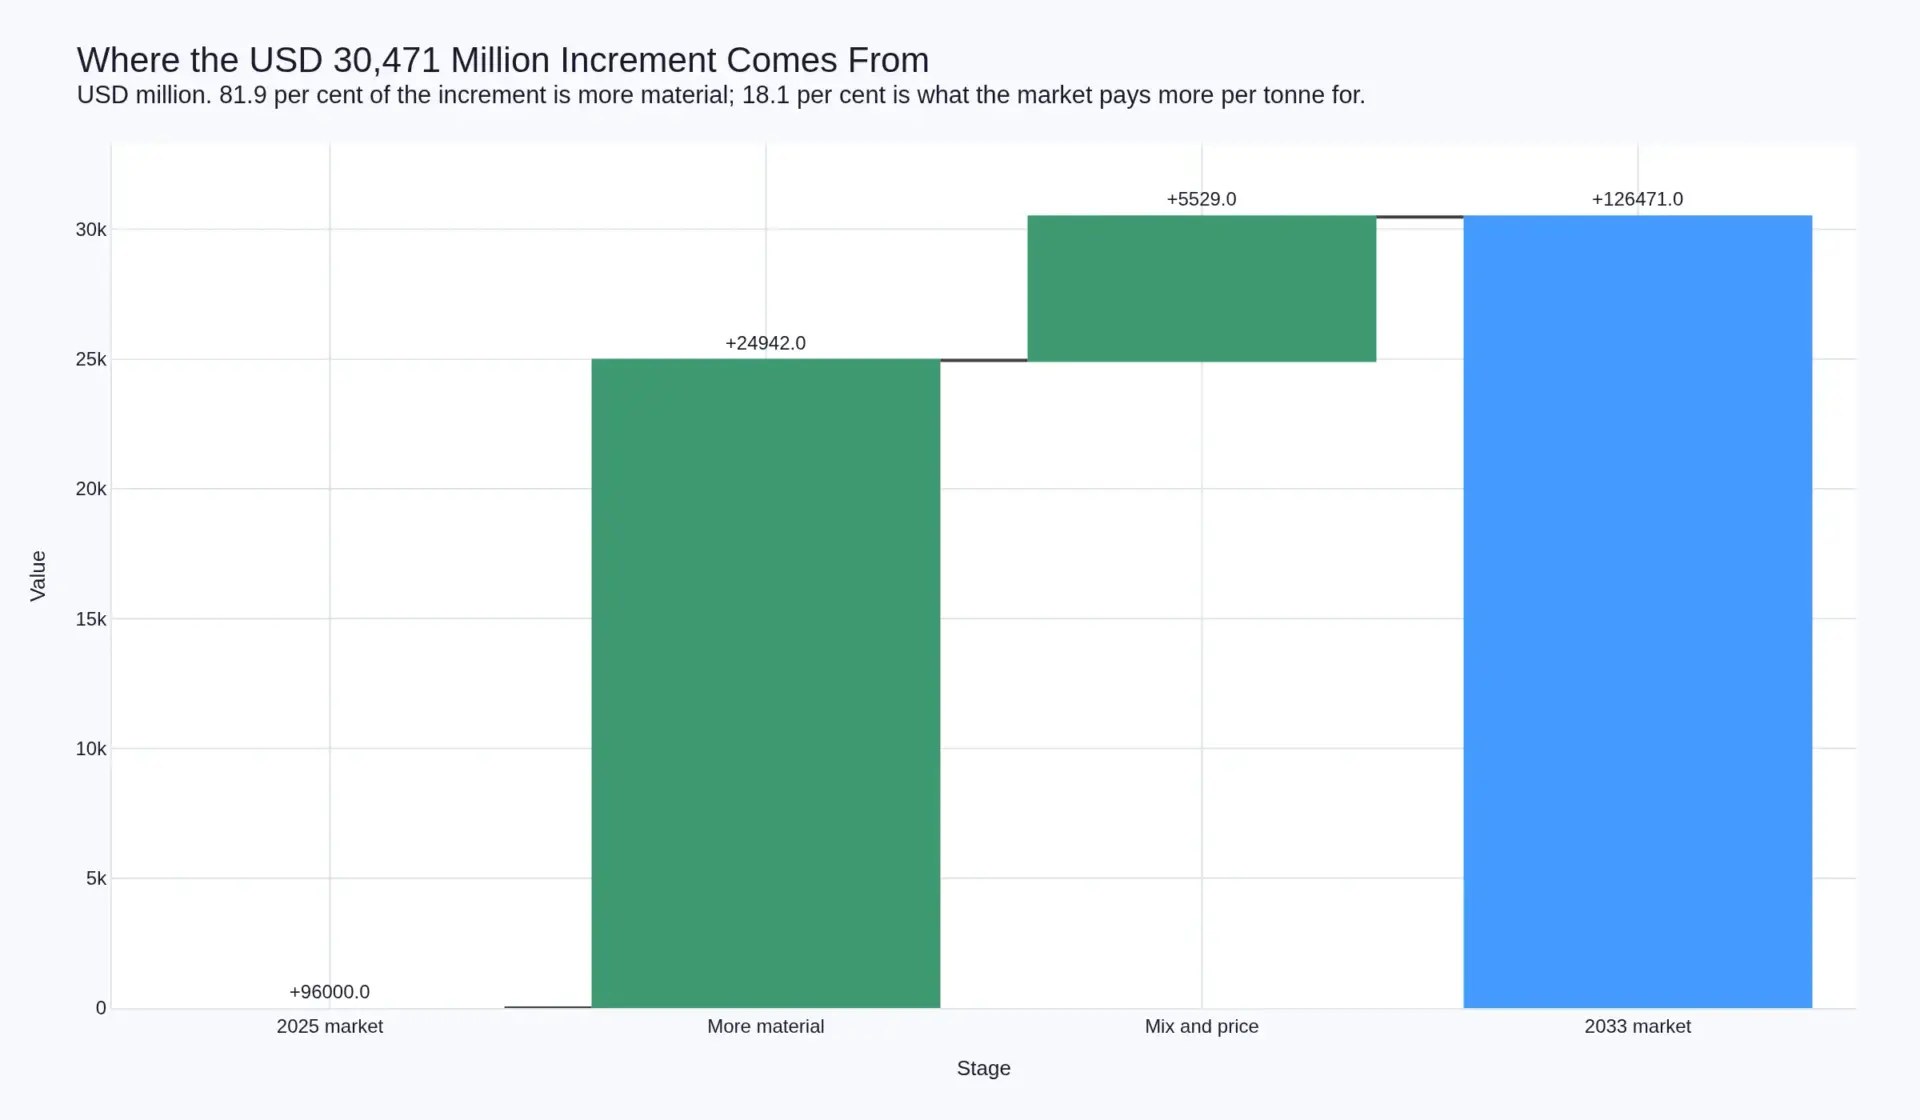
The remaining 18.1 per cent is the part the industry talks about, and it is worth pricing honestly. Hold the 2025 category mix, grow each line’s tonnage at its own rate, and 2033 is worth USD 120,942 million. The model has USD 126,471 million. The USD 5,529 million gap is what the market pays more per tonne for — partly substrate mix as paper and fibre take share from polystyrene, partly price.
Scale that against the transition that produces it. Converting the entire global pool of EPS foodservice containers — 36.9 billion units a year at 5.81 cents — to moulded fibre at 14.10 cents is worth USD 3,059 million on unchanged units. That is 3.19 per cent of the market, and it is the single largest substrate event available to this industry.
Which produces the most useful sentence in the report: the regulation that dominates every conference panel is a three per cent event in value and a career-defining one for the converters holding the affected lines. Both statements are true at once, and understanding why is the difference between reading this market correctly and misreading it badly.
The number that would break the forecast
Three falsifiers are stated in the report. The first matters most because it attacks the term that carries 72.1 per cent of the growth.
If off-premises traffic falls below 70 per cent of United States restaurant orders for two consecutive years, the packages-per-transaction assumption is not merely wrong — it reverses, and the base case is high by more than the conservative scenario assumes. The conservative case, at 2.60 per cent, lands at USD 117,883 million in 2033; the optimistic case, at 4.30 per cent, at USD 134,445 million.
The second: if fibre’s premium over polypropylene narrows below 20 per cent from the 41 per cent modelled, the USD 5,529 million mix term largely disappears and 2033 lands near the mix-neutral USD 120,942 million — a value CAGR nearer 2.9 than 3.51.
The third: if distributor gross margin on packaging compresses below 15 per cent, the value-chain split in the report is wrong. That does not change the size of the market, but it changes every strategic conclusion drawn from it.
Why this should be read as a derivative
Foodservice packaging is a derivative of foodservice transactions, and the market’s behaviour only makes sense when it is treated that way. It is not price-elastic, because the package is 1.80 cents of the meal. It is not innovation-led, because two thirds of its growth is people buying more meals. It is not consolidated on the supply side, because concentration sits with the distributor and the ten customers who are 44 per cent of a leading converter’s revenue.
What it is, is a compliance-sensitive, physically-growing, pass-through industry whose volume moves with the restaurant occasion count and whose substrate mix moves with the statute book. Forecast the first and you will be approximately right. Forecast the second and you will be right about three per cent of the market and wrong about the seventy-two per cent that pays for everything.
Methodology: this article draws on Pheonix Research’s Global Foodservice Packaging report (2025 base year, 2026–2033 forecast) on a 70 per cent secondary and 30 per cent primary research split. Secondary sources include USDA Economic Research Service, the National Restaurant Association’s 2025 Off-Premises Restaurant Trends report, Pactiv Evergreen and Sysco filings, and the European Commission’s single-use plastics materials. Primary inputs are converter, distributor and operator interviews, conference proceedings and a structured operator survey. No market-research competitor data is cited.
Frequently Asked Questions
What share of foodservice packaging growth is just more meals being eaten away from home?
Seventy-two point one per cent. Away-from-home transactions rise from 610 billion to 745 billion a year, a CAGR of 2.53 per cent, and that single term accounts for 72.1 per cent of the market's 3.51 per cent value growth. A further 10.8 per cent comes from packages per transaction rising from 1.63 to 1.68, and 16.2 per cent from value per package rising from 9.66 to 10.10 US cents. The channel context is that nearly 75 per cent of United States restaurant traffic is now off-premises, so three quarters of transactions require a package where a plate would once have done.
Why does moving from dine-in to off-premises matter so much for packaging volume?
Because a dine-in transaction needs a plate, a glass and a dishwasher, while an off-premises transaction needs a container, a lid, a bag, a sachet and often cutlery — somewhere between three and six times the packaging per meal. The National Restaurant Association reports nearly 75 per cent of United States restaurant traffic off-premises in 2025, with 65 per cent of limited-service operators offering delivery. That shift happened without any packaging company inventing anything, and it is worth more to the market than every substrate conversion combined.
How much of the growth comes from the shift to paper and fibre rather than from volume?
Eighteen point one per cent of the increment. Hold the 2025 category mix, grow each line's tonnage at its own rate, and 2033 is worth USD 120,942 million against the modelled USD 126,471 million. The USD 5,529 million gap is what the market pays more per tonne for through substrate mix and price. For scale, converting the entire global EPS foodservice container pool — 36.9 billion units at 5.81 cents — to moulded fibre at 14.10 cents is worth USD 3,059 million, 3.19 per cent of the market.
What would falsify this forecast?
If off-premises traffic falls below 70 per cent of United States restaurant orders for two consecutive years, the packages-per-transaction assumption reverses and the base case is high by more than the conservative scenario assumes. If fibre's premium over polypropylene narrows below 20 per cent from the 41 per cent modelled, the USD 5,529 million mix term largely disappears and 2033 lands near the mix-neutral USD 120,942 million — a value CAGR nearer 2.9 than 3.51. And if distributor gross margin on packaging compresses below 15 per cent, the report's value-chain split is wrong even though the market size is not.