
Company Profile
Contemporary Amperex Technology Co. Limited
Contemporary Amperex Technology Co., Limited — CATL — is the world’s largest manufacturer of electric-vehicle batteries. It held 39.2% of global power-battery installations in 2025, its ninth consecutive year in first place, and 39.1% in the first nine months of 2026 on 389.2 GWh. It is also the largest supplier of energy-storage batteries, a position it has held for five consecutive years. In 2025 the group sold 661 GWh of lithium batteries, up nearly 40%, on revenue of RMB 423.70 billion and net profit attributable to shareholders of RMB 72.20 billion.
The 2026 record reads differently from the 2025 one. Revenue in the first nine months rose 56.19% to RMB 442.14 billion while net profit rose 31.60% to RMB 64.53 billion; in the third quarter alone revenue grew 58.58% and net profit 14.54%. Volume is being added faster than profit, and the group’s net margin has moved from 17.04% in 2025 to 14.60% over nine months and 12.86% in the third quarter.
Reference data
| Legal name | Contemporary Amperex Technology Co., Limited (寧德時代新能源科技股份有限公司) |
| Graph entity name | Contemporary Amperex Technology Co. Limited |
| Listing | SZSE: 300750 · HKEX: 3750 (H shares listed 2025) |
| Headquarters | Ningde, Fujian, China |
| Chairman and general manager | Zeng Yuqun |
| Fiscal year | Calendar year (to 31 December) |
| Manufacturing footprint | Six R&D centres and 24 battery factories as at 31 December 2025 |
| Core businesses | Power batteries for vehicles; energy-storage systems; battery materials, recycling (Brunp) and mineral resources; battery swapping; emerging applications in vessels, aircraft and data centres |
| Official website | catl.com/en |
| Wikidata | Q18653563 |
| Pheonix entity ID | MIEN-node_0ff51541 |
| Pheonix segment | Electric Vehicle (EV) |
Executive summary
CATL sits at the widest point of the electric-vehicle supply chain. Its cell output goes into vehicles built by most of the world’s large automakers — by technology licensing, joint development and local supply rather than by ownership — and its storage output goes into utility and data-centre projects. Both businesses were built on the same manufacturing base: 24 battery factories, six R&D centres and more than 23,000 R&D staff, with all core-operated battery plants reported as carbon-neutral at the end of 2025.
The financial record has two phases. Through 2024 and 2025 the company grew profit faster than revenue: revenue fell 9.70% in 2024 on lower material prices while net profit rose 15%, then revenue rose 17.04% in 2025 while net profit rose 42.28%, lifting the net margin to 17.04% and the weighted average return on net assets to 24.91%. In 2026 the relationship inverted: nine-month revenue rose 56.19% and net profit 31.60%, and the third quarter’s net margin of 12.86% is the lowest of the series shown below.
Key highlights
- Two first places, not one. CATL led global power-battery installations for a ninth consecutive year in 2025 (39.2%) and led energy-storage battery shipments for a fifth (2021–2025).
- 2025 was a profit year. Net profit rose 42.28% on revenue growth of 17.04%; recurring net profit rose 43.37%; operating cash flow reached RMB 133.22 billion.
- 2026 is a volume year. Nine-month revenue of RMB 442.14 billion already exceeds the whole of 2025, while net margin has fallen from 17.04% to 14.60% over nine months and 12.86% in the third quarter.
- Storage is the second engine. Global energy-storage battery shipments were 550 GWh in 2025, up 79%; CATL launched the 9 MWh TENER Stack system and, in June 2026, a field-validated sodium-ion storage system.
- Europe is being built now. Trial production began at Debrecen on 22 September 2026; once complete, the 100 GWh plant will be CATL’s largest manufacturing base outside China.
Market position
The global EV battery market was worth USD 91.7 billion in 2025 on Pheonix’s model and is forecast to reach USD 369.5 billion by 2033, a 19.03% CAGR. Installations across battery-electric, plug-in hybrid and conventional hybrid vehicles reached 1,187 GWh in 2025 (+31.7%) and 994.5 GWh in January–September 2026 (+19.7%), with a monthly record of 145.1 GWh in September 2026.
| Supplier | Global share, FY2025 | Global share, Jan–Sep 2026 | Installations Jan–Sep 2026 (GWh) |
|---|---|---|---|
| CATL | 39.2% | 39.1% | 389.2 |
| BYD | 16.4% | 15.2% | 150.9 |
| LG Energy Solution | 9.2% | 8.2% | 81.9 |
| Gotion High-tech | 4.5% | 5.1% | 50.3 |
| CALB | 5.3% | 5.0% | 50.1 |
| Eve Energy | 2.6% | 3.6% | 36.0 |
| Panasonic | 3.7% | 3.6% | 35.6 |
| SK On | 3.7% | 2.8% | 28.3 |
| Svolt Energy | 2.4% | 2.6% | 25.7 |
| Rept Battero | — | 2.4% | 24.2 |
| Others | 10.5% | 12.3% | 122.4 |
| Total | 100% | 100% | 994.5 |
Global EV battery installations, full-year 2025 and January–September 2026. Source: SNE Research, as cited in CATL’s 2025 annual report and reported by CnEVPost, February and November 2026.
Three features of that table matter. The first is the size of the lead: at 39.1% CATL is 23.9 percentage points ahead of the second supplier, a gap wider than the whole of BYD’s share. The second is the direction of travel within 2026: CATL’s own installations grew 24.9% against a market up 19.7%, so its share rose from 37.5% a year earlier, while BYD’s fell from 16.9% to 15.2% — a 17.5 percentage-point difference in growth rates that SNE attributes to CATL’s continued expansion of its overseas automaker customer base against BYD’s cell supply being tied to its own vehicle sales. The third is nationality: the seven Chinese firms in the top ten held 73.0% of the market between them, up 3.5 percentage points year on year.
Energy storage is the second position, and a different competitive set. Global storage battery shipments reached 550 GWh in 2025, up 79%, driven by renewable build-out, the widening peak-to-valley price spread that makes projects economic, and data-centre demand; China alone added 189.5 GWh of new-type storage capacity in 2025, up 73%. CATL has led that market for five consecutive years, and its product ladder now runs from cell and cabinet to the 6.25 MWh TENER unit, the 9 MWh TENER Stack, and — from June 2026 — a sodium-ion system.
Financial performance
CATL reports on a calendar year and files quarterly in Shenzhen and Hong Kong. The four-column record below covers the years in which revenue fell while profit rose, the year in which both rose, and the nine months in which revenue rose much faster than profit.
| RMB billion unless stated | FY2023 | FY2024 | FY2025 | 9M 2026 |
|---|---|---|---|---|
| Operating revenue | 400.92 | 362.01 | 423.70 | 442.14 |
| Revenue growth | — | −9.70% | +17.04% | +56.19% |
| Net profit attributable to shareholders | 44.12 | 50.74 | 72.20 | 64.53 |
| Net profit growth | — | +15.0% | +42.28% | +31.60% |
| Net margin | 11.01% | 14.02% | 17.04% | 14.60% |
| Recurring net profit (ex-non-recurring) | 40.09 | 44.99 | 64.51 | 57.88 |
| Net cash from operating activities | 92.83 | 96.99 | 133.22 | 61.63 (−23.60%) |
| Basic earnings per share (RMB) | 10.06 | 11.58 | 16.14 | 14.13 (+28.22%) |
| Weighted average return on net assets | 24.04% | 24.13% | 24.91% | — |
| Total assets | 717.17 | 786.66 | 974.83 | — |
| Third-quarter net profit, single quarter | — | — | 18.55 | 21.25 |
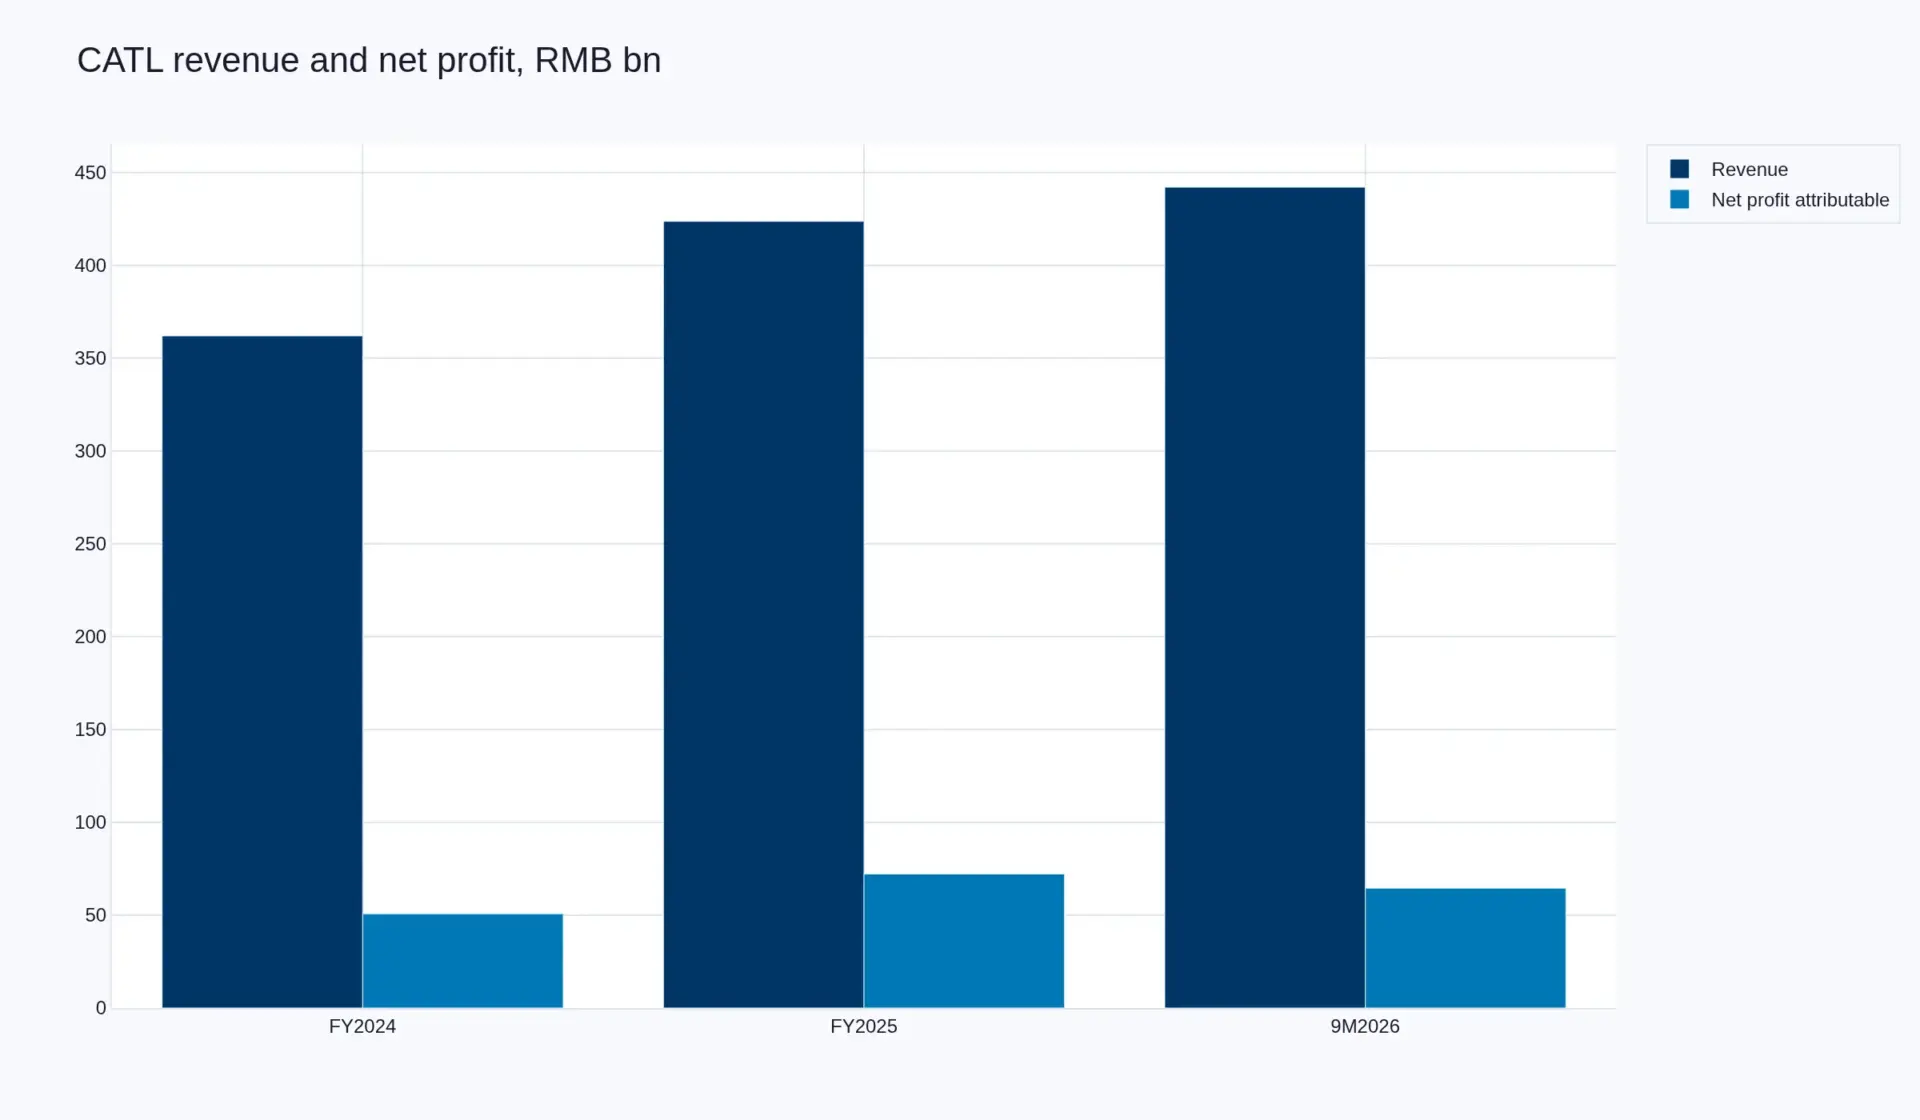
CATL operating revenue and net profit attributable to shareholders, RMB billion. FY2024 and FY2025 are full years; 9M2026 is nine months and is not comparable with a full year.
Four things in the record are worth separating from the headline rates. The first is the 2024 revenue decline of 9.70% alongside a 15% profit increase — a year in which falling material prices pulled revenue down faster than cost, and margin therefore expanded. The second is 2025, when both lines rose and the net margin reached 17.04%, its high point in the series. The third is the 2026 inversion: nine-month revenue of RMB 442.14 billion is already above the whole of 2025, on third-quarter revenue growth of 58.58%, while third-quarter net profit grew 14.54% and the quarter’s net margin settled at 12.86%. The fourth is cash: operating cash flow fell 23.60% to RMB 61.63 billion over the same nine months in which net profit rose 31.60%, which is what a working-capital build against rapidly rising volume looks like.
Capital returns have been stated policy rather than a one-off. The company paid out cash dividends equal to 50% of net profit for three consecutive years, and with the 2025 distribution cumulative dividends approach RMB 100 billion. The 2025 Hong Kong listing gave the group an offshore capital base for the overseas plants described below.
SWOT analysis
- 39.1% of global EV battery installations; first place for nine consecutive years
- 661 GWh of battery sales in 2025 across power and storage, up nearly 40%
- Technology breadth: Qilin, Shenxing, Naxtra sodium-ion, Freevoy dual-core, TENER Stack
- 24 plants, six R&D centres and more than 23,000 R&D staff; 24.91% return on net assets in 2025
- Net margin down from 17.04% (FY2025) to 14.60% (9M 2026) and 12.86% (Q3 2026)
- Operating cash flow down 23.60% in 9M 2026 while net profit rose 31.60%
- Revenue base still concentrated in China, with overseas capacity only now entering production
- Heavy fixed-cost commitments in Hungary and other offshore plants ahead of revenue
- Storage: a 550 GWh market in 2025 growing 79%, where CATL has led for five years
- Debrecen: 100 GWh, the largest base outside China, in trial production from September 2026
- Sodium-ion: TENER Sodium field-validated in June 2026, global deliveries from June 2027
- Adjacent electrification: roughly 900 vessels equipped, eVTOL, heavy trucks and data centres
- Overcapacity: roughly 4,800 GWh of planned Chinese nameplate against about 1,000 GWh of demand
- BYD’s LFP cost position and the domestic price war it is fighting
- Trade policy in the EU and US, and the EU’s cap on Chinese hybrid imports
- Lithium carbonate volatility above RMB 150,000 per tonne, driving chemistry substitution
Recent developments
| Date | Development | Source |
|---|---|---|
| 2 Nov 2026 | January–September global battery share confirmed at 39.1% on 389.2 GWh, up 24.9% year on year and ahead of a market up 19.7%; share rose from 37.5% a year earlier. | SNE Research via CnEVPost |
| 20 Oct 2026 | Third-quarter revenue of RMB 165.22 billion (+58.58%) and net profit of RMB 21.25 billion (+14.54%); nine-month revenue of RMB 442.14 billion (+56.19%) and net profit of RMB 64.53 billion (+31.60%). | HKEX 2026 third quarterly report |
| 22 Sep 2026 | Began trial production on the first two cell lines at Debrecen, Hungary, after obtaining the occupancy permit in August 2026. The site has produced 537,000 modules since autumn 2024 and will reach 100 GWh, making it CATL’s largest base outside China. | CATL press release |
| 22 Jun 2026 | Launched TENER Sodium in Munich, a sodium-ion storage system rated above 30 MWh per unit, with cumulative shipments expected to reach 1 GWh by the end of 2026 and global deliveries from June 2027. | CATL press release |
| 9 Mar 2026 | Full-year 2025 results: revenue RMB 423.70 billion (+17.04%), net profit RMB 72.20 billion (+42.28%), battery sales 661 GWh and a 39.2% power-battery share. | CATL 2025 annual results announcement |
| Jan 2026 | Chinese battery makers accelerated sodium-ion programmes as lithium carbonate rose above RMB 150,000 per tonne, reaching roughly RMB 170,000. | CarNewsChina (citing Autohome) |
| Dec 2025 | China’s Ministry of Industry and Information Technology issued carbon-footprint declaration rules for vehicle power batteries, a reporting obligation that falls first on cell makers. | CATL 2025 annual report |
| 2025 | Listed H shares on the Hong Kong Stock Exchange (stock code 3750), giving the group an offshore capital base for overseas manufacturing. | CATL 2025 annual report |
Business strategy
CATL’s strategy is stated in its own annual report as a move from localised breakthroughs to what it calls all-domain growth: deepening the vehicle battery business, extending into storage and infrastructure, localising production inside the markets that buy the product, and closing the material loop underneath both.
Where the strategy is exposed
Three constraints sit underneath the plan. First, price: with roughly 4,800 GWh of planned Chinese nameplate capacity against demand near 1,000 GWh, growth is being bought partly with margin — visible in the move from a 17.04% net margin in 2025 to 12.86% in the third quarter of 2026. Second, cash conversion: the nine-month operating cash flow of RMB 61.63 billion, down 23.60%, shows that volume growth at this pace consumes working capital even when it lifts profit. Third, policy: the Debrecen plant, technology licensing and joint ventures are all responses to trade measures rather than purely commercial choices, and each carries a fixed cost that begins before the revenue does.
Sources
- CATL, 2025 Annual Results Announcement (including the full 2025 annual report), HKEX, 9 March 2026 — catl.com
- CATL, 2026 Third Quarterly Report, HKEX, 20 October 2026 — hkexnews.hk
- CATL, “CATL Debrecen Kicks Off Trial Operations in its New Cell Building”, 22 September 2026 — catl.com
- CATL, “CATL Debuts World’s First Field-Validated Sodium-Ion BESS”, 22 June 2026 — catl.com
- CnEVPost, “Global EV battery market share in January–September 2026: CATL 39.1%, BYD 15.2%”, 2 November 2026 — cnevpost.com
- SNE Research data reported by CnEVPost, “Global EV battery market share 2025”, February 2026 — cnevpost.com
- CarNewsChina, “CATL, BYD fast-track sodium-ion battery shift as lithium prices soar”, January 2026 — carnewschina.com
- IEA, Global EV Outlook 2026 — Electric vehicle batteries — iea.org
- Pheonix Research market models: Global EV Battery Market (2025 USD 91.7 bn → 2033 USD 369.5 bn, 19.03% CAGR); Global Electric Vehicle Market (USD 892.6 bn → USD 2.41 tn, 13.25% CAGR).
Provenance: this profile is bound to Wikidata entity Q18653563 and Pheonix graph entity MIEN-node_0ff51541. Market presence is derived from published Pheonix market reports that name CATL. Sources dated to 2 November 2026; evidence last verified 14 November 2026.
Market Presence
Contemporary Amperex Technology Co. Limited is mentioned across 2 market reports.