Company Profile
Michelin
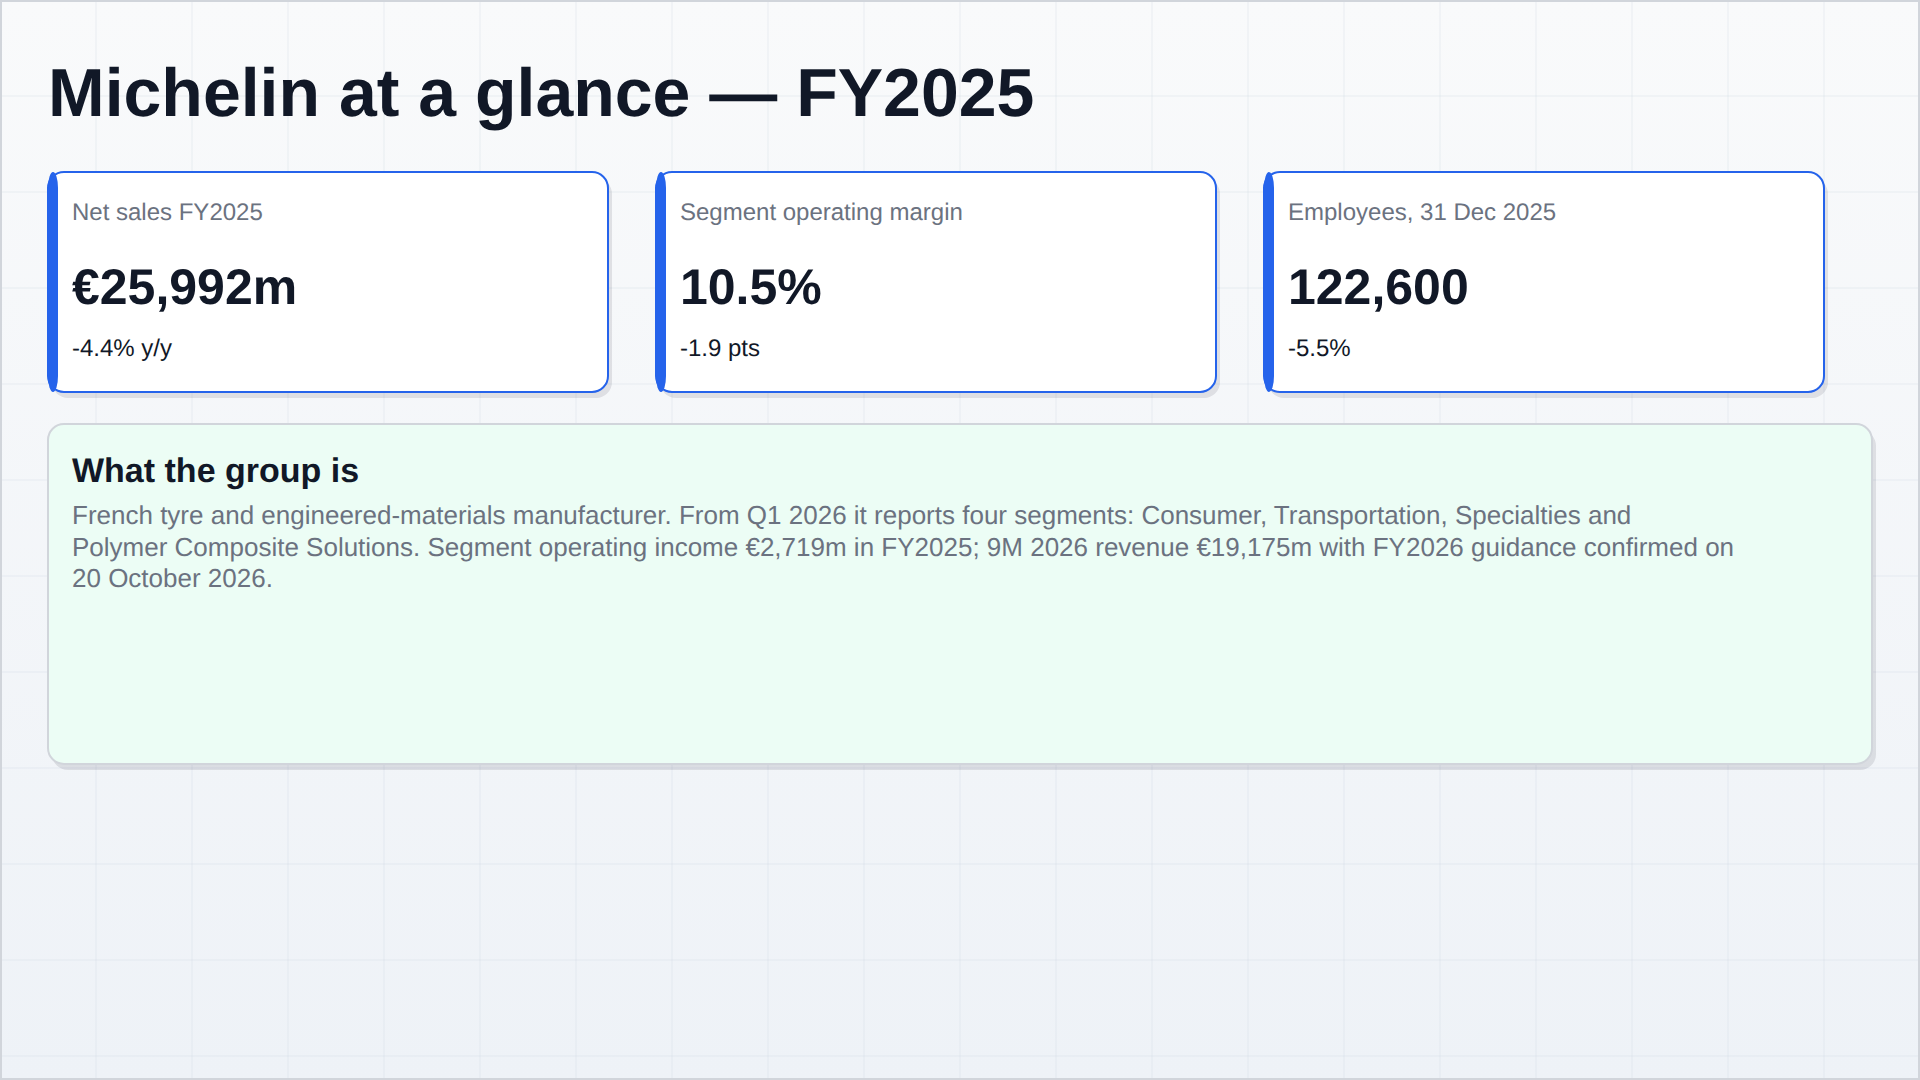
Michelin is a French tyre and engineered-materials group. In FY2025 it reported sales of €25,992m, segment operating income of €2,719m (10.5% of sales) and a net income of €1,664m, with 122,600 employees on the payroll at 31 December 2025. From the first quarter of 2026 the group reports four segments: Consumer, Transportation, Specialties and Polymer Composite Solutions.
Reference data
| Legal name | Compagnie Générale des Établissements Michelin |
|---|---|
| Listing / ticker | Euronext Paris — ML (MICP.PA) |
| Headquarters | Clermont-Ferrand, France |
| Reporting currency | Euro (€), millions unless stated |
| Wikidata identity | Q151107 — “French multinational tyre manufacturing company” |
| Pheonix entity | MIEN-node_b3a98f14 |
| Official website | michelin.com |
| Investor relations | michelin.com — results and revenue; analyst consensus |
| Primary filing | Universal Registration Document 2025 (annual report) |
Executive Summary
Michelin’s 2025 was a volume year, not a price year. Group sales fell 4.4% to €25,992m as tyre volumes declined 4.7%, and segment operating income fell 19.5% to €2,719m, taking the segment margin from 12.4% to 10.5%. The group attributes more than 80% of the volume decline to Original Equipment markets — principally truck and agricultural tyres in North America — and the operating consequence was fixed-cost under-absorption in plants that had been sized for a larger market. Price and mix added €745m against a €719m volume drag and a €228m raw-material headwind, so the shortfall is an absorption story rather than a pricing one.
The shape of the year differed sharply by segment. Consumer and two-wheel held an 11.7% margin on sales down 2.5%, helped by mix: 18-inch and larger MICHELIN-brand passenger car tyres reached 68% of MICHELIN-brand car tyre sales, three points higher than 2024. Transportation was the pressure point, with sales down 8.7%, volumes down 8.8% and the margin halving to 4.7% in a North American truck market the group describes as having shrunk 20% after manufacturers stockpiled Class 8 trucks. Specialties earned 13.5%, its beyond-road OE exposure offset by growth in mining and aircraft tyres.
2026 has been a stabilisation year. Nine-month revenue of €19,175m was 0.5% lower on a reported basis but 1.0% higher at constant exchange rates, with a 2.2% constant-currency increase in the third quarter, and the Polymer Composite Solutions acquisitions turned that segment from €942m to €1,149m. Volume guidance was trimmed in October 2026 with no fourth-quarter rebound assumed, while the segment operating income and free cash flow guidance was confirmed.
| Period | Highlight |
|---|---|
| FY2025 | Tyre volumes −4.7%; over 80% of the decline from Original Equipment, particularly truck and agricultural tyres in North America. |
| FY2025 | Segment operating income €2,719m (10.5%); free cash flow before M&A €2,126m; gearing reduced to 13.0% from 16.7%. |
| FY2025 | Employees on payroll down 5.5% to 122,600 as manufacturing capacity was adjusted to demand. |
| Jan 2026 | Reporting reorganised into four segments — Consumer, Transportation, Specialties, Polymer Composite Solutions — with 2025 restated. |
| Feb 2026 | Dividend held at €1.38 per share; buyback programme of up to €2.0bn announced for 2026–2028. |
| Oct 2026 | 9M revenue €19,175m (+1.0% constant FX); 2026 SOI and free cash flow guidance confirmed; volume outlook lowered. |
Company Overview
Business description
Michelin manufactures tyres and sells related distribution and services. The tyre business spans passenger car and light truck, two-wheel, truck and bus, and the “beyond-road” categories of agricultural, construction, materials-handling, mining and aircraft tyres, alongside retreads and a portfolio of owned brands positioned from premium downward. Distribution is a material part of the model rather than an adjunct: each reporting segment consolidates “and related distribution”, comprising integrated and franchised dealership networks supplemented by digital retail.
Beyond tyres, the group is building two adjacent activities that it discloses separately. MICHELIN Connected Fleet sells telematics and fleet-management services. Polymer Composite Solutions applies the group’s materials expertise to coated fabrics, sealing technology, conveyor belting and engineered components for industrial, aerospace, defence, medical and energy customers — the activity that became a fourth reporting segment in 2026.
Organisational structure and footprint
| Item | 2025 | 2024 | Comment |
|---|---|---|---|
| Reporting segments | 4 | 3 | Change effective Q1 2026 |
| Employees on payroll at 31 Dec | 122,600 | 129,800 | −5.5% |
| Full-time equivalents at 31 Dec | 115,800 | 123,500 | −6.2% |
| Employees in France | 17,000 | n/d | across 13 industrial sites (Nov 2026) |
| Research and development expense | €788m | €786m | 3.0% of sales |
| Capital expenditure | €1,967m | €2,182m | 7.6% of sales |
| The group does not publish a single plant count in its 2025 results communication; capacity is discussed by segment and by restructuring project rather than as a site total. France is the only country for which the group’s site count is disclosed in the current period (13 industrial sites). | |||
Financial Performance
Key financial highlights
| Line item | 2023 | 2024 | 2025 | 2025 vs 2024 |
|---|---|---|---|---|
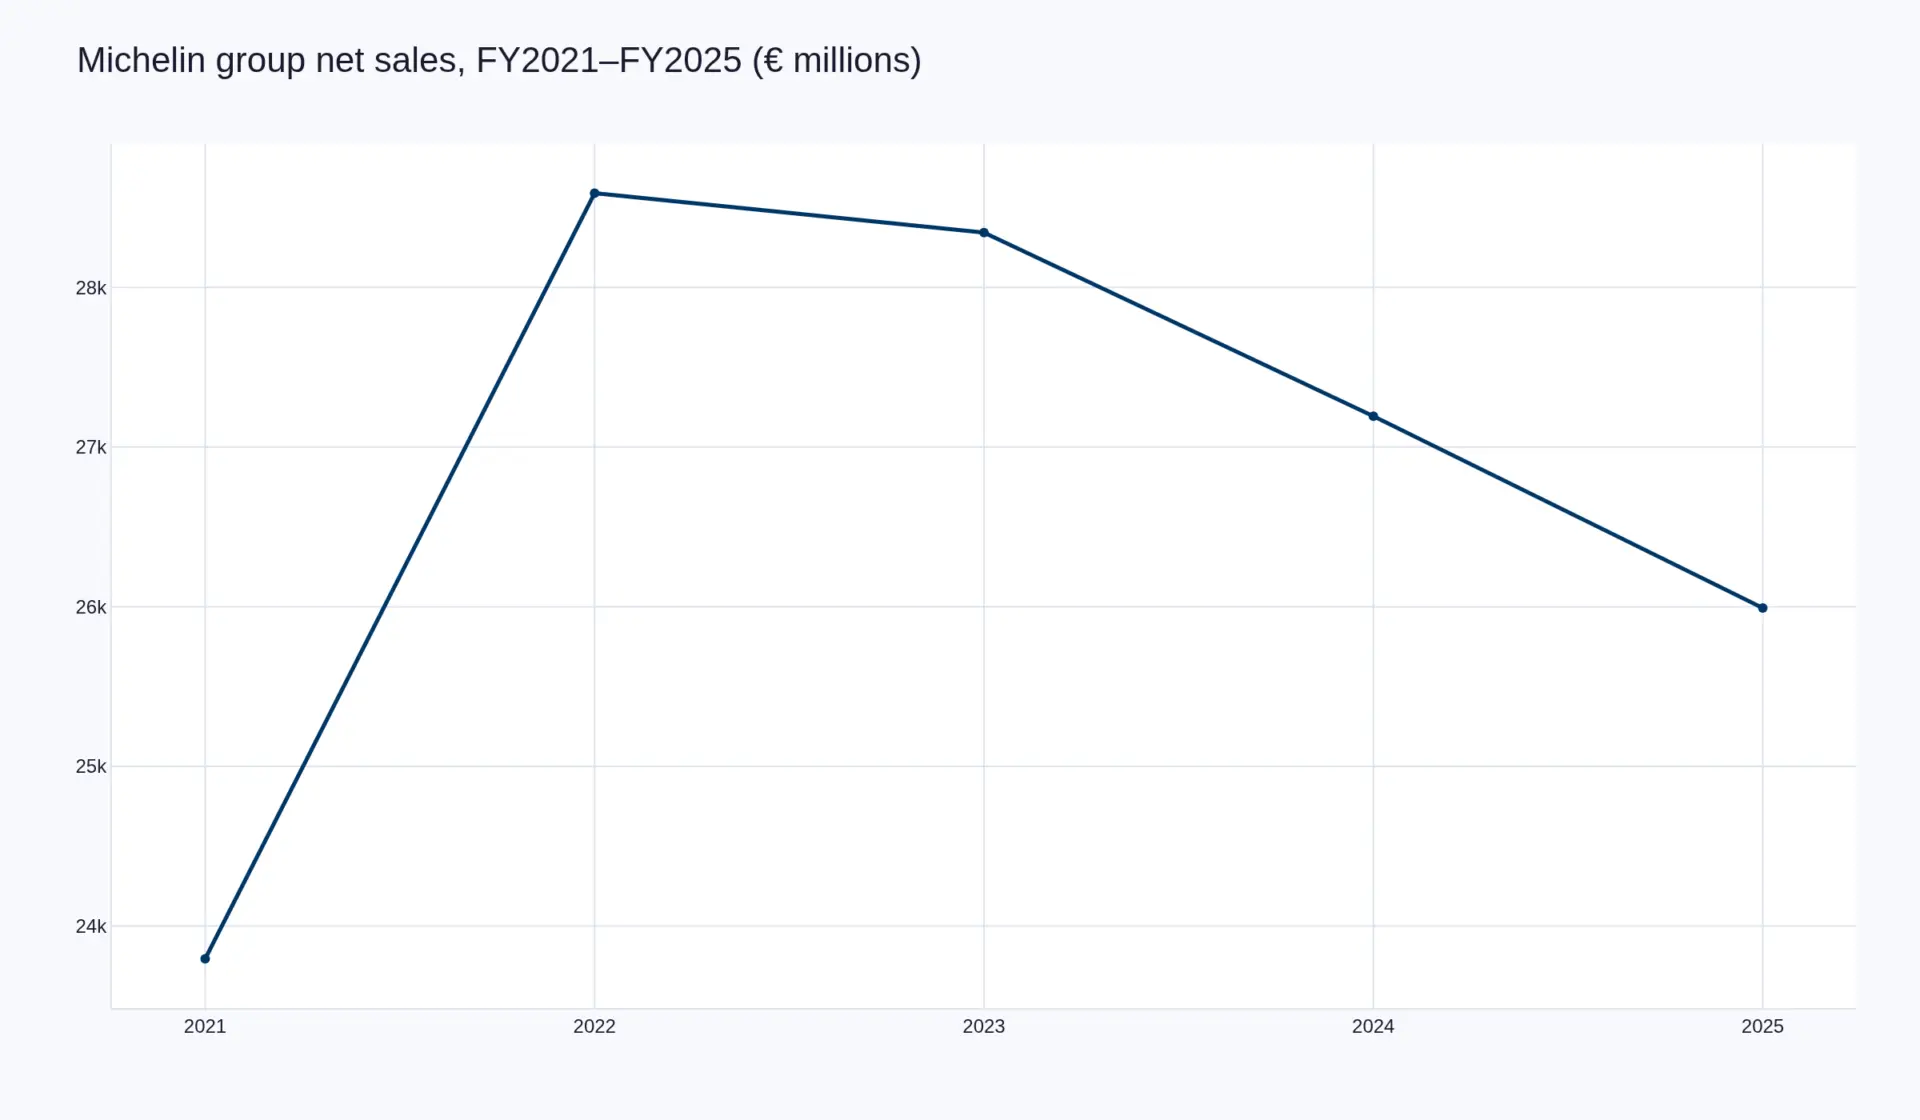
| Sales | 28,343 | 27,193 | 25,992 | −4.4% |
| Segment EBITDA | 5,489 | 5,361 | 4,663 | −13.0% |
| Segment operating income | 3,572 | 3,378 | 2,719 | −19.5% |
| Segment operating margin | 12.6% | 12.4% | 10.5% | −1.9 pts |
| Other operating income and expenses | (920) | (747) | (353) | −52.7% |
| Operating income | 2,652 | 2,631 | 2,366 | −10.1% |
| Net income | 1,983 | 1,890 | 1,664 | −12.0% |
| Earnings per share (€) | 2.77 | 2.65 | 2.36 | −0.29 |
| Net income as % of sales | 7.0% | 7.0% | 6.4% | −0.6 pts |
Revenue breakdown
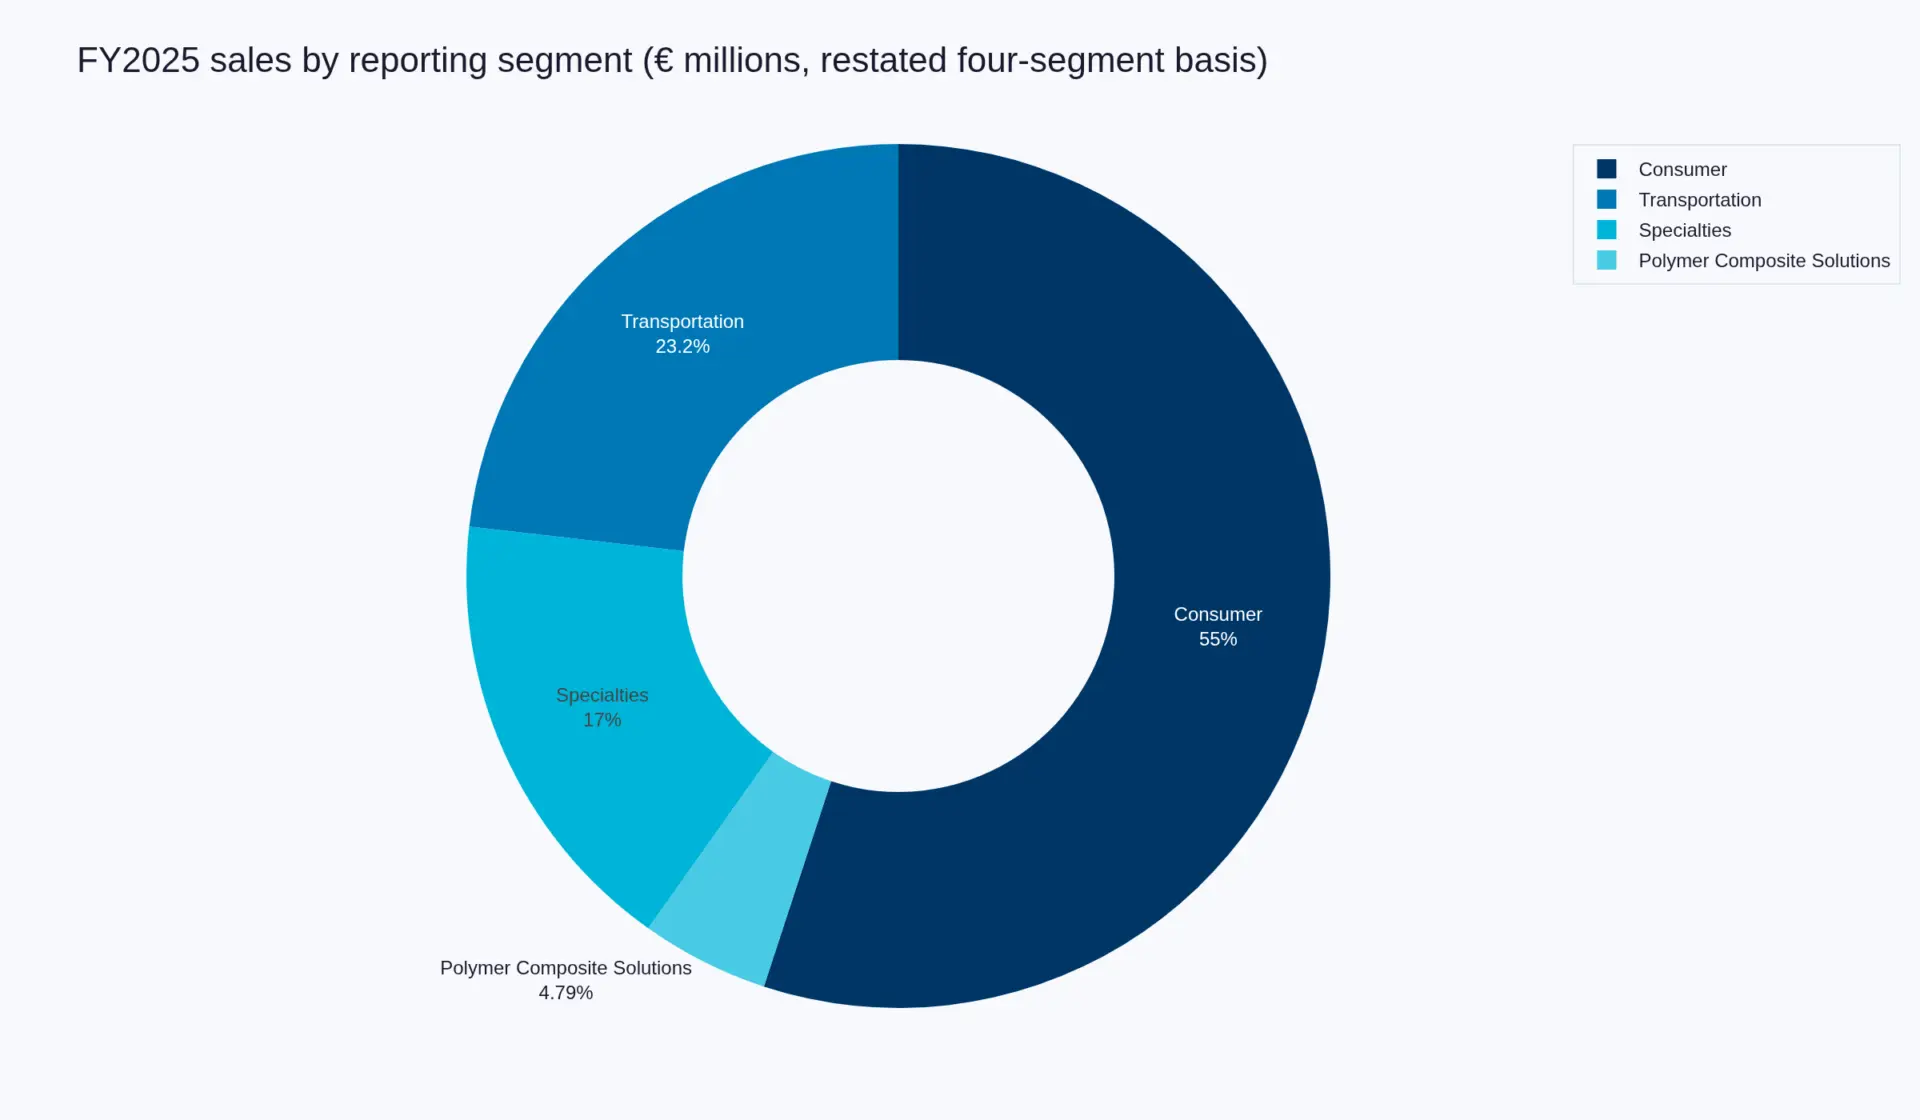
On the restated four-segment basis for 2025, Consumer is 55% of group sales and 62% of segment operating income; Transportation is 23% of sales but only 10% of profit; Specialties contributes 17% of sales and 21% of profit; and Polymer Composite Solutions is 5% of sales and 7% of profit at the highest margin in the group. Tyre and related-distribution sales together were €24,747m, or 95.21% of the group total, with €1,245m coming from non-tyre polymer composites.
| Segment | Sales 2025 | Share of sales | SOI 2025 | Margin | Share of SOI |
|---|---|---|---|---|---|
| Consumer | 14,306 | 55.0% | 1,677 | 11.7% | 61.7% |
| Transportation | 6,023 | 23.2% | 280 | 4.7% | 10.3% |
| Specialties | 4,418 | 17.0% | 577 | 13.1% | 21.2% |
| Polymer Composite Solutions | 1,245 | 4.8% | 186 | 14.9% | 6.8% |
| Group | 25,992 | 100.0% | 2,719 | 10.5% | 100.0% |
Profitability analysis
The 2025 decline in segment operating income (−€659m) decomposes almost exactly into volume loss against price and mix gain. Volumes removed €719m, price added €365m and mix added €380m, with higher raw-material costs taking a further €228m in the first part of the year before easing in the second half. The mix gain is the part of the model the group controls: 18-inch and larger MICHELIN-brand tyres, premium brand positioning and a managed balance between Replacement and Original Equipment.
| Driver | Effect | Group commentary |
|---|---|---|
| Segment operating income 2024 | 3,378 | 12.4% of sales |
| Volumes | (719) | Low OE output, particularly truck and beyond-road in North America; capacity under-utilisation |
| Price | +365 | Indexation clauses, EUDR-related revisions, customs tariffs, OE contract renegotiation |
| Mix | +380 | MICHELIN brand, 18-inch and larger, geographic and channel mix |
| Raw materials and other | (228) | Weighted to the first half; natural rubber and butadiene eased later in the year |
| Segment operating income 2025 | 2,719 | 10.5% of sales (−1.9 pts) |
Latest nine months and financial position
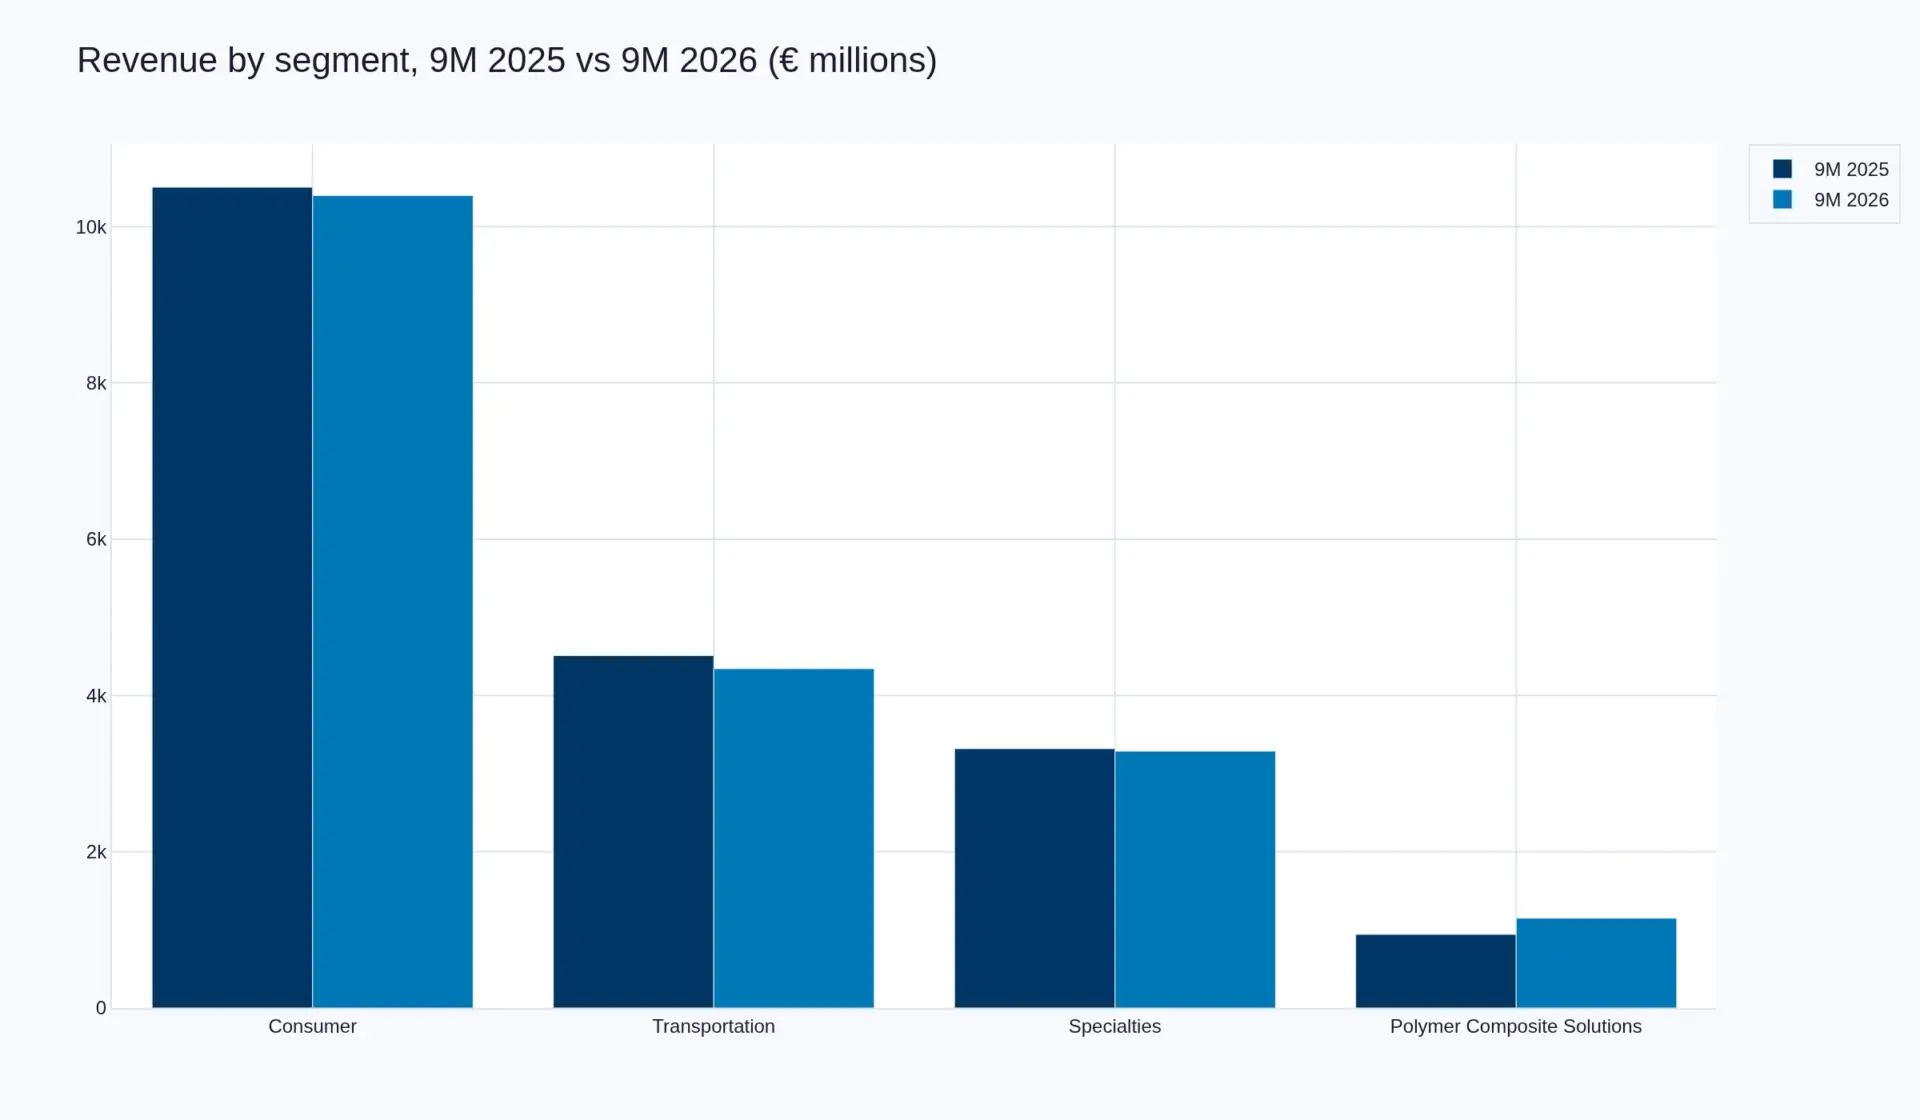
Nine-month 2026 revenue of €19,175m was 0.5% below the prior year as reported, held back by a €300m (−1.6%) currency effect concentrated in the first half. At constant exchange rates revenue grew 1.0%, and at constant exchange rates and scope 0.1%. Scope added 0.9% (€179m) from the Cooley Group and Flexitallic acquisitions in the first half and TexTech from 1 July 2026, partly offset by the 2025 divestment of the compact line activities. Tire volumes were 0.8% lower overall, but MICHELIN-brand replacement volumes were up 4% at the end of September.
| Segment | 9M 2025 | 9M 2026 | Change | Driver disclosed |
|---|---|---|---|---|
| Consumer | 10,504 | 10,397 | −1.0% | Volumes +0.5%; two-wheel and MICHELIN-brand replacement offsetting weak OE and Tier 2/3 brands; Q3 +2.2% |
| Transportation | 4,510 | 4,342 | −3.7% | Volumes −1.5%; North America OE recovering on Class 8 orders, South America OE weaker; Q3 +1.7% |
| Specialties | 3,318 | 3,287 | −0.9% | Mining supportive, aircraft solid, beyond-road OE still depressed; Q3 +2.2% |
| Polymer Composite Solutions | 942 | 1,149 | +21.9% | Acquisitions the main driver; organic −2.7% with conveyors the drag |
| Group | 19,275 | 19,175 | −0.5% | +1.0% at constant FX; Q3 revenue €6,488m |
| Metric | 2023 | 2024 | 2025 |
|---|---|---|---|
| Net debt (€m) | 3,281 | 3,112 | 2,345 |
| Gearing | 18.3% | 16.7% | 13.0% |
| Free cash flow (€m) | 2,343 | 2,225 | 2,181 |
| Free cash flow before M&A (€m) | 3,009 | 2,225 | 2,126 |
| Dividend per share (€) | 1.35 | 1.38 | 1.38 |
| Effective tax rate | 20.4% | 22.7% | 26.3% |
| Dividend of €1.38 per share proposed for 2025. A buyback of up to €2.0bn over 2026–2028 was announced on 11 February 2026; the 2026 tranche is €750m and more than 80% had been executed by 20 October 2026. | |||
SWOT Analysis
Recent Developments
Strategic moves
| Date | Development |
|---|---|
| Q3 2025 | Divestment of the compact line activities (tyres and tracks for small construction equipment), reducing Construction exposure in Specialties. |
| 2025 | Closure of the Karlsruhe plant in Germany as part of the capacity adjustment programme; employees on payroll fall 5.5% to 122,600. |
| January 2026 | Reporting reorganised from three to four segments, with Polymer Composite Solutions carved out of Specialties and the remaining segments renamed Consumer and Transportation; 2025 comparatives restated. |
| H1 2026 | Cooley Group (Rhode Island; coated fabrics for waterproofing, healthcare, containment) and Flexitallic (Texas; sealing technology for chemical, energy and industrial customers) consolidated. |
| 1 July 2026 | TexTech Industries (North Carolina; specialty textiles and coatings for aerospace, space, defence and automotive) consolidated, completing the three-acquisition programme. |
| May 2026 | French voluntary-departure scheme announced, covering up to 1,500 positions over three years, two-thirds in support functions (mainly Clermont-Ferrand) and one-third in industry. |
| 13 Nov 2026 | CFDT, Sud and CFE-CGC sign the GEPP collective agreement covering the scheme; CGT does not sign. The agreement takes effect on 1 January 2027 for three years and provides for a 12–15 month mobility leave, support for business creation and end-of-career arrangements. |
| November 2026 | Former Karlsruhe site sold to the developer Aurelis, which plans more than 74,000 m² of production and logistics space under the “Profilwerk Karlsruhe” name; demolition from late 2026, construction from 2027, completion targeted for 2029. |
Financial developments
| Date | Development |
|---|---|
| 11 Feb 2026 | FY2025 results: sales €25,992m, segment operating income €2,719m, net income €1,664m, free cash flow before M&A €2,126m. Reuters reported segment operating income above the €2.7bn company-compiled consensus and sales above the €25.8bn consensus. |
| 11 Feb 2026 | Dividend held at €1.38 per share; share buyback of up to €2.0bn announced for 2026–2028. 2026 guidance set at growth in segment operating income at iso-forex and iso-scope, and free cash flow before M&A above €1.6bn. |
| 20 Oct 2026 | Nine-month revenue €19,175m (−0.5% reported, +1.0% constant FX); third-quarter revenue €6,488m, up 2.2% at constant exchange rates. |
| 20 Oct 2026 | 2026 guidance confirmed on segment operating income and free cash flow, but the volume outlook was lowered to slightly negative for the year with no fourth-quarter rebound assumed; full-year tyre market ranges narrowed to −1% to +1% for passenger car and light truck, 0% to +2% for truck excluding China, and 0% to +2% for specialties. |
| 20 Oct 2026 | More than 80% of the €750m 2026 buyback tranche executed. Second-half cost inflation quantified at €400m, including €200m of raw materials and €100m of logistics and energy, with full-year raw material relief of €50–100m. |
| 9 Oct 2026 | Company-compiled analyst consensus (11 responses) for FY2026: sales €26,445m and segment operating income €2,826m, implying a 10.7% margin and 3.9% growth on 2025. |
Business Strategy
Global strategy
Michelin in Motion 2030, presented in 2021 and still the group’s stated framework, commits Michelin to targeted growth in tyres while building two adjacent activities — connected solutions and polymer composite materials — that are intended to represent between 20% and 30% of turnover by 2030. The operational logic is that tyres fund and validate the materials and data capabilities, and that those capabilities earn higher margins and less cyclical demand than the tyre cycle itself. The strategy sits inside an “All-sustainable” framework measured on twelve social, societal, financial and environmental indicators.
| Pillar | Stated priority | Number behind it |
|---|---|---|
| Premium and specialty tyres | Concentrate on segments where technology is valued rather than on volume share | 18-inch+ at 68% of MICHELIN-brand car tyres; Specialties margin 13.1% |
| Electric mobility | Use technological leadership to win original-equipment fitment as powertrains electrify | Close to 400 EV homologations across more than 60 brands |
| Connected solutions | Build fleet-management and road-infrastructure data services under MICHELIN Connected Fleet | Connected solutions plus composites targeted at 20–30% of turnover by 2030 |
| Polymer Composite Solutions | Apply materials expertise to mobility, construction, aeronautics, low-carbon energy and healthcare | €450m of acquired 2025 sales at a 17% margin; +35% segment revenue |
| Sustainable materials | Reduce life-cycle impact across the product rather than at a single stage | 40% renewable or recycled materials by 2030; 100% by 2050 |
Focus-market strategy
At market level the group is running two different plays at once. In Consumer it protects price and mix and accepts volume loss in Tier 2 and Tier 3 brands rather than chase low-priced imports, which is why a 1.0% revenue decline came with a 0.5% volume increase over nine months of 2026. In Transportation it has launched a comprehensive adaptation plan covering industrial capacity, faster product-range renewal and connected solutions — a response to a North American truck market that shrank 20% in 2025 and where the recovery is now arriving through Class 8 orders rather than through replacement demand. In Specialties the growth is where the cycle is: mining and aircraft, not agriculture or construction.
| Market | 9M revenue | Change | Stated approach and driver |
|---|---|---|---|
| Consumer | €10,397m | −1.0% | Hold price and mix; MICHELIN-brand replacement volumes +4%; 18-inch+ outperformance; new Primacy 5 Energy range; China growing in a contracting market |
| Transportation | €4,342m | −3.7% | Adaptation plan: right-size capacity, renew ranges, push connected fleet services; North America OE recovering, South America OE weak |
| Specialties | €3,287m | −0.9% | Mining supportive across key segments, aircraft solid; beyond-road OE depressed, agriculture in North America not expected to recover before 2027 |
| Polymer Composite Solutions | €1,149m | +21.9% | Buy and integrate: three bolt-ons in 2026; all categories growing organically except conveyors |
What the Pheonix base adds
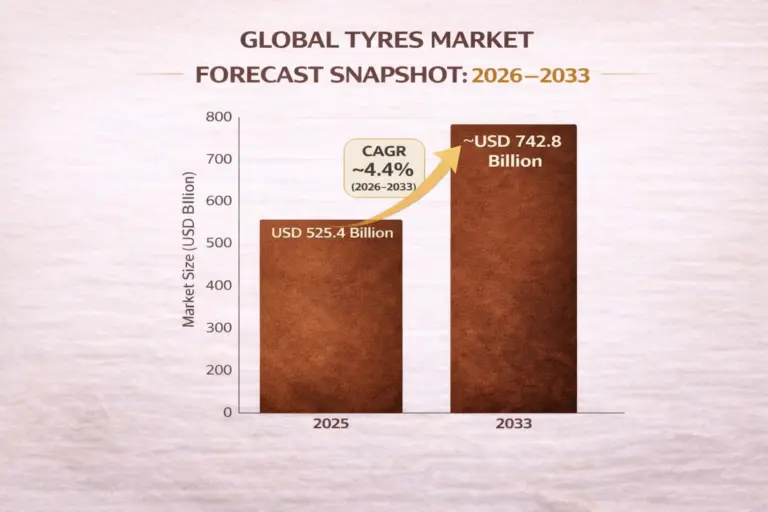
Michelin does not publish its share of the global tyre market, and the denominators available to it and to us are not the same. On our own base — the Pheonix Global Tyres Market Report, 2026–2033, which sizes the market at US$525.4bn in 2025 rising to US$742.8bn by 2033 at a 4.4% CAGR — Michelin’s €24,747m of tyre and related-distribution sales convert to roughly US$26,727m and imply about 5.1% of that pool.
| Step | Value | Basis |
|---|---|---|
| Tyre and related-distribution sales, FY2025 | €24,747m | Consumer 14,306 + Transportation 6,023 + Specialties, tyre business 4,418 |
| Converted at 1.08 EUR/USD | US$26,727m | Rate implied by the group’s own reported dollar equivalent (€25.99bn ≈ $28.07bn) |
| Pheonix global tyre market, 2025 | US$525,400m | Pheonix Research model, 2025 base year |
| Implied share | 5.09% | Read as an order of magnitude, not a measurement |
The comparability note matters more than the number. Michelin’s sales are recorded at manufacturer and distributor selling prices; our market base is a value pool that includes the distribution and retail layers the group consolidates only partially. The two are not the same measurement, and the 5.1% should be read as a share of a broader value pool than the group’s own revenue address — which is why it sits below the ten-point-plus shares some sources attribute to the group on narrower replacement-tyre bases.
Data status
Plant counts and country coverage are not disclosed by the group in its 2025 results communication, so no site total is presented here; France is the only country with a disclosed site count in the current period. The graph record for this entity carries a localised website URL (michelin.in) in its link field rather than the group’s corporate site; the identity binding to Q151107 is unaffected. Segment comparisons across 2023–2025 use the restated four-segment basis published in January 2026, which differs from the three-segment figures the group reported at the time.
Sources
- Michelin, Financial information at December 31, 2025, 11 February 2026 — michelin.com
- Michelin, 2025 Universal Registration Document and 2025 annual results guide — consolidated income statement, segment analysis, employee data
- Michelin, Restatement of 2025 segment reporting after creation of the Polymer Composite Solutions reporting segment, January 2026
- Michelin, Financial information for the nine months ended September 30, 2026, 20 October 2026
- Michelin, Q3 2026 pre-close call script for sell-side analysts, 1 October 2026 — tyre market ranges and supply-chain commentary
- Michelin, Michelin in Motion 2030 strategy page — portfolio targets, EV homologations, materials targets
- Michelin, Analyst consensus, last updated 9 October 2026 — FY2026 sales and segment operating income consensus
- Reuters, Michelin profit hit by US slowdown, sees rebound in 2026, 11 February 2026 — consensus comparison
- Tire Review, Michelin 2025 Earnings and Financial Results, 13 February 2026 — reported dollar equivalents
- 20 Minutes / AFP, Michelin: le plan prévoyant 1 500 départs volontaires sur trois ans entériné par plusieurs syndicats, 13 November 2026 — French headcount and site count, GEPP terms
- auto.news, Drittes Quartal stabilisiert Neunmonatszahlen von Michelin, 23 October 2026 — sale of the Karlsruhe site to Aurelis
- Pheonix Research, Global Tyres Market Report, Size and Forecast 2026–2033 — US$525.4bn (2025) to US$742.8bn (2033), 4.4% CAGR
- Wikidata, Q151107 — entity identity verified 13 November 2026
Provenance
This profile is bound to Wikidata entity Q151107 and to Pheonix graph entity MIEN-node_b3a98f14. All company figures are taken from Michelin’s own reported results for FY2023–FY2025 and for the nine months ended 30 September 2026, restated onto the four-segment basis the group adopted in January 2026. Market-size inputs are from Pheonix Research’s own tyre market model and are used only in the implied-share illustration, which is labelled as such. Identity, segment structure and all figures last verified on 13 November 2026.
Market Presence
Michelin is mentioned across 34 market reports.
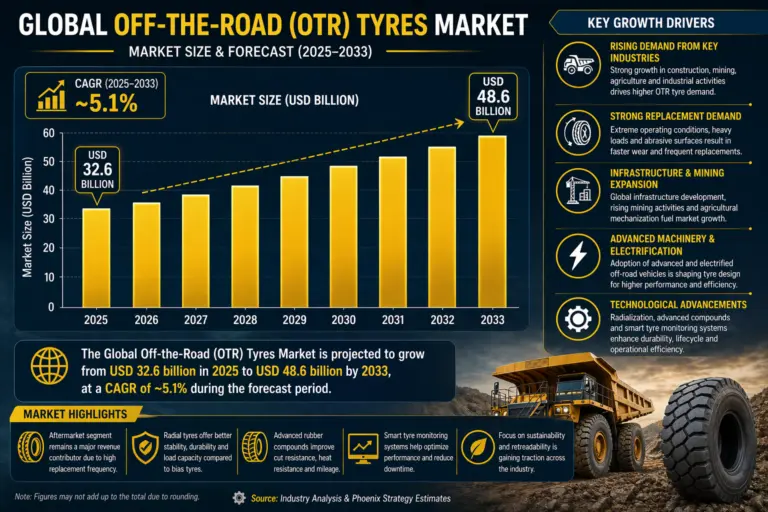
Global Off-the-Road (OTR) Tyres Market Report Size and Forecast 2026-2033
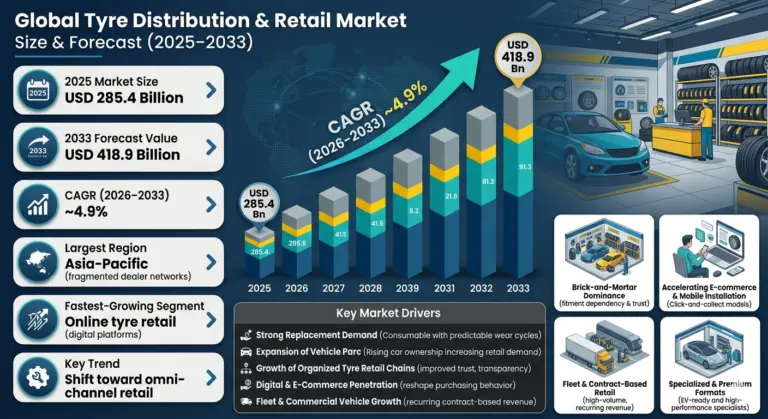
Global Tyre Distribution & Retail Market Size, Share & Forecast 2026-2033
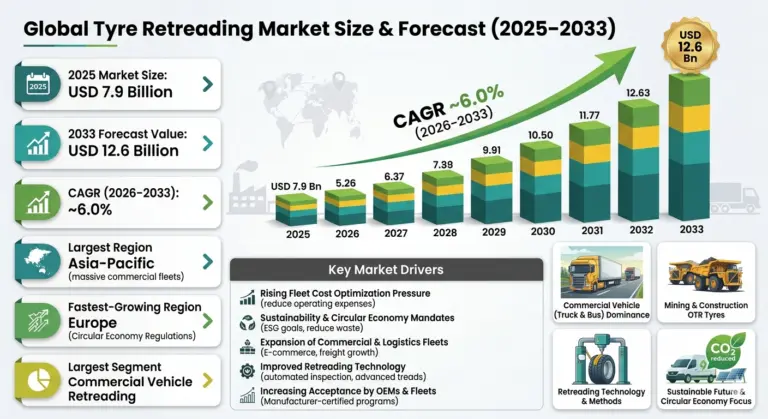
Global Tyre Retreading Market size , share & Forecast 2026-2033
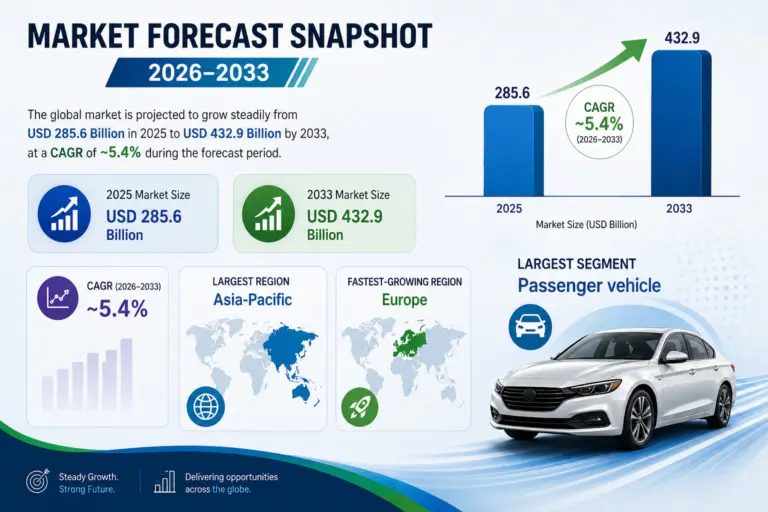
Global Tyre Replacement Market size, share & Forecast 2026-2033
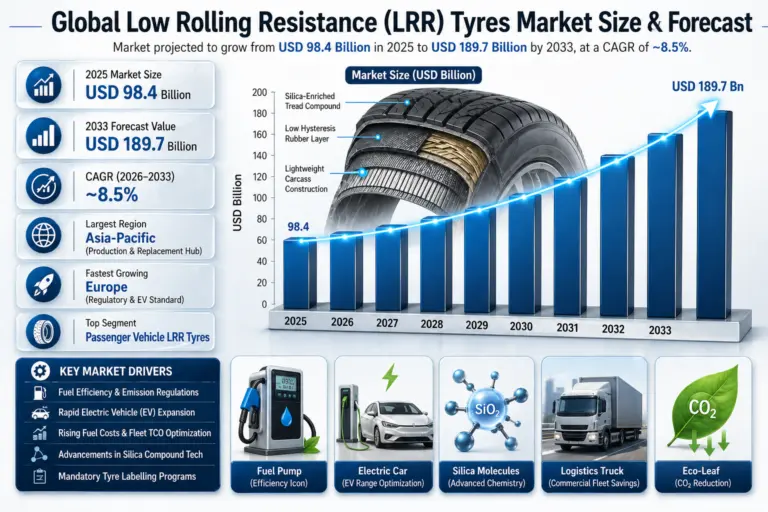
Global Low Rolling Resistance Tyres Market size, share & forecast 2026-2033
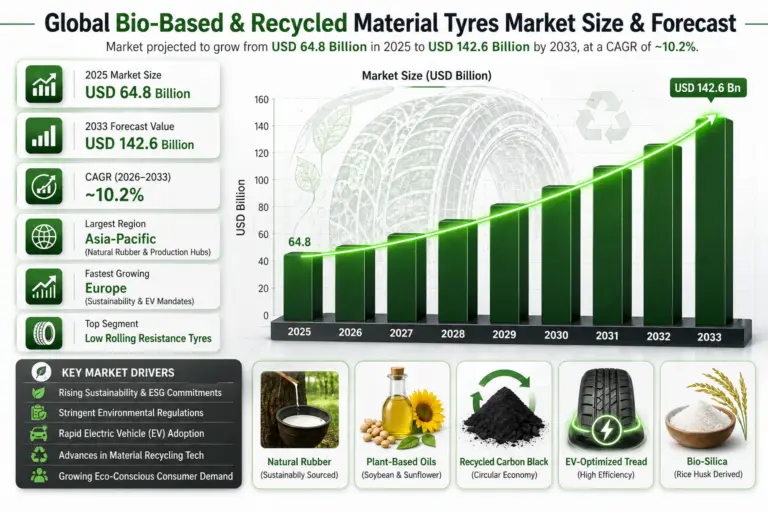
Global Bio-Based & Recycled Material Tyres Market size , share & forecast 2026-2033
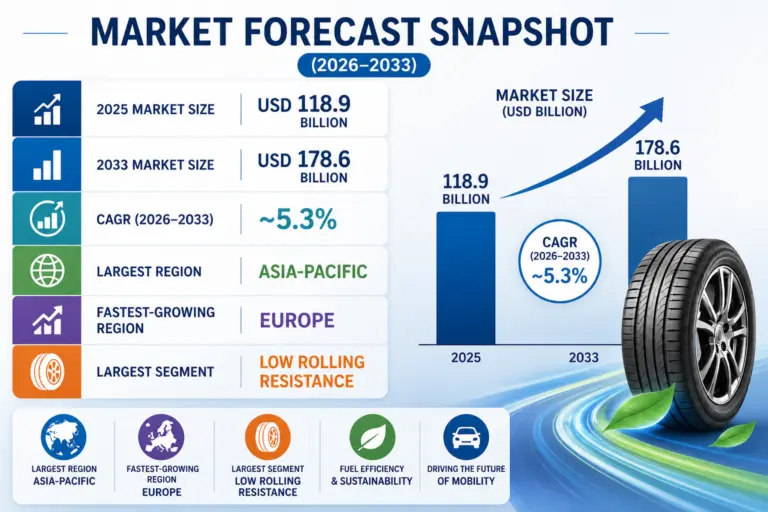
Global Sustainable & Green Tyres Market size, Share & Forecast 2026-2033
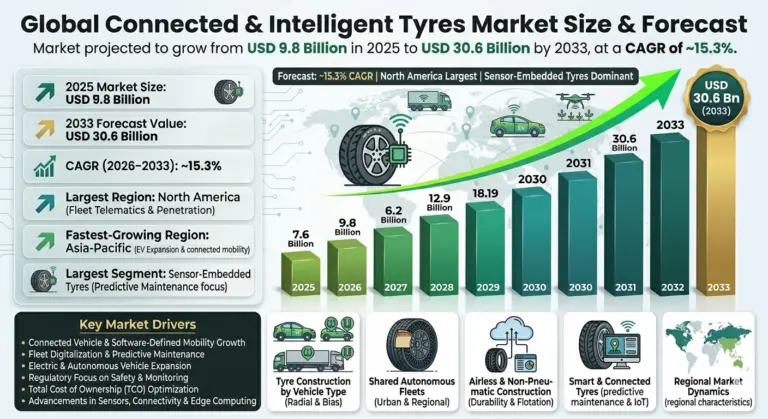
Global Connected & Intelligent Tyres Market size, share & forecast 2026-2033
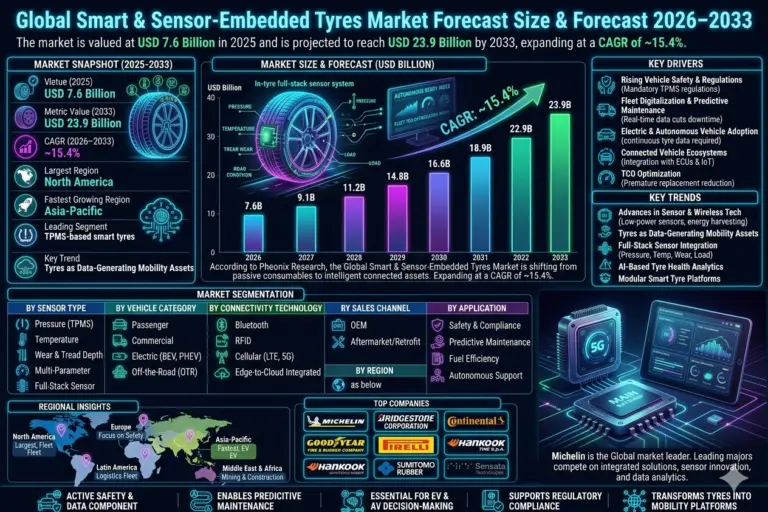
Global Smart & Sensor-Embedded Tyres size and share Analysis 2026-2033
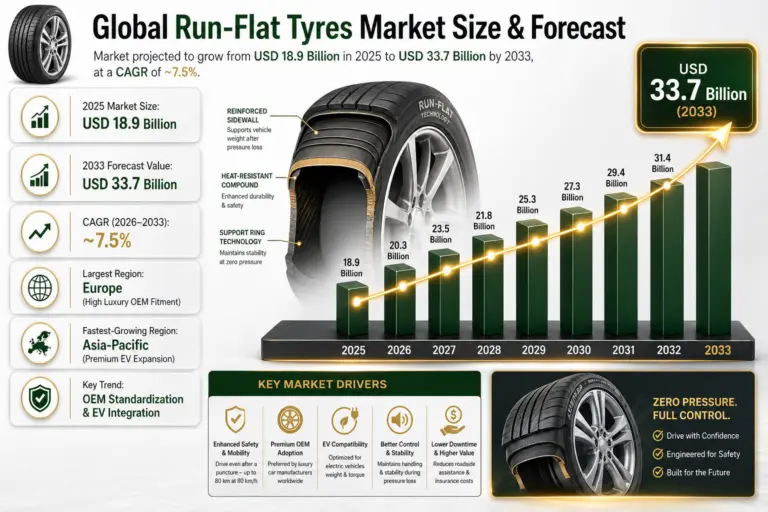
Global Run-Flat Tyres Market size , share & Analysis 2026-2033
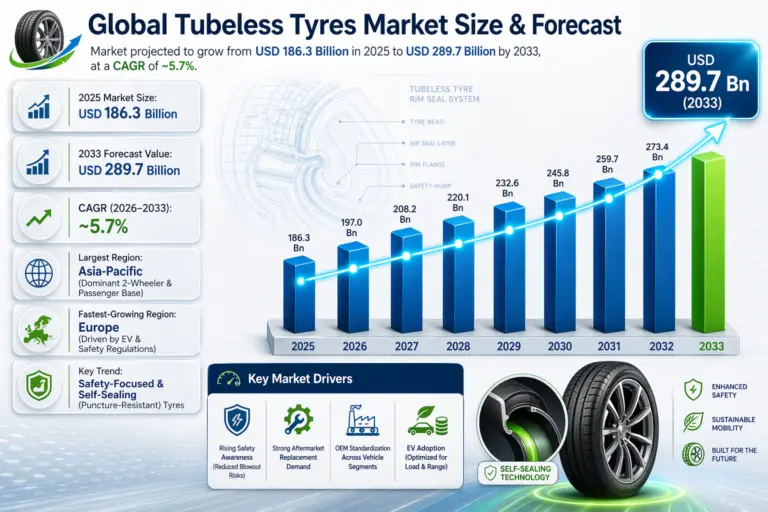
Global Tubeless Tyres Market size, share & forecast 2026-2033
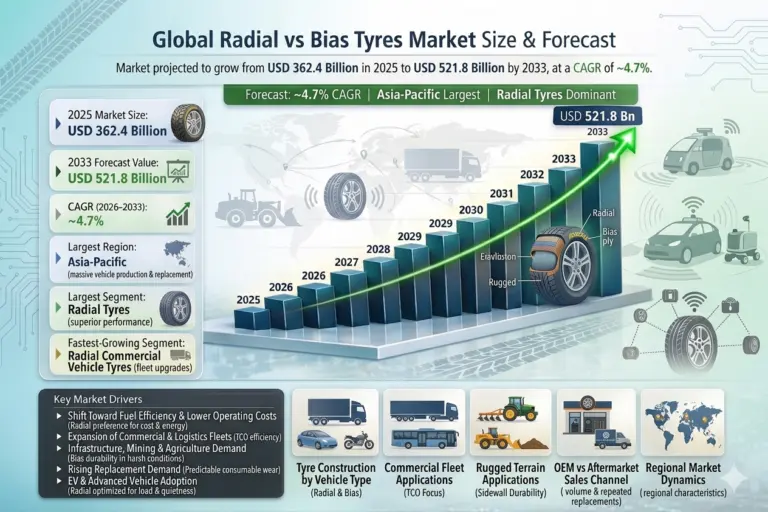
Global Radial vs Bias Tyres Market size , share & forecast 2026-2033
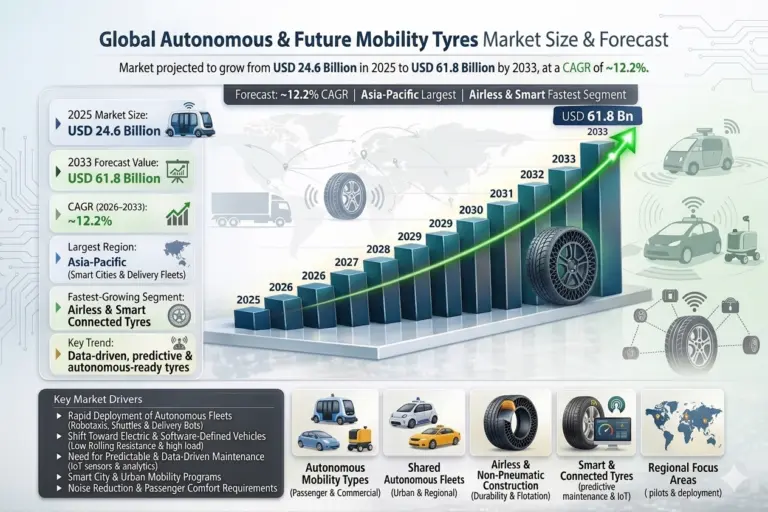
Global Autonomous & Future Mobility Tyres Market size,share & forecast 2026-2033
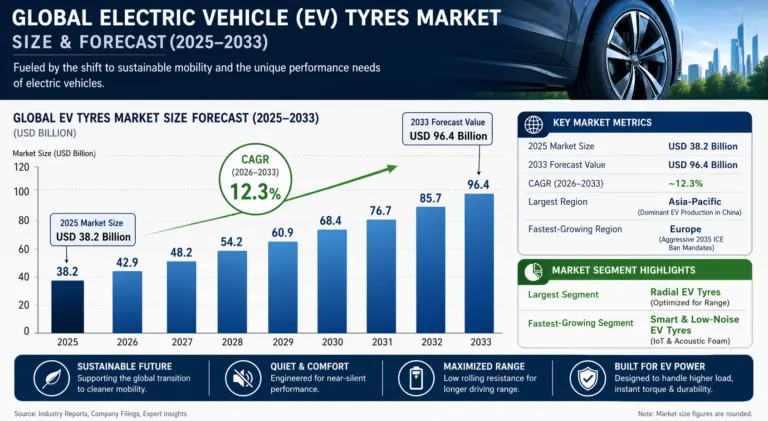
Global Electric Vehicle (EV) Tyres Market Size, share & forecast 2026-2033
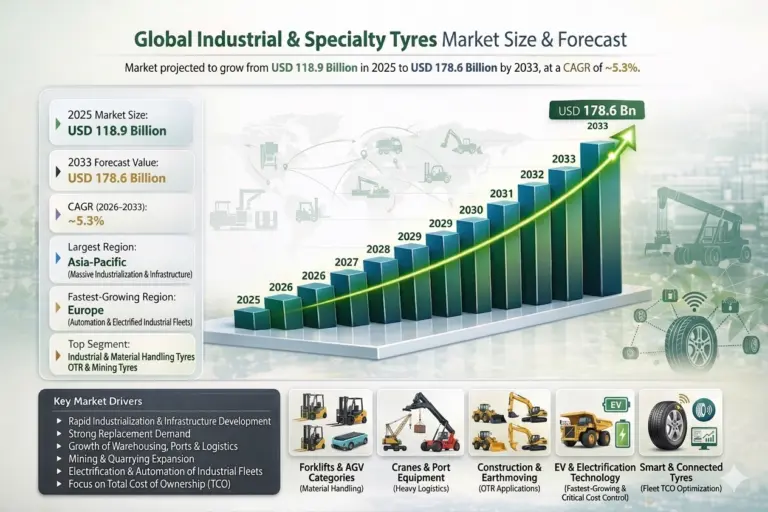
Global Industrial & Specialty Tyres Market size, share & forecast 2026-2033
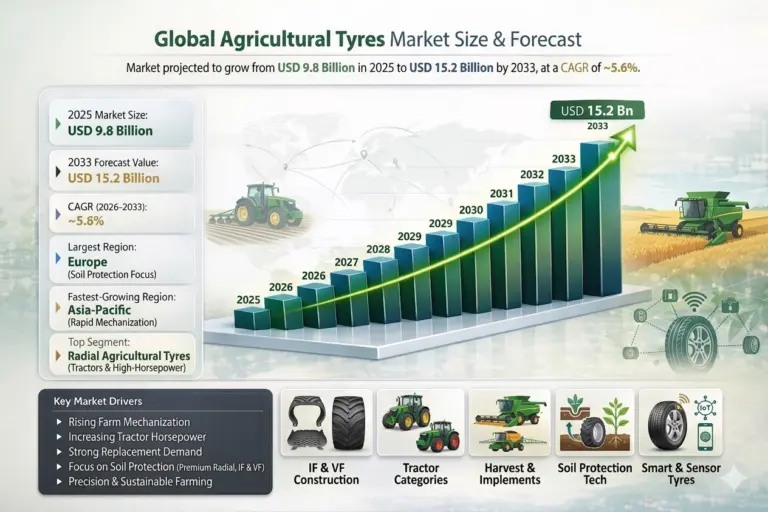
Global Agricultural Tyres Market size, share & forecast 2026-2033
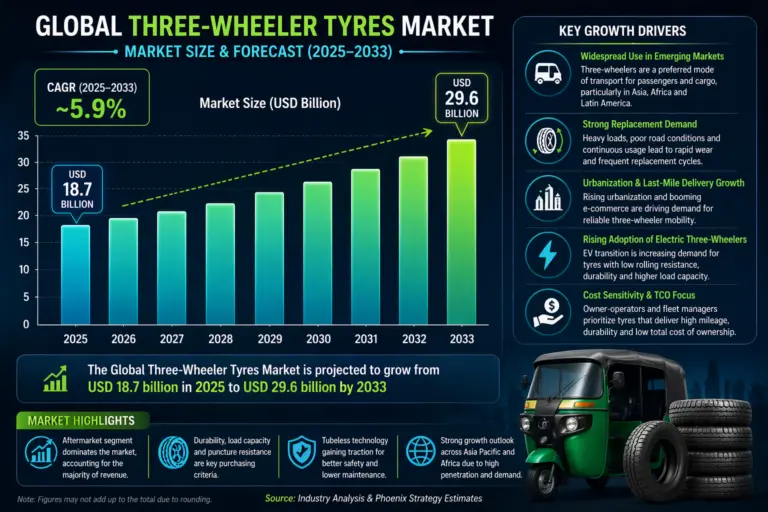
Global Three-Wheeler Tyres Market Report Size and Forecast 2026-2033
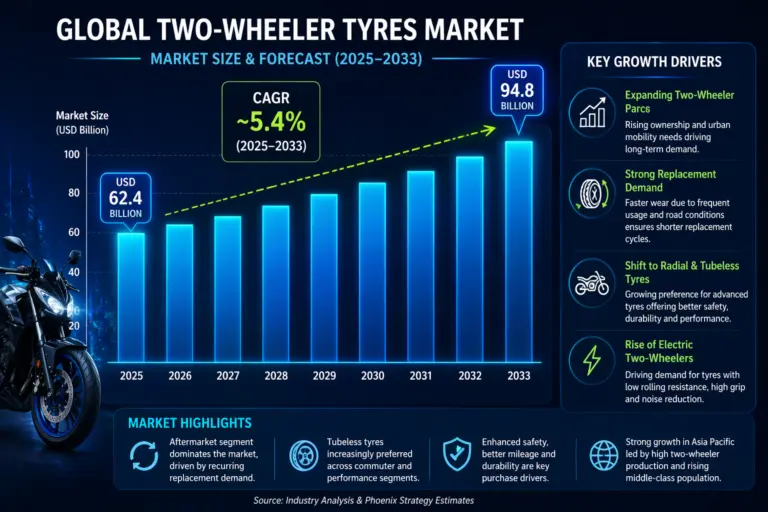
Global Two-Wheeler Tyres Market Report Size and Forecast 2026-2033
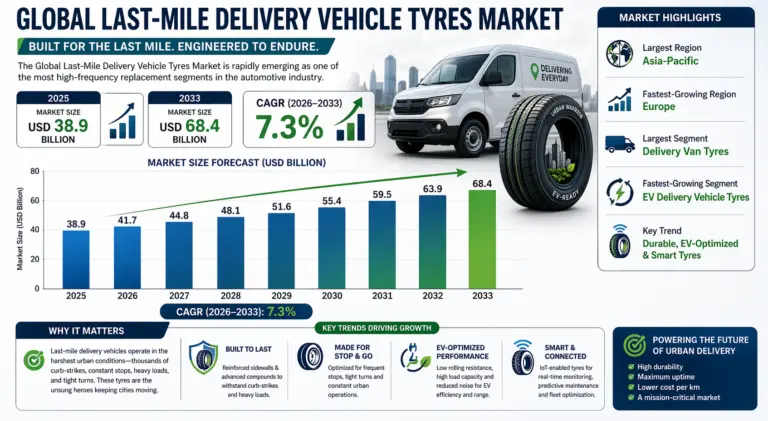
Global Last-Mile Delivery Vehicle Tyres Market Size, share & forecast 2026-2033
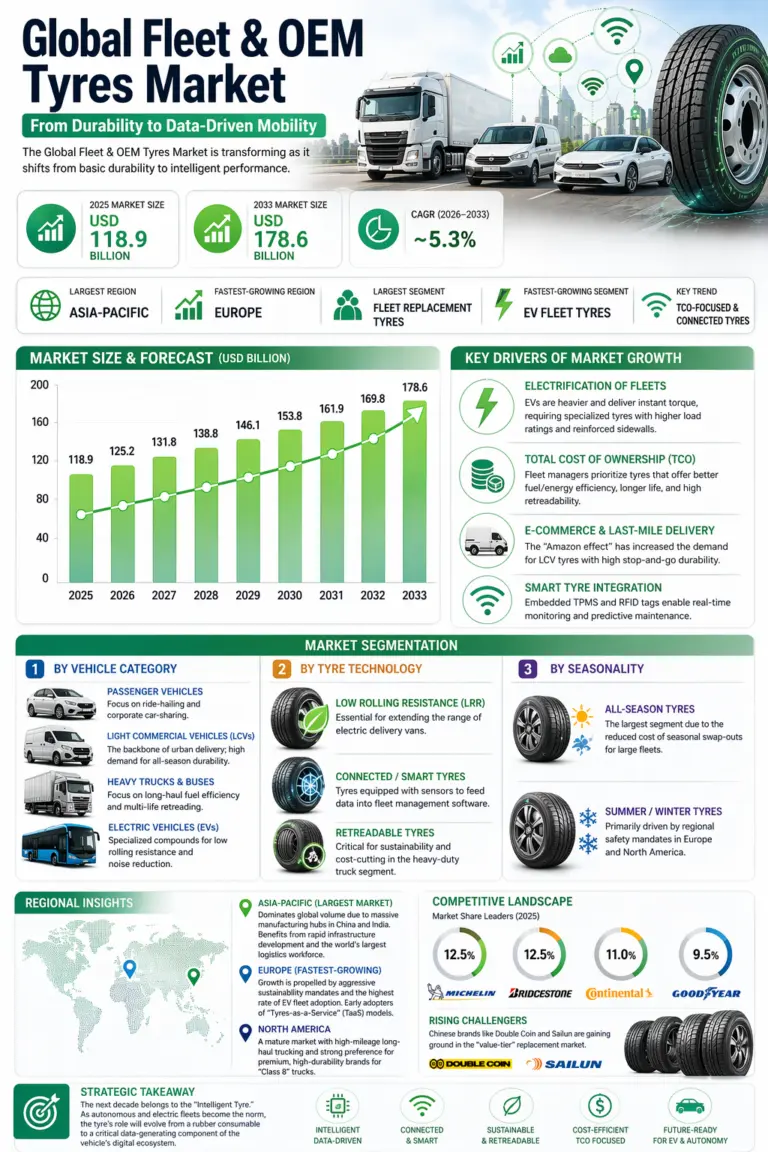
Global Fleet & OEM Tyres Market size, share & forecast 2026-2033
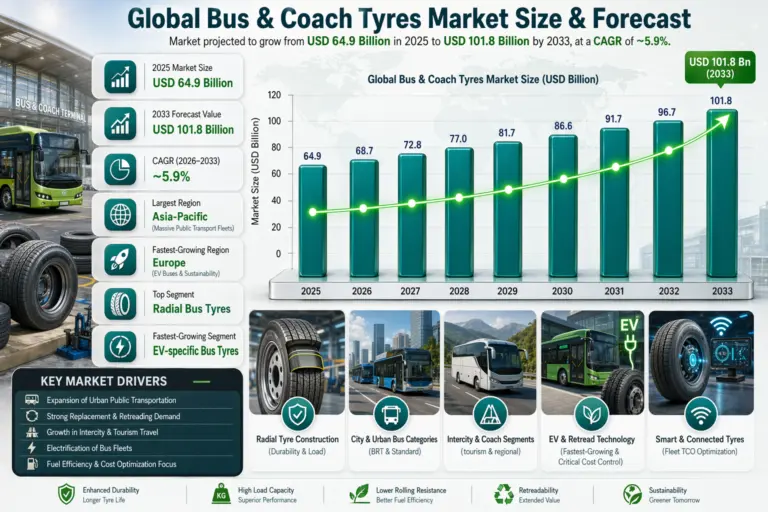
Global Bus & Coach Tyres Market size, share & forecast 2026-2033
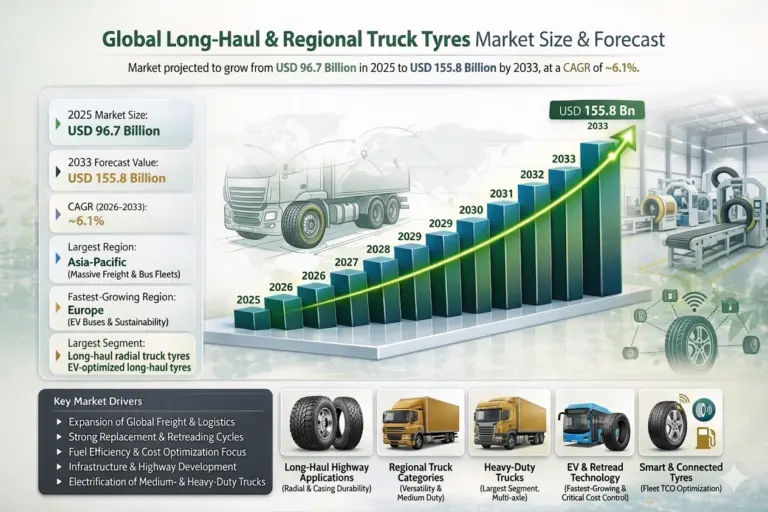
Global Long-Haul & Regional Truck Tyres Market size, share & forecast 2026-2033
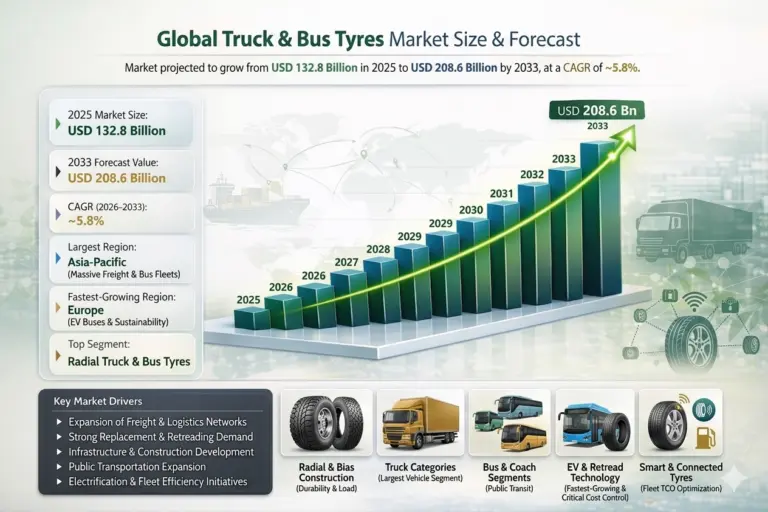
Global Truck & Bus Tyres Market size, share & forecast 2026-2033
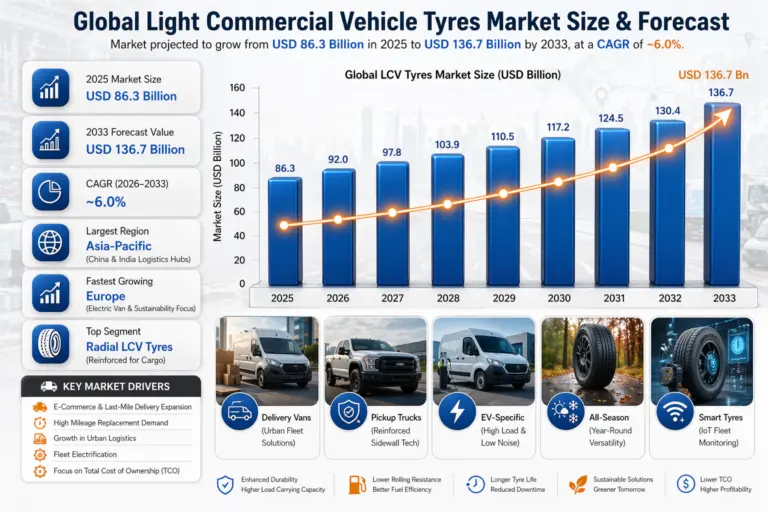
Global Light Commercial Vehicle Tyres Market size and share Analysis 2026-2033
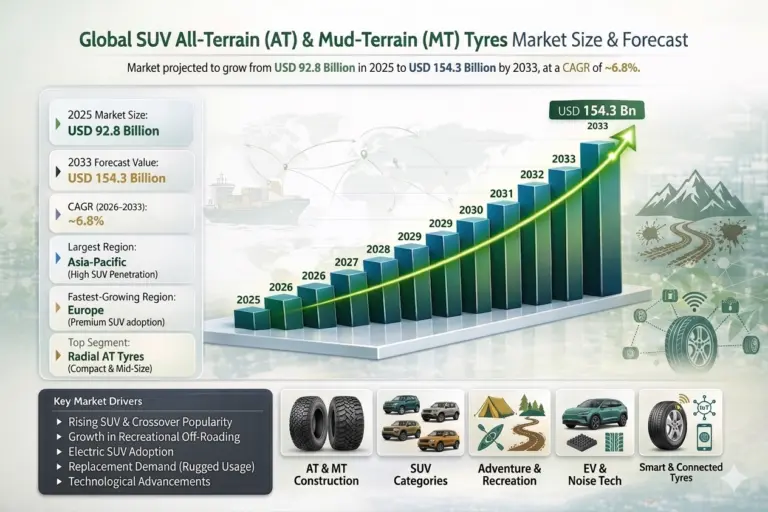
Global SUV All-Terrain (AT) & Mud-Terrain (MT) Tyres Market size and share Analysis 2026-2033
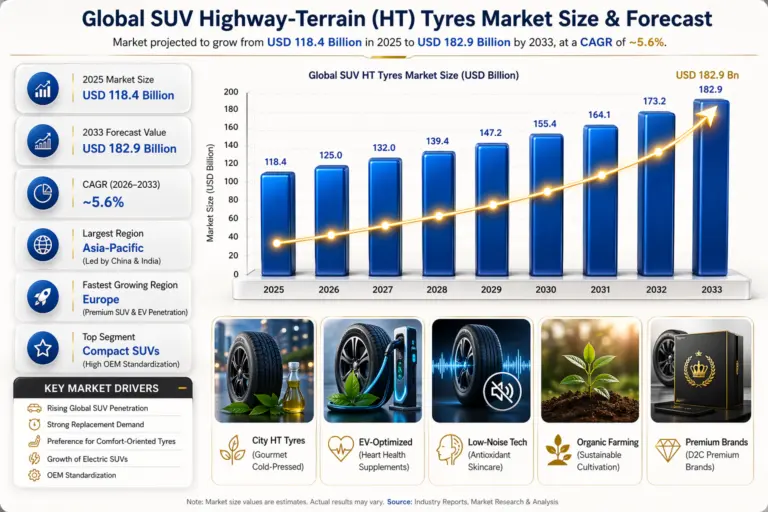
Global SUV Highway-Terrain (HT) Tyres Market size and share Analysis 2026-2033
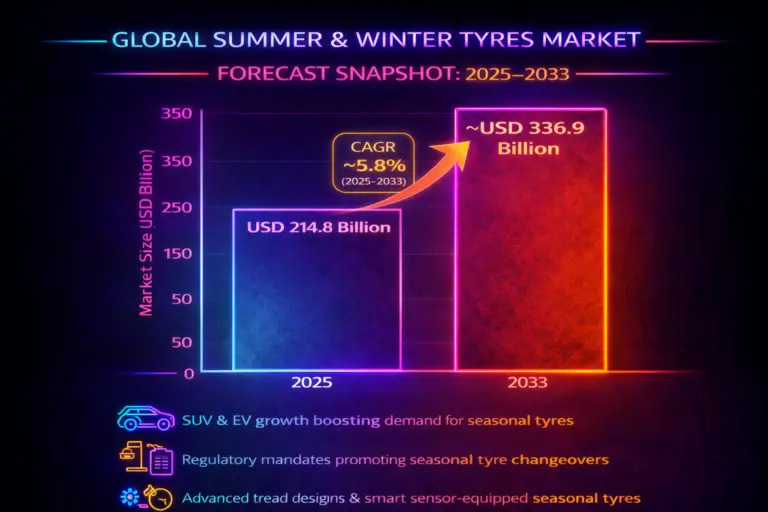
Global Summer & Winter Tyres Market Report, Size and Forecast 2026 -2033
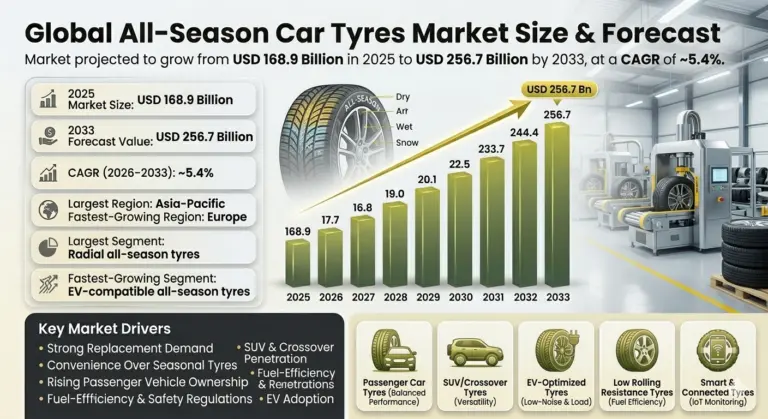
Global All-Season Car Tyres Market size and share Analysis 2026-2033
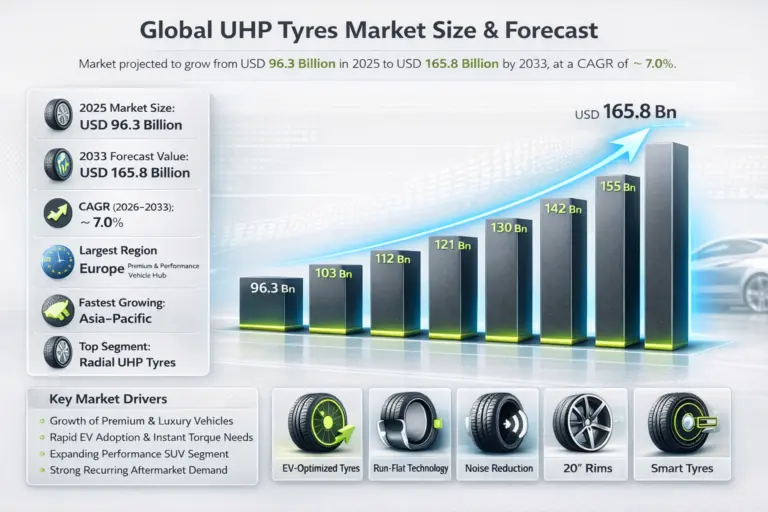
Global Ultra-High Performance (UHP) Tyres Market size and share Analysis 2026-2033
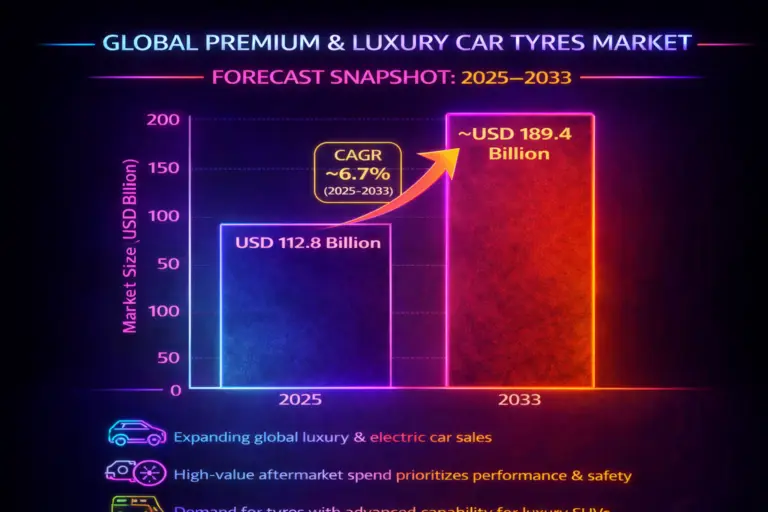
Global Premium & Luxury Car Tyres Market Report, Size and Forecast 2026 – 2033
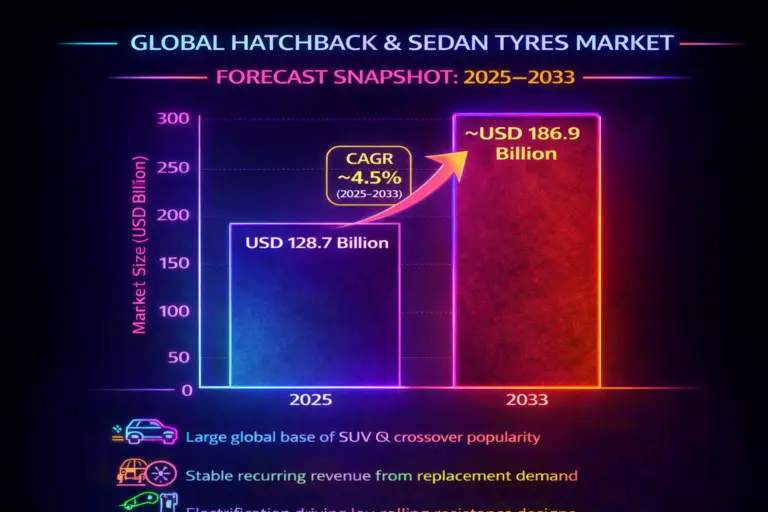
Global Hatchback & Sedan Tyres Market Report, Size and Forecast 2026 – 2033
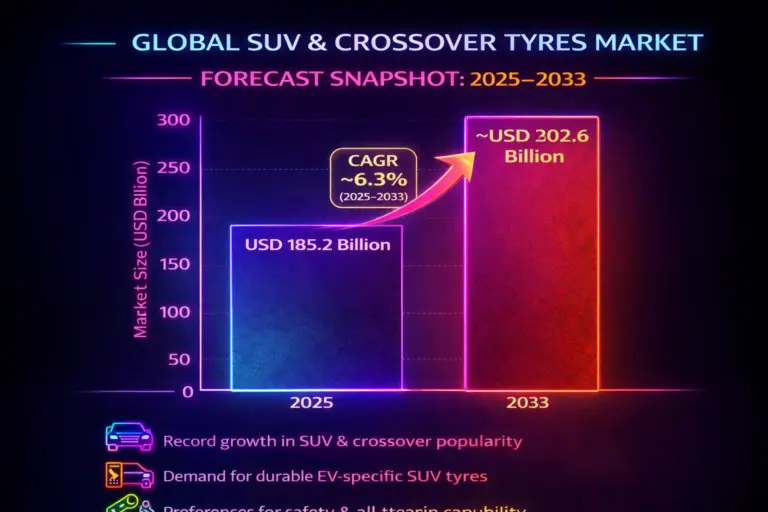
Global SUV & Crossover Tyres Market Report, Size and Forecast 2026- 2033
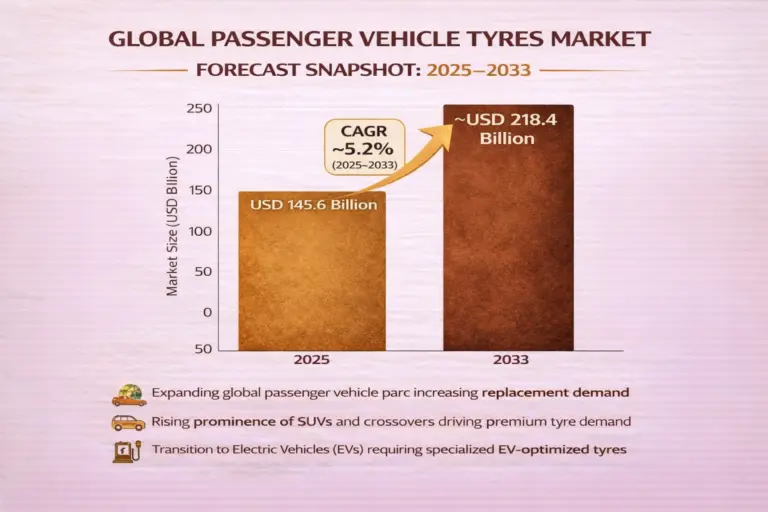
Global Passenger Vehicle Tyres Market Report, Size and Forecast 2026-2033