
Company Profile
BYD Company Limited
BYD Company Limited is a Shenzhen-headquartered manufacturer of new energy vehicles and batteries, and the world’s second-largest supplier of electric-vehicle batteries. In full-year 2025 it installed 194.8 GWh of EV batteries for a 16.4% global share, behind CATL’s 39.2%; the two Chinese suppliers together accounted for 55.6% of a 1,187 GWh market. Beyond vehicles and cells, BYD Energy Storage is one of the largest battery-energy-storage integrators in the world, and the group operates the largest self-built ultra-fast charging network in China.
Two things changed in 2026. The first is financial: revenue in full-year 2025 grew 3.46% to RMB 803.97 billion while net profit attributable to shareholders fell 19% to RMB 32.62 billion, as gross margin narrowed to 17.74% from 19.44% under a domestic price war. The second is geographic: battery installations in China fell 7.1% in the first nine months of 2026 while installations outside China rose 66.8%, and for the first time more than half of group revenue came from overseas markets in the first half.
Reference data
| Legal name | BYD Company Limited (比亞迪股份有限公司) |
| Graph entity name | BYD Company Ltd |
| Listing | SZSE: 002594 · HKEX: 1211 (HKD counter) and 81211 (RMB counter) |
| Headquarters | Shenzhen, Guangdong, China |
| Chairman | Wang Chuan-fu |
| Fiscal year | Calendar year (to 31 December) |
| Core businesses | New energy vehicles; EV batteries and power electronics (FinDreams); energy storage systems; flash-charging infrastructure; mobile handset components and assembly |
| Official website | byd.com |
| Wikidata | Q2608329 |
| Pheonix entity ID | MIEN-node_80af04fa |
| Pheonix segments | Electric Vehicle (EV) · Automotive Electrical Systems |
Executive summary
BYD occupies two positions at once in the electric-vehicle value chain: it is one of the largest vehicle manufacturers in the world by new energy vehicle volume, and through its in-house battery business it is the number two cell supplier globally. That combination — a captive cell supply feeding a captive vehicle programme, plus a merchant business selling cells, storage systems and charging hardware to third parties — is the defining structural feature of the company. In 2025, its 194.8 GWh of EV battery installations equated to roughly one in six kilowatt-hours deployed in electric vehicles worldwide.
Both halves of that position are now being re-priced by geography. Domestic volume is contracting: BYD’s EV sales in China fell 32.9% year on year in the first nine months of 2026, its Chinese battery installations fell 7.1% to 104.9 GWh, and its PHEV sales were down 11.02% year to date through October. Overseas volume is doing the opposite — installations outside China rose 66.8% to 45.9 GWh, exports reached a record 550,704 units in the third quarter alone, and CLSA’s estimate puts profit per vehicle abroad at roughly ten times the domestic figure. Revenue in the third quarter grew 13.59% and net profit 28.08%, breaking a four-quarter run of profit declines.
Key highlights
- A flat top line and a thinner margin. Full-year 2025 revenue of RMB 803.97 billion grew 3.46% while net profit fell 19% to RMB 32.62 billion; the group’s net margin went from 5.18% to 4.06% in a single year, and to 3.94% over the first nine months of 2026.
- The third quarter was the turn. Revenue of RMB 221.49 billion (+13.59%) and net profit of RMB 10.02 billion (+28.08%) broke four consecutive quarters of profit decline; the quarter’s own net margin of 4.52% is above the nine-month average of 3.94%.
- Share slipped because vehicles slipped. Battery installations of 150.9 GWh in January–September 2026 were up 7.4%, against a market up 19.7%; the share loss from 16.9% to 15.2% traces to a 32.9% fall in China EV sales, not to loss of external cell customers.
- Overseas is now the profit centre. Exports reached 550,704 units in the third quarter (+137%) and 170,194 in October alone; CLSA estimates BYD earns roughly ten times more net profit per vehicle abroad than in China and that 80–90% of earnings are now generated outside the country.
- Storage is the fastest-moving position. BYD Energy Storage ranked fourth among global integrators for full-year 2025 in Wood Mackenzie’s inaugural ranking, then first in H1 2026 with a 9.1% share and shipments up 96.6%.
Market position
The global EV battery market was worth USD 91.7 billion in 2025 on Pheonix’s model and is forecast to reach USD 369.5 billion by 2033, a 19.03% CAGR; the surrounding vehicle markets are larger still, with the global EV market estimated at USD 892.6 billion in 2025 growing to USD 2.41 trillion by 2033 (13.25% CAGR) and the new energy vehicle market moving from USD 1.34 trillion to USD 3.28 trillion over the same window.
Within that, concentration at the top of the cell-supply stack is the defining feature. Ten suppliers accounted for all but 10.5% of 2025 installations, and the top two accounted for more than half.
| Supplier | Global share, FY2025 | Installations (GWh) | Global share, Jan–Sep 2026 |
|---|---|---|---|
| BYD | 16.4% | 194.8 | 15.2% |
| CATL | 39.2% | 464.7 | 39.1% |
| LG Energy Solution | 9.2% | 108.8 | 8.2% |
| CALB | 5.3% | 62.8 | 5.0% |
| Gotion High-tech | 4.5% | 53.5 | 5.1% |
| SK On | 3.7% | 44.5 | 2.8% |
| Panasonic | 3.7% | 44.2 | 3.6% |
| Eve Energy | 2.6% | 31.3 | 3.6% |
| Samsung SDI | 2.4% | 28.9 | — |
| Svolt | 2.4% | 28.5 | 2.6% |
| Rept Battero | — | — | 2.4% |
| Others | 10.5% | 124.9 | 12.3% |
| Total | 100% | 1,187 | 994.5 GWh |
Global EV battery installations. Full-year 2025 market grew 31.7% year on year; the January–September 2026 market grew 19.7% to 994.5 GWh, with a monthly record of 145.1 GWh in September. Source: SNE Research, reported by CnEVPost, February and November 2026.
Geography is the other axis of concentration. Chinese suppliers held more than 70.4% of global installations in 2025 — a first — and in January–September 2026 the seven Chinese firms in the top ten held a combined 73.0%, up 3.5 percentage points year on year. Chemistry followed: lithium iron phosphate reached 81.2% of domestic installations in 2025 (625.3 GWh, +52.9%) while nickel-manganese-cobalt fell to 18.7% (144.1 GWh, +3.7%). BYD’s product line sits almost entirely inside the winning chemistry, which is a structural advantage while LFP remains dominant and a concentration risk if cell chemistry shifts again.
The 2026 share movement is worth reading carefully, because it says less about cell competitiveness than about vehicle demand. Of BYD’s 150.9 GWh, 104.9 GWh went into vehicles sold in China — down from 112.9 GWh — and 45.9 GWh went into vehicles sold outside it, up from 27.5 GWh. SNE Research’s own explanation is that CATL continued to add overseas automaker customers while BYD’s battery supply stayed tied to its own sales, widening the growth gap between the two to 17.5 percentage points.
| BYD battery installations, GWh | Jan–Sep 2025 | Jan–Sep 2026 | Change |
|---|---|---|---|
| Installed in vehicles sold in China | 112.9 | 104.9 | −7.1% |
| Installed in vehicles sold outside China | 27.5 | 45.9 | +66.8% |
| Total | 140.4 | 150.9 | +7.4% |
Financial performance
BYD reports on a calendar year and files quarterly to the Shenzhen and Hong Kong exchanges, so the group record is now a matter of public filing rather than estimate. The shape of it is a company whose revenue stopped compounding and whose margin compressed, followed by a third quarter in which profit growth returned ahead of revenue growth.
| RMB billion unless stated | FY2024 | FY2025 | 9M 2026 |
|---|---|---|---|
| Revenue | 777.1 | 803.97 | 566.30 |
| Revenue growth | +29.02% | +3.46% | +0.01% |
| Net profit attributable to shareholders | 40.25 | 32.62 | 22.34 |
| Net profit growth | +34.0% | −19.0% | −4.24% |
| Net margin | 5.18% | 4.06% | 3.94% |
| Gross margin | 19.44% | 17.74% | not disclosed |
| Automobiles and related products revenue | 617.38 | 648.65 | — |
| … as share of group revenue | 79.45% | 80.68% | — |
| Handsets, components and assembly revenue | 159.61 | 155.24 | — |
| Research and development expense | 54.2 | 63.4 | — |
| Net cash from operating activities | — | — | 54.47 (+33.36%) |
| Weighted average return on net assets | — | — | 8.72% (−2.11 pts) |
| NEV sales (units) | 4,272,145 | 4,602,436 | 3,621,744 (Jan–Oct) |
| Total assets | — | 883.73 (31 Dec) | 948.94 (+7.38%) |
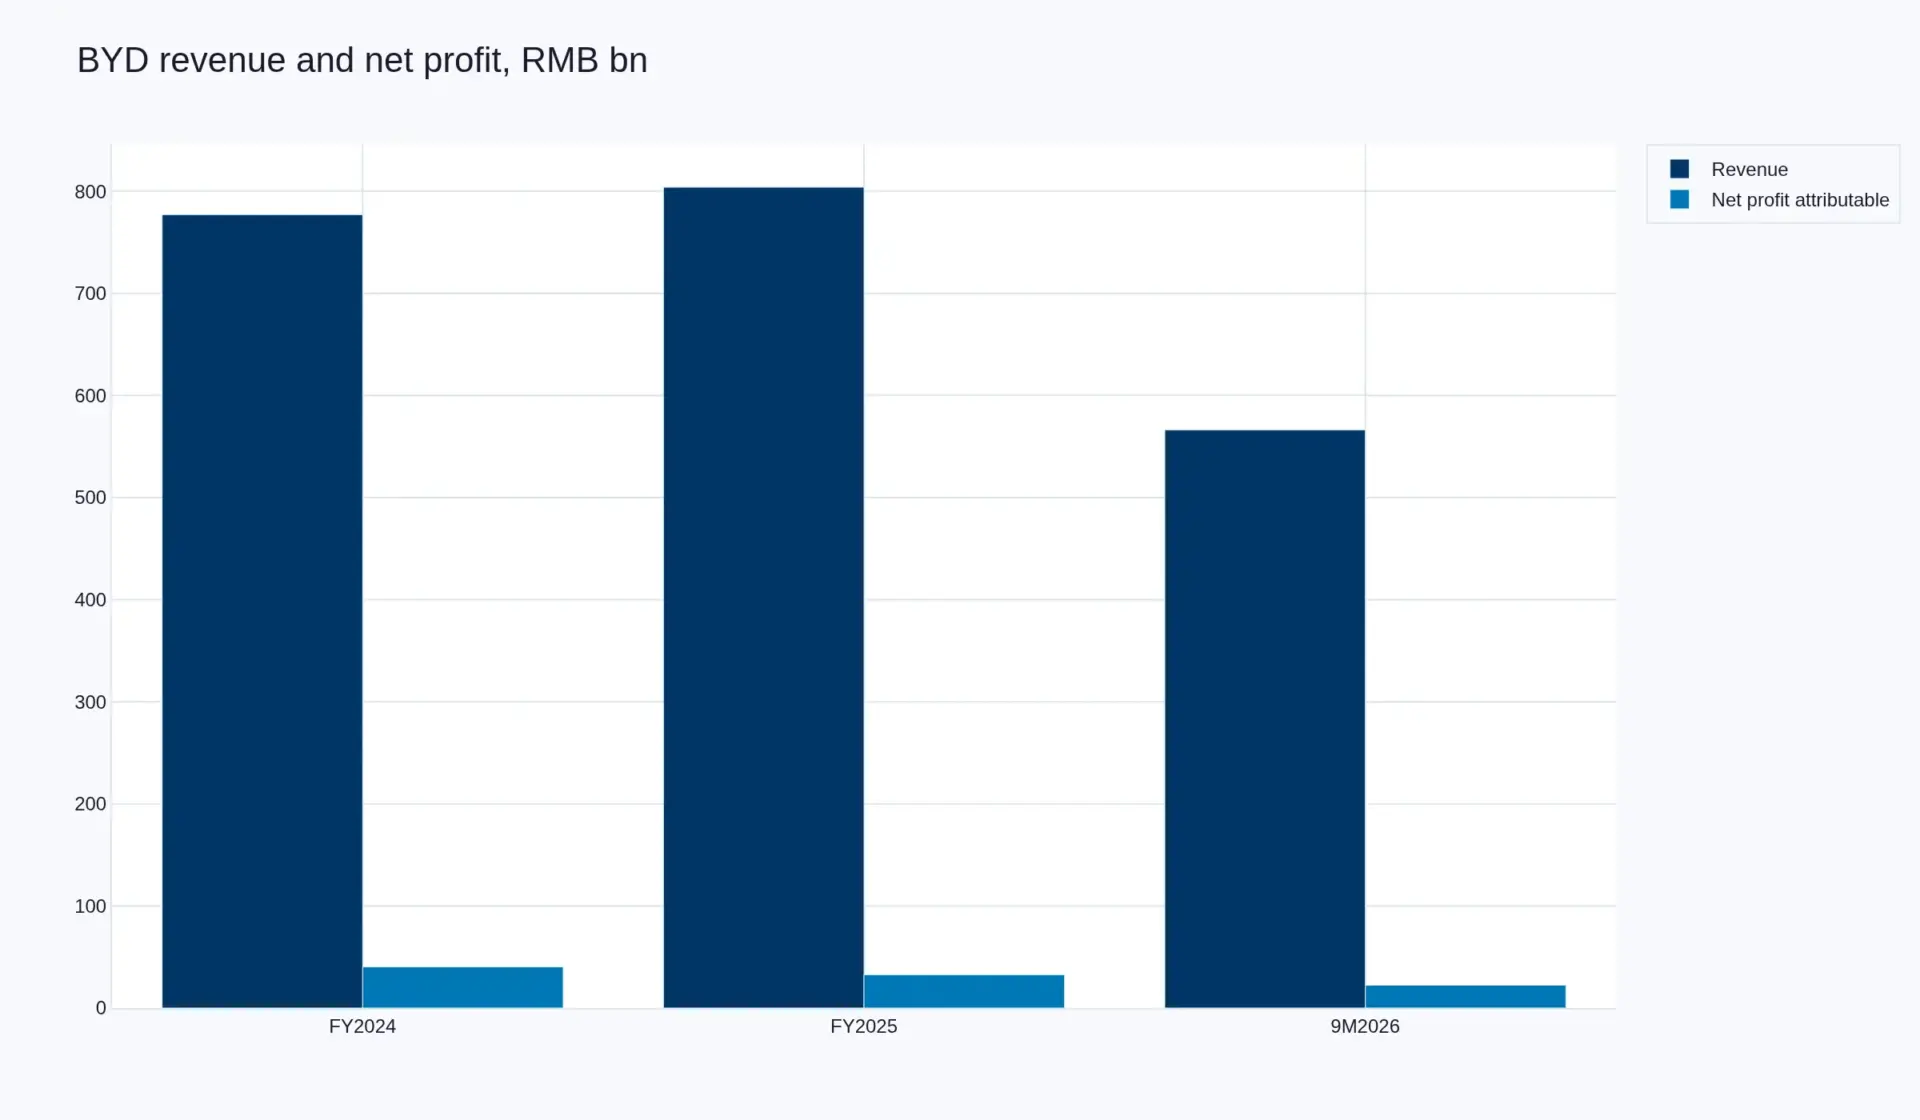
BYD revenue and net profit attributable to shareholders, RMB billion. FY2024 and FY2025 are full years; 9M2026 is nine months and is not comparable with a full year.
Three readings of the numbers matter more than the headline rates. First, the mix: automobiles and related products grew 5.06% to RMB 648.65 billion and rose to 80.68% of group revenue, while handsets and assembly fell 2.74% to RMB 155.24 billion — so the loss of momentum is in the smaller business as much as the larger one. Second, the cost line: research and development rose 17% to RMB 63.4 billion in a year when revenue rose 3.46%, which is a deliberate choice to keep spending through a price war rather than a passive squeeze. Third, cash: net cash from operating activities rose 33.36% to RMB 54.47 billion in the first nine months of 2026 even as net profit fell, which is what a company collecting on overseas sales at higher prices looks like in the cash-flow statement before it looks that way in the income statement.
The third quarter is also where the overseas argument becomes visible in reported figures rather than estimates. Revenue of RMB 221.49 billion grew 13.59% and net profit of RMB 10.02 billion grew 28.08%, on 1.32 million BEV and PHEV sales — up 19% — in which domestic sales fell 12% and exports rose 137% to 550,704 units. That quarter missed the RMB 240.83 billion revenue consensus tracked by Visible Alpha, so the recovery is real but weaker than the market had modelled.
SWOT analysis
- #2 global EV battery supplier: 15.2% of Jan–Sep 2026 installations on 150.9 GWh
- Vertical integration across cells, packs, power electronics and vehicles
- LFP-heavy portfolio aligned with the chemistry holding 81.2% of China’s 2025 market
- Operating cash flow up 33.36% to RMB 54.47bn in 9M 2026 despite lower net profit
- China EV sales down 32.9% in 9M 2026; PHEV volume down 11.02% year to date
- Net margin down from 5.18% (FY2024) to 3.94% (9M 2026)
- Battery volumes tied to own vehicle sales, unlike CATL’s third-party book
- Revenue growth of 0.01% over nine months, against a 29.02% year in 2024
- Overseas premium: roughly ten times the net profit per vehicle of the domestic market, on CLSA’s estimate
- Localisation: Hungary plant mass production targeted by end-2026, with assembly in Thailand, Indonesia and Cambodia
- Storage integration: #1 globally in H1 2026 with 9.1% share and shipments up 96.6%
- Sodium-ion as a cost hedge with lithium carbonate back above RMB 150,000 per tonne
- Trade barriers, including the EU’s cap on imports of Chinese hybrid vehicles
- Removal of China’s value-added tax rebate on exported EVs
- Cell overcapacity: roughly 4,800 GWh of planned Chinese capacity against about 1,000 GWh of demand
- CATL’s scale lead (39.1% vs 15.2%) and a widening growth gap of 17.5 percentage points
Recent developments
| Date | Development | Source |
|---|---|---|
| 10 Nov 2026 | Vice-president Liu Xueliang said the company will begin mass production at its Hungarian plant by the end of 2026, describing a new European factory opening “very quickly”; assembly in Thailand, Indonesia and Cambodia is positioned to offset lower export tax rebates. | Nikkei Asia via KrASIA |
| 2 Nov 2026 | January–September global battery share confirmed at 15.2% (150.9 GWh), down from 16.9% a year earlier, with China installations down 7.1% and non-China installations up 66.8%. | SNE Research via CnEVPost |
| 1 Nov 2026 | October sales of 490,168 NEVs (+10.97% year on year), with 170,194 exported. Year-to-date sales of 3,621,744 were 2.16% below the same point in 2025, with BEVs up 5.86% and PHEVs down 11.02%. | HKEX voluntary announcement |
| 29 Oct 2026 | Third-quarter revenue of RMB 221.49 billion (+13.59%) and net profit of RMB 10.02 billion (+28.08%); nine-month revenue of RMB 566.30 billion (+0.01%) and net profit of RMB 22.34 billion (−4.24%). | HKEX 2026 third quarterly report |
| 28 Aug 2026 | Opened its 10,000th 1.5 MW flash-charging station in Shenzhen, doubling the network from 5,000 in under five months and reaching halfway to a 20,000-station target for end-2026; parallel rollout began in Europe and the UK. | CnEVPost; Automotive World; The Next Web |
| Aug 2026 | CATL confirmed a 2027 pilot-line timeline for solid-state cells, aligning with BYD’s own stated schedule. | CarNewsChina |
| Jul 2026 | Wood Mackenzie’s first global BESS integrator ranking placed BYD fourth for full-year 2025; Benchmark Minerals then placed it first for H1 2026 on 9.1% share with shipments up 96.6%. | Wood Mackenzie; Benchmark Minerals |
| 27 Mar 2026 | Full-year 2025 results: revenue of RMB 803.97 billion (+3.46%), net profit of RMB 32.62 billion (−19%), gross margin 17.74%, 4,602,436 NEVs sold and a final dividend of RMB 0.358 per share. | CnEVPost, citing the annual report |
| Feb 2026 | Reported to be preparing limited-batch production of solid-state EV batteries from 2027, following breakthroughs in cycle life and fast charging. | Electrek (citing Cailian Press) |
| Jan 2026 | Lithium carbonate moved above RMB 150,000 per tonne, reaching roughly RMB 170,000, accelerating Chinese battery makers’ shift toward sodium-ion. | CarNewsChina (citing Autohome) |
Business strategy
BYD’s strategy reads as four linked bets rather than four separate businesses: defend the cell-cost advantage, localise production inside the markets that now carry the profit, own the charging experience, and pre-position for the next chemistry and the next revenue line before the current ones are arbitraged away.
Where the strategy is exposed
Three constraints sit underneath the plan. First, capacity: Chinese planned nameplate capacity of roughly 4,800 GWh against demand near 1,000 GWh leaves industry utilisation at 50–55%, which turns share defence into a price contest — and BYD’s own nine-month revenue line, up 0.01%, is what that contest looks like on a profit-and-loss statement. Second, policy: the European Union’s cap on imports of Chinese hybrids and Beijing’s reduction of the export VAT rebate both raise the cost of the export route that currently carries the profit, which is precisely why localisation has moved from a long-term plan to an end-2026 commitment in Hungary. Third, the charging network is a capital commitment whose return depends on utilisation: roughly one-third of its users drive other brands, which is good for asset turns but exposes the network to competitive pricing as third-party operators scale.
Sources
- BYD Company Limited, 2026 Third Quarterly Report, HKEX, 29 October 2026 — hkexnews.hk
- BYD Company Limited, Voluntary Announcement: Production and Sales Volume for October 2026, HKEX, 1 November 2026 — hkexnews.hk
- CnEVPost, “BYD’s 2025 net profit drops 19% as domestic price war bites”, 27 March 2026 — cnevpost.com
- CnEVPost, “Global EV battery market share in January–September 2026: CATL 39.1%, BYD 15.2%”, 2 November 2026 — cnevpost.com
- Nikkei Asia via KrASIA, “BYD, Geely lean on global growth as China market enters ‘harshest winter’”, 10 November 2026 — kr-asia.com
- Xinhua, “China’s BYD reports 34 pct net profit increase to 5.6 billion USD in 2024”, 25 March 2025 — english.news.cn
- SNE Research data reported by CnEVPost, “Global EV battery market share 2025”, February 2026 — cnevpost.com
- China power battery 2026 industry report — faxiangongchang.com
- Benchmark Minerals, “Who shipped the most BESS cells and systems in H1 2026” — source.benchmarkminerals.com
- Wood Mackenzie, Global BESS Integrator Ranking 2026, via ESS News and Energy-Storage.News — ess-news.com; woodmac.com
- CnEVPost, “BYD’s flash charging network reaches 10,000 stations”, August 2026 — cnevpost.com
- Automotive World, “BYD hits 10,000 1.5 MW fast chargers” — automotiveworld.com
- The Next Web, “BYD doubles its 1,500 kW charging network” — thenextweb.com
- Electrek, “BYD hits a milestone with solid-state EV batteries due out as soon as 2027”, February 2026 — electrek.co
- CarNewsChina, “CATL joins BYD in targeting 2027 solid-state battery trial production”, August 2026 — carnewschina.com
- CarNewsChina, “CATL, BYD fast-track sodium-ion battery shift as lithium prices soar”, January 2026 — carnewschina.com
- Jiangsu Now, BYD Xuzhou sodium-ion project groundbreaking, January 2024 — english.jschina.com.cn
- IEA, Global EV Outlook 2026 — Electric vehicle batteries — iea.org
- Pheonix Research market models: Global EV Battery Market (2025 USD 91.7 bn → 2033 USD 369.5 bn, 19.03% CAGR); Global Electric Vehicle Market (USD 892.6 bn → USD 2.41 tn, 13.25% CAGR); Global New Energy Vehicles Market (USD 1.34 tn → USD 3.28 tn).
Provenance: this profile is bound to Wikidata entity Q2608329 and Pheonix graph entity MIEN-node_80af04fa. Market presence is derived from published Pheonix market reports that name BYD. Sources dated to 10 November 2026; evidence last verified 14 November 2026.
Market Presence
BYD Company Limited is mentioned across 3 market reports.

