
Global Foodservice Packaging Market Report, Size, Share and Forecast 2026–2033: The Package Is 1.8 Cents of Every Dollar of the Meal, and 72 Per Cent of the Growth Is Just More Meals
This is the fifth report in Pheonix Research's foodservice packaging programme and the one that closes the spine: it aggregates four substrate-level builds — paper cups and lids, rigid containers and clamshells, moulded fibre, and flexible — into a single market of USD 96,000 million across 22.57 million tonnes in 2025, reaching USD 126,471 million across 28.44 million tonnes by 2033. Value grows 3.51 per cent, tonnage 2.93 per cent and realisation per tonne 0.56 per cent.
The first finding is about what drives the growth rather than how much of it there is. Decomposed into its three moving parts, 72.1 per cent of the market's value growth is simply more away-from-home transactions (610 billion to 745 billion, 2.53 per cent a year), 10.8 per cent is more packages per transaction (1.63 to 1.68) and 16.2 per cent is a higher price per package (9.66 to 10.10 US cents). This is a transaction derivative. Nothing in it grows because packaging got better.
The second finding sets the scale of the regulatory story. Hold the 2025 category mix, grow each line's tonnage at its own rate, and 2033 is worth USD 120,942 million. The model has USD 126,471 million. The USD 5,529 million gap — 18.1 per cent of the increment — is what the market pays more per tonne for: substrate mix and price. And that is smaller than the conference circuit implies, because converting the entire global EPS foodservice container pool to moulded fibre at today's realisations is worth USD 3,059 million of uplift, 3.19 per cent of the hub. The transition that dominates every panel is a 3 per cent event in value and a career-defining one for the converters holding the affected lines.
The third finding is structural, and it is the one operators never see. At 15.74 US cents of packaging spend per away-from-home transaction, the distributor takes 2.90 cents and the converter 12.84. The distributor's gross margin on the package — 18.4 per cent, on Sysco's fiscal 2025 disclosure — is larger in absolute cents than the converter's EBITDA on the same unit. That is the competitive landscape in one line: converters are consolidating for scale in front of a customer that is itself consolidating, and the USD 6.7 billion combination of Novolex and Pactiv Evergreen, completed 1 April 2025, is the clearest statement of it.
The fourth finding is why the substitution is affordable at all. United States food-away-from-home spending was USD 1.41 trillion in 2025 (USDA ERS), against USD 25,428 million of our modelled foodservice packaging. The package is 1.80 cents of the dollar. A twenty-five per cent increase in its cost — roughly the EPS-to-fibre premium — is 0.45 per cent of the transaction. The market can therefore turn over its substrate base entirely without a demand shock, which is exactly what it is doing.
Four risks qualify the forecast: reuse mandates, distributor and customer concentration, pass-through lag on resin and pulp, and regulatory fragmentation across twelve state foam bans, seven EPR states and the European Union's PPWR. Three falsifiers are stated in section 8. Band ±12 per cent.
Foodservice packaging is the only packaging market in which the buyer does not own the brand. The specification is set by an operator selling a meal, the order is placed by a distributor selling a case, and the cost lands on someone who never sees the invoice. That structure — rather than resin prices or regulation — is what makes this market behave the way it does.
It is also why the market has to be measured against something larger than itself. United States food-away-from-home spending reached USD 1.41 trillion in 2025, 56.3 per cent of all food expenditure (USDA Economic Research Service, Food Expenditure Series, June 2026 update). Our model puts United States foodservice packaging at USD 25,428 million in the same year. The package is 1.80 cents of every dollar of the meal.
Every finding below follows from that ratio. A twenty-five per cent increase in the cost of the package — roughly the premium the shift from expanded polystyrene to moulded fibre carries — adds 0.45 per cent to the price of the transaction. That is small enough that an operator adopts the compliant format when a statute or a chain customer requires it, and small enough that an operator does not adopt it when neither does. The market is not price-sensitive at the level of the meal. It is price-sensitive at the level of the case, which is where the distributor stands.
Market definition, size and forecast
This report counts packaging sold to foodservice operators: the cups, lids, containers, clamshells, trays, bowls, wraps, bags, cutlery, stirrers and condiment sachets in which food prepared away from home is served, transported and eaten. It counts the package and not the food, and not the filling machinery. It includes quick-service and fast-casual chains, full-service restaurants, cafés and coffee shops, catering, institutional foodservice in hospitals, schools, airports and stadia, convenience-store foodservice, dark kitchens and delivery-only operators, and the packaging component of retail meal solutions.
It excludes packaging for food manufactured for retail sale — that is a different specification, a different buyer and a different report. It excludes pet food, beverage bottles sold through retail, and reusable tableware sold as a durable good rather than as a packaging service.
| Indicator | 2025 | 2033 | CAGR |
|---|---|---|---|
| Market value (USD million) | 96,000 | 126,471 | 3.51% |
| Volume (tonnes) | 22,574,000 | 28,439,000 | 2.93% |
| Realisation (USD per tonne) | 4,253 | 4,447 | 0.56% |
| Packages (billion units) | 994.3 | 1,251.6 | 2.92% |
| Away-from-home transactions (billion) | 610 | 745 | 2.53% |
| Value per package (US cents) | 9.66 | 10.10 | 0.57% |
| Value per transaction (US cents) | 15.74 | 16.98 | 0.96% |
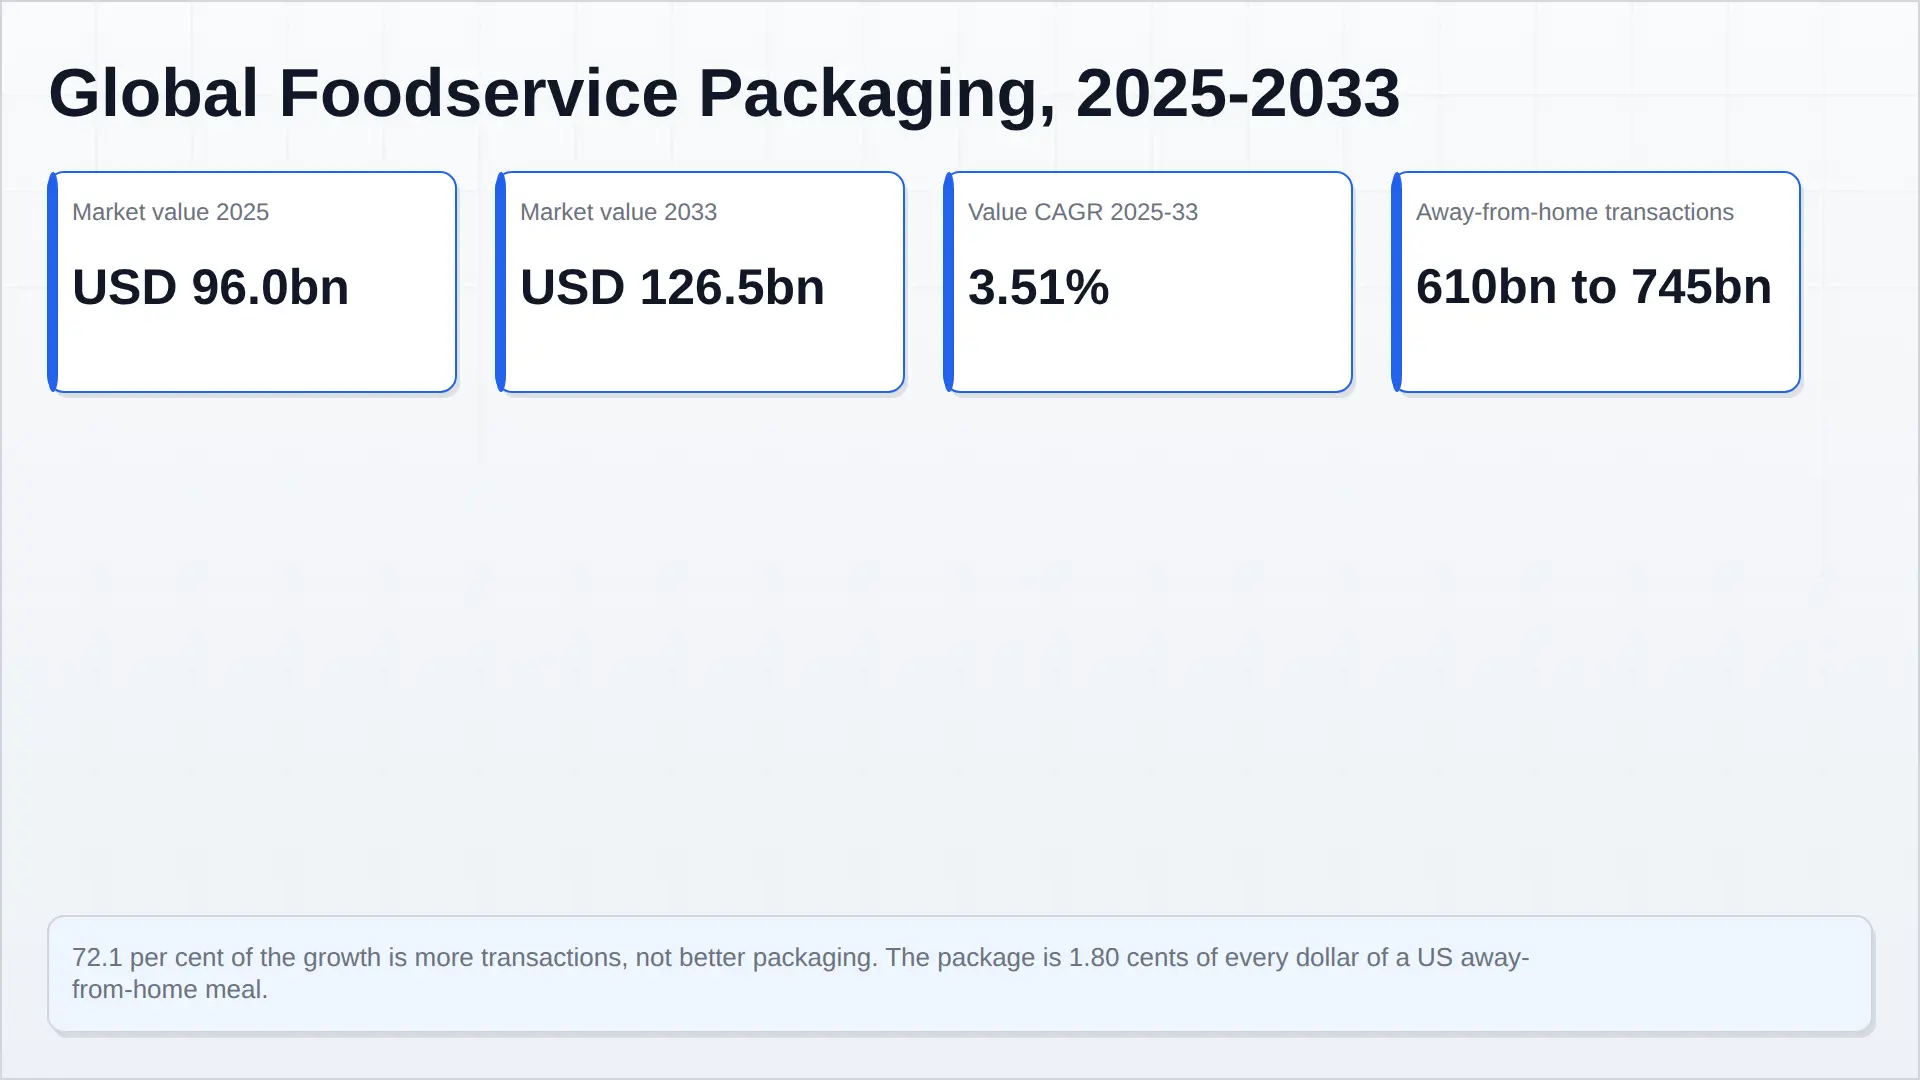
Value grows 3.51 per cent, tonnage 2.93 per cent, and realisation barely moves. That is the first thing this hub says that its four constituent reports cannot say individually: at the level of the whole market, the foodservice complex is a physical-growth business. The value increment is USD 30,471 million, a multiple of 1.32 on the 2025 base.
The six categories
| Category | 2025 value | Share | 2033 value | Share | Tonnes 2025 → 2033 | USD/t 2025 | Value CAGR | Tonnage CAGR |
|---|---|---|---|---|---|---|---|---|
| Cups and lids | 21,600 | 22.50% | 26,988 | 21.34% | 8.31 → 10.18 Mt | 2,600 | 2.82% | 2.58% |
| Rigid containers and clamshells | 26,800 | 27.92% | 34,383 | 27.19% | 4.67 → 5.62 Mt | 5,734 | 3.16% | 2.34% |
| Flexible foodservice | 24,300 | 25.31% | 33,700 | 26.65% | 3.76 → 4.88 Mt | 6,458 | 4.17% | 3.31% |
| Trays, plates and bowls | 14,200 | 14.79% | 20,400 | 16.13% | 4.58 → 6.28 Mt | 3,100 | 4.63% | 4.02% |
| Cutlery, straws and sachets | 5,900 | 6.15% | 6,800 | 5.38% | 0.80 → 0.90 Mt | 7,403 | 1.79% | 1.46% |
| Foil containers and other | 3,200 | 3.33% | 4,200 | 3.32% | 0.45 → 0.58 Mt | 7,095 | 3.46% | 3.08% |
| Total | 96,000 | 100% | 126,471 | 100% | 22.57 → 28.44 Mt | 4,253 | 3.51% | 2.93% |
The fastest-growing category is the one that is least a container. Trays, plates and bowls grow 4.63 per cent — faster than any other line — because that is where the delivery order lands: a plate that travels, a bowl with a lid, a tray that holds four components without a bag. It is also the cheapest category per tonne at USD 3,100, which is why it can grow tonnage at 4.02 per cent and still add less value than flexible. The slowest-growing category is cutlery, straws and sachets at 1.79 per cent, and the reason is legislative rather than commercial: it is the one line that European and North American statutes have removed outright rather than substituted.
What the growth is made of
The value increment of USD 30,471 million splits into two mechanisms. Grow each category's tonnage at its own rate but hold its 2025 realisation, and 2033 is worth USD 120,942 million. The model has USD 126,471 million. The USD 5,529 million gap — 18.1 per cent of the increment — is the market paying more per tonne, through substrate mix and through price. The other 81.9 per cent, USD 24,942 million, is more material passing through the system.
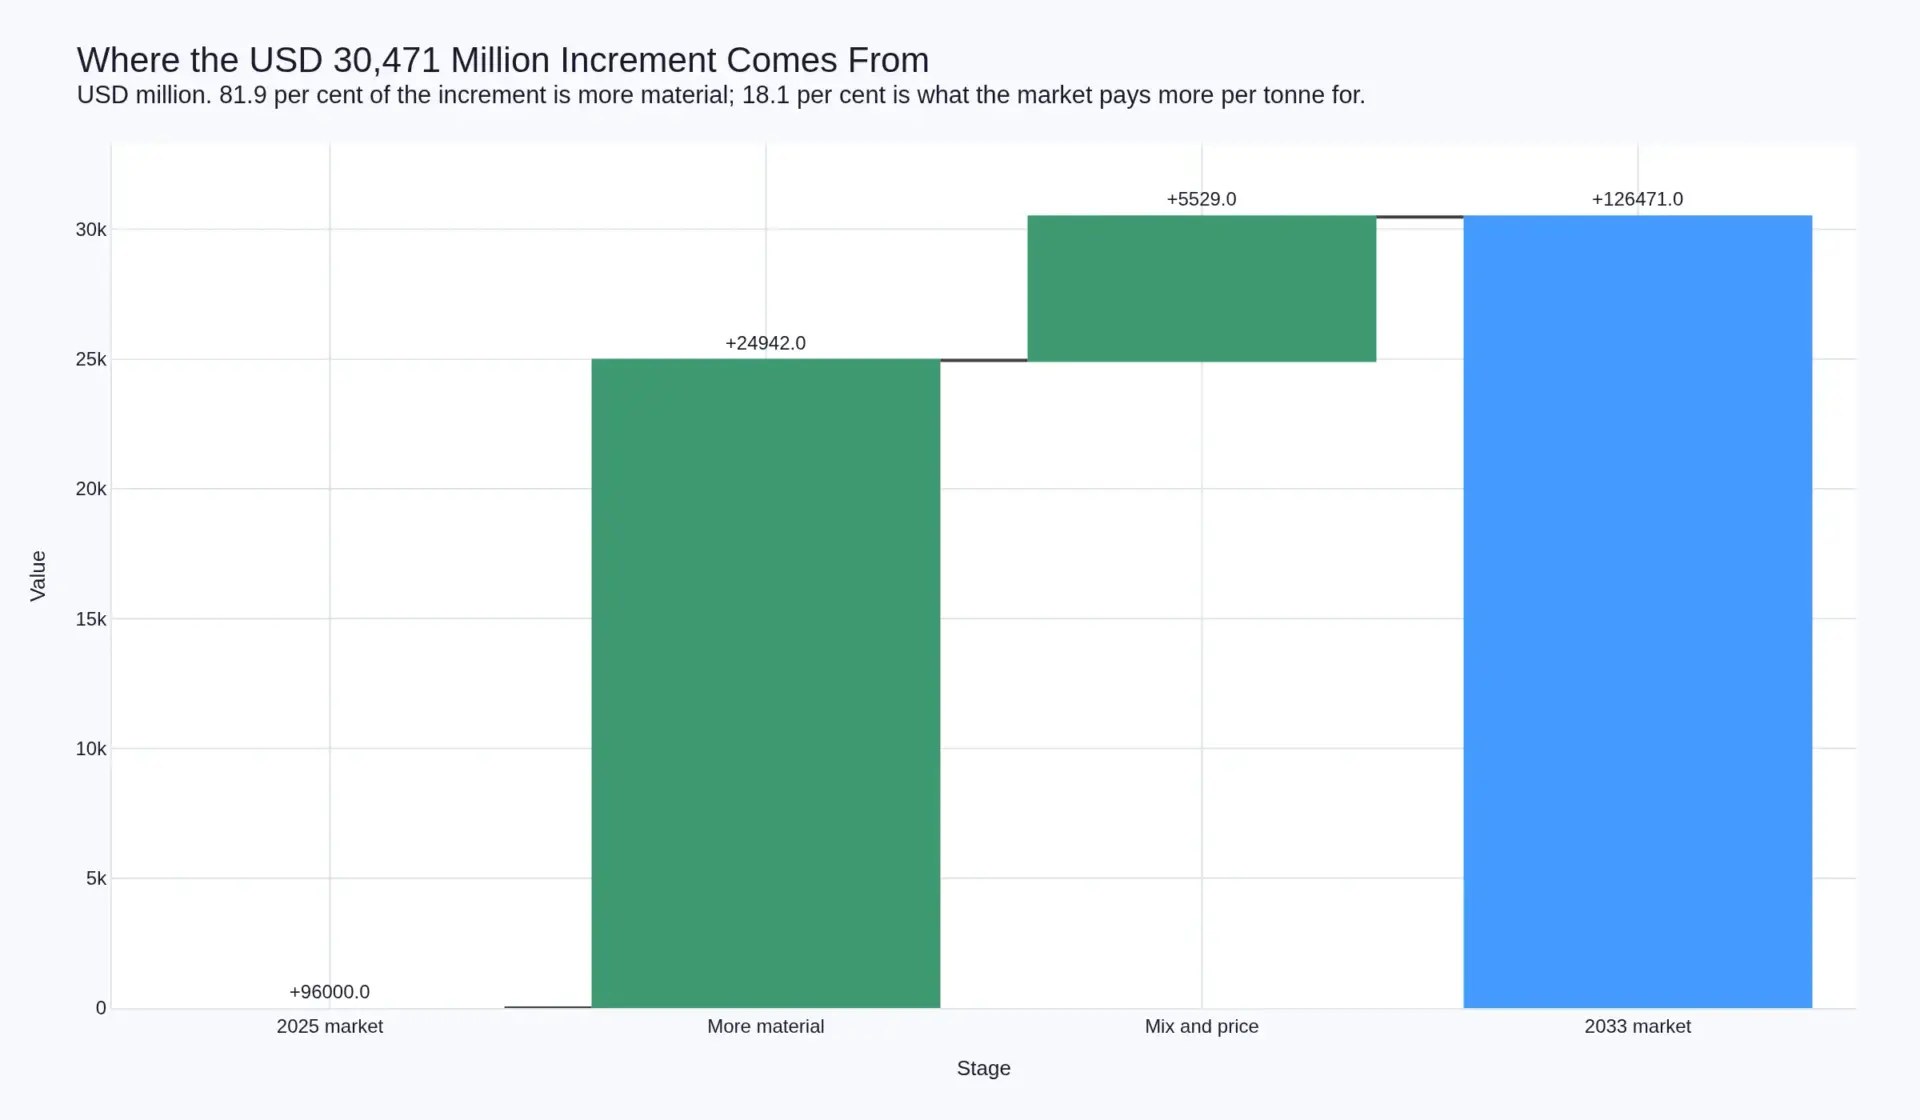
Said the other way, and more usefully: 72.1 per cent of this market's value growth is simply more away-from-home transactions (610 billion to 745 billion, 2.53 per cent a year), 10.8 per cent is more packages per transaction (1.63 to 1.68), and 16.2 per cent is a higher price per package (9.66 to 10.10 US cents). The three terms multiply to the 3.51 per cent. Nothing in the market grows because packaging got better; it grows because people eat out more often, and because the meal that travels needs one more piece of packaging than the meal that does not.
The 1.63-to-1.68 move is the smallest term and the one worth watching. It is a channel effect, and the channel evidence is unambiguous: the National Restaurant Association's 2025 Off-Premises Restaurant Trends report puts nearly 75 per cent of all United States restaurant traffic off-premises, and reports that off-premises accounts for a larger share of sales than in 2019 for 58 per cent of limited-service and 41 per cent of full-service operators. Three quarters of transactions now require a package where a plate would once have done.
Geography
| Region | Share 2025 | 2025 value | 2033 value |
|---|---|---|---|
| Asia-Pacific | 32.4% | 31,104 | 40,977 |
| North America | 30.1% | 28,896 | 38,068 |
| Europe | 24.8% | 23,808 | 31,365 |
| Latin America | 7.2% | 6,912 | 9,106 |
| Middle East and Africa | 5.5% | 5,280 | 6,956 |
Column sums differ from the headline by rounding. Asia-Pacific is the largest region by value and the fastest-growing at scale, but Europe is where the specification is set: the European Union's packaging and packaging waste regulation and single-use plastics directive are the two instruments that every global operator designs to, because qualifying a package once for Europe qualifies it almost everywhere except California.
How this reconciles to the four reports beneath it
| Category in this report | 2025 value | Carried from | Basis |
|---|---|---|---|
| Cups and lids | 21,600 | Report 114783 (paper cups and lids, USD 15,340m) plus plastic cups and lids | 114783 models paper only; the plastic cup line is added here |
| Rigid containers and clamshells | 26,800 | Report 114807 | Includes the moulded fibre foodservice line of USD 5,896m |
| Flexible foodservice | 24,300 | Report 114828 (USD 268,000m global flexible) | The foodservice slice of a much larger retail-led market |
| Trays, plates and bowls | 14,200 | New in this report | Non-container formats the substrate reports do not isolate |
| Cutlery, straws and sachets | 5,900 | New in this report | The line regulators removed rather than substituted |
| Foil containers and other | 3,200 | New in this report | Aluminium and minor substrates |
The moulded fibre line is counted once. Report 114807 models it as a substrate inside rigid containers at USD 5,896 million; report 114815 reaches the same USD 5,896 million from the fibre side, as its foodservice containers segment. Carrying both would add USD 5,896 million to a 96,000 million base and overstate the hub. It sits inside rigid containers here, and the fibre report is linked as a constituent rather than added as a category.
The flexible line is the reverse problem. Report 114828 sizes global flexible packaging at USD 268,000 million, most of which is retail food, not foodservice. The USD 24,300 million carried here is the foodservice slice — wraps, bags, films, pouches and lidding — and it is the only category in this hub where the parent report is more than three times the size of the line being drawn from it.
Articles on this market
Table of Contents
Competitive Landscape
Competitive landscape
The market is fragmented at the point of production and concentrated at the point of purchase, and the two facts are related. There are thousands of converters; there are three foodservice distributors of consequence in North America and a handful of buying groups in Europe. A converter with a better cup does not get to call on McDonald’s. It gets to bid a case specification to a distributor who already carries four competing cups, and the distributor’s gross margin — 18.4 per cent at Sysco in fiscal 2025 — is earned on the transaction either way.
The anchors
| Company | Basis | Latest disclosed position | What it tells you |
|---|---|---|---|
| Novolex / Pactiv Evergreen | Combination completed 1 April 2025 | Transaction valued at approximately USD 6.7 billion including Pactiv Evergreen’s net debt; USD 18.00 per share in cash, a 49 per cent premium to the two-month unaffected VWAP; more than 250 brands and 39,000 SKUs | The consolidation thesis is substrate breadth, not single-format depth — one supplier who can quote the whole case |
| Pactiv Evergreen (pre-merger) | Foodservice segment, FY2024 | Segment net revenues USD 2,572 million, adjusted EBITDA USD 426 million, a 17 per cent segment margin; total company net revenues USD 5,148 million | A pure foodservice converter earns a mid-to-high-teens segment margin and still grew revenue by one million dollars in a year |
| Graphic Packaging | FY2024 | Net sales USD 8,807 million; innovation sales growth of USD 205 million from conversions to sustainable packaging; foodservice and beverage volumes higher while food, household and health and beauty declined | Paper foodservice was the growing part of a declining portfolio — the substitution is real and it is already in the reported numbers |
| Huhtamäki | H1 2026 | Group adjusted EBIT margin 10.1 per cent | A group figure across formats; it is not a like-for-like foodservice segment margin and should not be read as one |
| Sysco | FY2025 | Sales USD 81.4 billion; US Foodservice USD 57.0 billion; gross margin 18.4 per cent; product cost inflation 2.5 per cent; US Foodservice case volume up 0.5 per cent while local case volume fell 1.4 per cent | The channel is four times the size of the entire packaging market it distributes into, and it is growing case volume more slowly than it is growing sales |
Concentration is on the customer side, not the supply side
The number that constrains this market is not any converter’s share. It is this one, from Pactiv Evergreen’s 2024 annual report: the ten largest customers accounted for approximately 44 per cent of net revenues, and a single customer in the Foodservice segment accounted for approximately 10 per cent of consolidated net revenues. A converter that loses one account loses a tenth of the company. That is the bargaining structure, and it explains why the response to distributor consolidation is converter consolidation rather than price competition.
On our model the five largest foodservice-focused converters together hold roughly a fifth of hub value — enough to set the price of a case specification, not enough to set the price of the market. The remaining four fifths is regional and single-format capacity, which is why the fragmented classification holds at hub level even after the largest transaction the sector has seen.
Two things consolidation is actually buying. First, qualification breadth: a European operator group sourcing across twenty-seven member states wants one supplier who can document compliance in each. Second, substrate optionality — the Novolex combination explicitly rests on the combined substrate set, because no converter wants to be the one holding an EPS line when the twelfth state legislates. Neither of those is a manufacturing economy of scale. Both are procurement-position economies, which is the right kind to have when your customer is a distributor.
Value Chain
Value chain and cost structure
The value chain is where this hub diverges most sharply from its four constituent reports, because it is the only level at which the distributor is visible. Everything below is expressed in US cents per away-from-home transaction, translated from the USD 96,000 million hub value and 610 billion transactions.
| Layer | US cents per transaction | Share of operator spend | Basis |
|---|---|---|---|
| Operator’s packaging spend | 15.74 | 100% | Hub value divided by transaction count |
| Distributor gross margin | 2.90 | 18.4% | Sysco fiscal 2025 consolidated gross margin, 18.4% |
| Converter net revenue | 12.84 | 81.6% | Residual |
| — Material (resin, pulp, board, foil, film) | 6.42 | 50% | Model |
| — Energy and labour | 2.57 | 20% | Model |
| — Freight | 0.51 | 4% | Model |
| — SG&A, R&D and waste | 1.16 | 9% | Model |
| — EBITDA | 2.18 | 17% | Pactiv Evergreen Foodservice segment adjusted EBITDA margin, FY2024 |
The distributor’s margin is larger than the converter’s EBITDA. That is not a modelling artefact; it follows from the 18.4 per cent channel margin sitting on top of a 17 per cent manufacturing margin, and it is the single most useful fact in this report for anyone thinking about where value accrues. The converter buys resin, runs a line, employs the people, carries the qualification risk and earns 2.18 cents. The distributor picks, packs and delivers the case and earns 2.90.
What the converter’s 2.18 cents means in context: on a United States transaction worth roughly twelve dollars, the entire EBITDA of the company that made every package on the tray is under a quarter of one per cent of what the customer paid for lunch. This is why packaging does not appear on an operator’s P&L radar, and why the operator delegates the decision to a distributor and a chain specification committee.
Pricing is pass-through, not pricing power
Pactiv Evergreen’s 2024 segment disclosure is explicit about the mechanism: Foodservice net revenues were flat at USD 2,572 million, with favourable pricing largely due to the pass-through of higher material costs offset by lower volume and unfavourable mix. Positive price, negative volume, flat revenue, EBITDA down 8 per cent on higher manufacturing costs. That is what a pass-through business looks like in a normal year, and it is the reason the realisation line in this market is so flat — 4,253 to 4,447 dollars per tonne across eight years, 0.56 per cent a year.
The contrast with the flexible report is instructive. There, realisation rose 0.83 per cent a year and every one of five substrate lines contributed, because flexible converting is a purchasing and printing business that can hold a spread. Here, the converter is one step further from the brand and two steps further from the consumer, and the spread is competed away.
Why the substitution runs through capital, not material
The fibre line inside rigid containers carries a premium of roughly 41 per cent over the plastic it replaces, and the premium is not the fibre. At USD 3.57 per unit of pulp against USD 3.41 of resin, the material cost difference explains a fraction of it. The rest is the machine: a moulded fibre line costs about USD 2.56 million and produces fewer units than a cheaper thermoformer, which puts capital per annual unit at 8.5 to 12.8 cents for fibre against 4.4 to 5.7 cents for thermoforming, and payback at 7.9 years against 4.8. The substitution is therefore a capital-allocation decision made by a converter with a distributor breathing down its neck — which is why it happens at the pace of regulation rather than the pace of the economics.
Investment Activity
Investment activity
Capital in this market is going into two places and neither of them is a new thermoformer.
The first is substrate breadth through acquisition. Novolex completed its combination with Pactiv Evergreen on 1 April 2025 at approximately USD 6.7 billion including net debt, USD 18.00 per share, a 49 per cent premium to the two-month unaffected volume-weighted average price. The combined business operates more than 250 brands and 39,000 SKUs across the United States, Canada, Mexico and Europe. The stated rationale is a diverse substrate set and R&D capability — in plain terms, the ability to quote whatever the statute permits in whatever jurisdiction asks.
At the substrate level the same logic ran through flexible packaging, where the Amcor and Berry combination completed on 30 April 2025. The reported synergy programme of USD 260 million in the first year rising to USD 650 million by the third, with procurement at roughly half of it, is a statement that the largest single source of value in combining two converters is the resin contract. That is a purchasing story, not a manufacturing story, and it is the same story in foodservice.
The second is fibre capacity. A moulded fibre line is a USD 2.56 million decision that carries 8.5 to 12.8 cents of capital per annual unit and takes 7.9 years to pay back at today’s realisations, against 4.8 years for a thermoformer at 4.4 to 5.7 cents per unit. Converters build it when a customer contract or a statute underwrites the volume, not before. That is why fibre capacity additions track legislative calendars with a two-to-three-year lag, and it is why the capacity that will serve 2030 obligations is being committed now.
Graphic Packaging’s 2024 disclosure gives the demand-side confirmation: innovation sales growth of USD 205 million, driven by conversions to sustainable consumer packaging, with foodservice and beverage volumes higher while food, household and health and beauty volumes fell. The investment is following the conversion, and the conversion is following the statute.
The composition matters for the forecast. This is not a market where capacity is being added to serve growth; growth is 2.93 per cent in tonnage and can be served by incremental debottlenecking. Capacity is being added to serve substitution, which is a replacement market with a fixed volume and a moving substrate mix — and that is a materially better business for the converter who wins the qualification and a materially worse one for the converter who does not.
Technology & Innovation
Technology and innovation
Four technology questions decide this market, and only one of them is a materials-science question.
Barrier chemistry is a legal question wearing a lab coat. The European single-use plastics directive bans certain single-use plastic items, and its definition of plastic is not intuitive. An aqueous acrylic dispersion applied as a barrier coating is still legally plastic under that definition, which means a coated paper cup marketed as plastic-free may not be. The consequence for the market is that barrier development is now driven by a regulatory classification test rather than a performance curve: the winning coating is the one that delivers the grease and moisture barrier while falling outside the definition, and the design constraint is coat weight against legal definition rather than chemistry against chemistry.
Dry-press moulded fibre is the throughput question. Wet-press fibre produces the egg tray: thick, cheap, dimensionally forgiving. Dry-press fibre is what a clamshell needs — thin wall, tight tolerance, a snap-fit that closes at line speed and stays closed in a delivery bag. Whether dry-press can hold a snap-fit at the cycle times a foodservice converter needs is the single largest open question carried into this hub from the moulded fibre report, and the answer determines whether the EPS displacement lands in fibre or in polypropylene.
Mono-material structures are the recyclability question. Sixty-three to eighty-four per cent of food-contact flexible structures are multi-layer, and fifty to seventy per cent are multi-material — which is exactly what makes them good barriers and exactly what makes them unrecyclable in a mechanical stream. The design limit under the European packaging regulation is a 5 per cent-by-weight threshold for non-primary components, against a barrier measured in cubic centimetres per square metre per day. Those two numbers do not naturally meet, and the innovation is entirely in the gap between them.
PFAS restriction is the silent one. Fluorinated barrier chemistry is being restricted in food-contact applications across the European Union and multiple United States states. Every converter with a grease-barrier paper line has a reformulation project, and the choice of replacement determines the recyclability classification, the EPR fee band and — in Europe — whether the package is legally plastic. One chemistry decision cascades into four compliance outcomes.
Reuse systems are the technology that is not a package. The European regulation requires take-away operators to offer a reusable option within thirty-six months of entry into force and, from 2030, to endeavour to offer ten per cent of take-away products in reusable packaging. That requires washing infrastructure, deposit or tracking systems, and reverse logistics — none of which any converter currently owns. It is the only technology in this chapter that competes with the market rather than serving it.
The innovation profile is high-intensity, moderate-patent and technologically mature. Nothing here is a breakthrough; everything here is a qualification. That is the defining characteristic of a mature market under regulatory stress: the R&D budget goes into compliance documentation, not into discovery.
Market Risk
Market risk and scenarios
Three scenarios, built off the same category model with different transaction and price assumptions.
| Scenario | Value CAGR | 2033 value | What has to be true |
|---|---|---|---|
| Conservative | 2.60% | 117,883 | Transaction growth slows as away-from-home spending plateaus in mature markets; Article 29 reuse takes a measurable share of European beverage cups; price per package flat |
| Base | 3.51% | 126,471 | Transactions grow 2.53 per cent, packages per transaction 0.38 per cent, price per package 0.57 per cent; substrate mix shifts as legislated |
| Optimistic | 4.30% | 134,445 | Off-premises share keeps rising in Asia-Pacific; delivery density improves packaging-per-order; fibre capacity lands on time and the mix term runs ahead of the base |
Sensitivities. The forecast is most exposed to the transaction term, because it carries 72.1 per cent of the growth — a sustained one-point change in transaction growth moves the 2033 endpoint by roughly the difference between the conservative and base scenarios. The price term is the least stable and the least consequential: it is 16.2 per cent of the growth and it is pass-through, so a resin or pulp shock moves it for a year and then unwinds. The packages-per-transaction term is small but has the widest plausible range, since it is a channel variable and delivery penetration is not close to settled in any market outside North America, China and the United Kingdom.
Four risks
One — reuse mandates destroy units rather than reallocating them. Every other regulation in this report moves volume between substrates. Article 29’s reusable beverage target removes the cup. It is the only instrument in the landscape that shrinks the market, it is the only one where the compliance cost falls on the operator’s infrastructure rather than the converter’s product, and it is therefore the one with the least predictable adoption curve. Watch European beverage cup unit counts from 2030, not packaging revenue.
Two — customer and channel concentration. The top ten customers are 44 per cent of a leading converter’s net revenues and one Foodservice customer is about 10 per cent of consolidated revenue. A single account loss is a tenth of the company. Add distributor consolidation and the negotiating position of a mid-sized converter worsens every year, regardless of what the market does.
Three — pass-through lag. Resin and pulp move quarterly; converter contracts reset annually. Pactiv Evergreen’s 2024 result is the template: positive price, negative volume, flat revenue, EBITDA down 8 per cent on higher manufacturing costs. In a year when input costs rise, the converter absorbs the lag; in a year when they fall, the customer claims it. The asymmetry is structural, not cyclical.
Four — regulatory fragmentation. Twelve state foam bans, seven EPR regimes with seven different fee schedules, twenty-seven member states implementing one regulation, and a PFAS landscape that differs by jurisdiction. Every additional regime is a qualification cost that a small converter cannot amortise and a large one can. Fragmentation is therefore not a threat to the market; it is a mechanism that concentrates it, and it should be read as a competitive risk rather than a demand risk.
Three falsifiers
The forecast is wrong if any of these holds.
First: if off-premises traffic falls below 70 per cent of United States restaurant orders for two consecutive years — the National Restaurant Association currently reports nearly 75 per cent — then the packages-per-transaction term of 10.8 per cent is not merely wrong, it is reversed, and the base case is high by more than the conservative scenario assumes.
Second: if fibre’s premium over polypropylene narrows below 20 per cent from the 41 per cent modelled here, the mix term of USD 5,529 million largely disappears and 2033 lands close to the mix-neutral USD 120,942 million, which would put the value CAGR near 2.9 per cent rather than 3.51.
Third: if distributor gross margin on packaging compresses below 15 per cent, the value-chain split in section four is wrong and the converter’s share of the operator’s spend is materially understated. That would not change the market size, but it would change every strategic conclusion drawn from it.
Forecast band ±12 per cent around the base case, reflecting scenario dispersion and the unresolved timing of fibre capacity relative to legislated deadlines.
Regulatory Landscape
Regulatory landscape
This market is regulated on three axes simultaneously — what material may be used, who pays for it at end of life, and how much of it may be single-use at all — and the three instruments do not point in the same direction.
| Instrument | Jurisdiction | Obligation | Effect on this market |
|---|---|---|---|
| Single-Use Plastics Directive 2019/904 | European Union | From 3 July 2021, single-use plastic plates, cutlery, straws, stirrers, balloon sticks and cotton buds cannot be placed on the market; the same applies to cups and food and beverage containers made of expanded polystyrene, and to all products made of oxo-degradable plastic | Removes the lightest container in the market — a 13 gram EPS clamshell — and forces conversion to substitutes weighing 31 to 42 grams |
| PPWR Article 29 | European Union | From 1 January 2030, at least 10 per cent of alcoholic and non-alcoholic beverages made available by final distributors must be in reusable packaging within a re-use system; endeavour of 40 per cent by 2040, with exceptions for highly perishable beverages, milk and specified wine categories | Destroys cup units rather than reallocating them; the only instrument here that shrinks the market |
| PPWR Article 33 | European Union | Final distributors in the HORECA sector selling hot or cold beverages or ready-prepared food in take-away packaging must offer a reusable option within 36 months of entry into force; from 2030 they must endeavour to offer 10 per cent of products in reusable packaging | Creates a parallel reusable channel next to single-use rather than replacing it |
| PPWR single-use bans | European Union | Single-use plastic packaging for food and beverages consumed within hotels, bars and restaurants is prohibited, as are individual portions of condiments, sauces, creamers and sugar | Removes a format line entirely — the sachet disappears, not the substrate |
| PPWR refill obligation | European Union | Distributors with a retail area above 400 square metres must allocate at least 10 per cent of space to refill stations by 2030 | Marginal for foodservice; relevant to retail meal solutions |
| State foam bans | United States, twelve states | Expanded polystyrene foodservice containers prohibited at the point of sale | Removes the cheapest substrate in the market without specifying the replacement |
| Extended producer responsibility | United States, seven states | Producer fees levied per tonne, modulated by recyclability and recycled content | Penalises the heavier compliant substitute, because the fee is levied on mass |
| PFAS restrictions | European Union and multiple United States states | Fluorinated barrier chemistry restricted in food-contact applications | Forces barrier redesign and, through the replacement chemistry, sets the recyclability and EPR classification |
Sources: European Commission, EU restrictions on certain single-use plastics; Food Packaging Forum summary of the final PPWR provisions, January 2025.
The price of the transition, measured
The regulatory story is usually told as a market event. It is worth pricing as one. The entire global pool of EPS foodservice containers is 36.9 billion units a year, realised at 5.81 US cents each. Convert all of it to moulded fibre at 14.10 cents and the market gains USD 3,059 million of value on unchanged unit volume — 3.19 per cent of the hub. That is the whole prize. Every conference panel, every state statute, every qualification programme and every capacity commitment in this transition is competing for three per cent of the market.
For the converter holding an EPS line, of course, it is not three per cent. It is the whole line. That asymmetry — trivial at market level, existential at asset level — is the reason the transition proceeds at a pace that looks irrational from the outside and entirely rational from the inside.
The contradiction at the centre of it
Two instruments push the same object in opposite directions. A twelve-state patchwork of foam bans removes a 13 gram container and requires a substitute that weighs 31 to 42 grams — converting the whole United States EPS pool to fibre removes 480,000 tonnes of plastic and adds 1.07 million tonnes of mass, a 14.3 per cent increase on the tonnage of the affected market. Meanwhile EPR fees are levied per tonne and modulated by recyclability. The compliant substitute therefore attracts a higher fee than the non-compliant incumbent did, and the operator pays both. Nothing in either instrument is wrong in isolation; together they price the transition against the party making it.