

Company Profile
Corteva, Inc.
Corteva, Inc. (NYSE: CTVA) is an Indianapolis-headquartered crop protection company. From its formation in 2019 as the agriculture business of DowDuPont until 1 October 2026 it operated two segments, seed and crop protection. On that date it separated the seed segment into Vylor Inc. (NYSE: VYLR), which began regular-way trading on the New York Stock Exchange the same morning. Corteva retains the crop protection portfolio, the corporate name, the listing, and the legacy pension and environmental obligations of the businesses it was assembled from.
Identifiers
| Legal name | Corteva, Inc. |
|---|---|
| Listing | New York Stock Exchange, ticker CTVA |
| Headquarters | Indianapolis, Indiana, United States |
| Formed | 2019, as the agriculture spin-off of DowDuPont; traded as Corteva Agriscience |
| Wikidata ID | Q63197674 — label “Corteva”, aliases “Corteva, Inc.” and “Corteva Agriscience” |
| Pheonix entity ID | MIEN-node_8b2eea48 |
| Official website | corteva.com |
| Investor relations | investors.corteva.com |
| Regulatory filings | SEC EDGAR, CIK 0001755672 |
| Pheonix coverage | 6 published market reports name this company against its Wikidata identifier, across the Seeds and Crop Protection & Pest Control segments |
Executive Summary
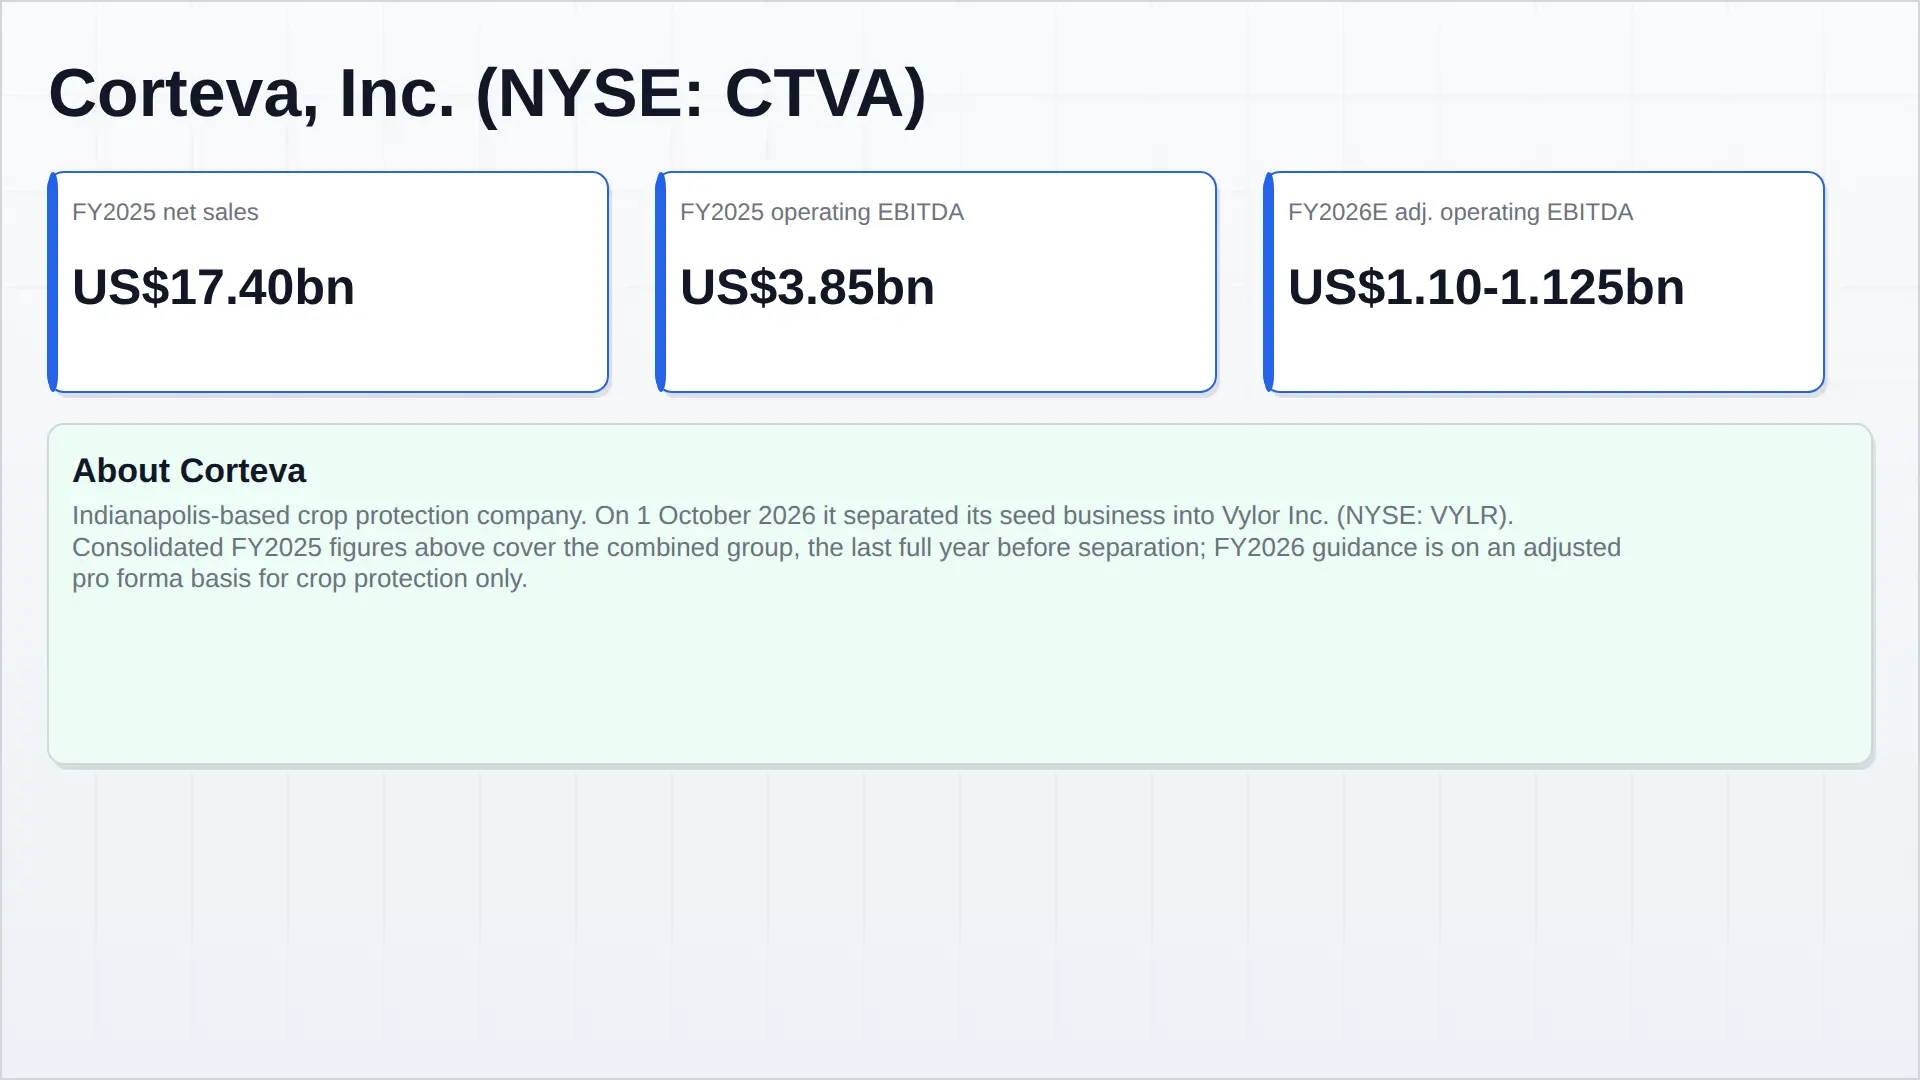
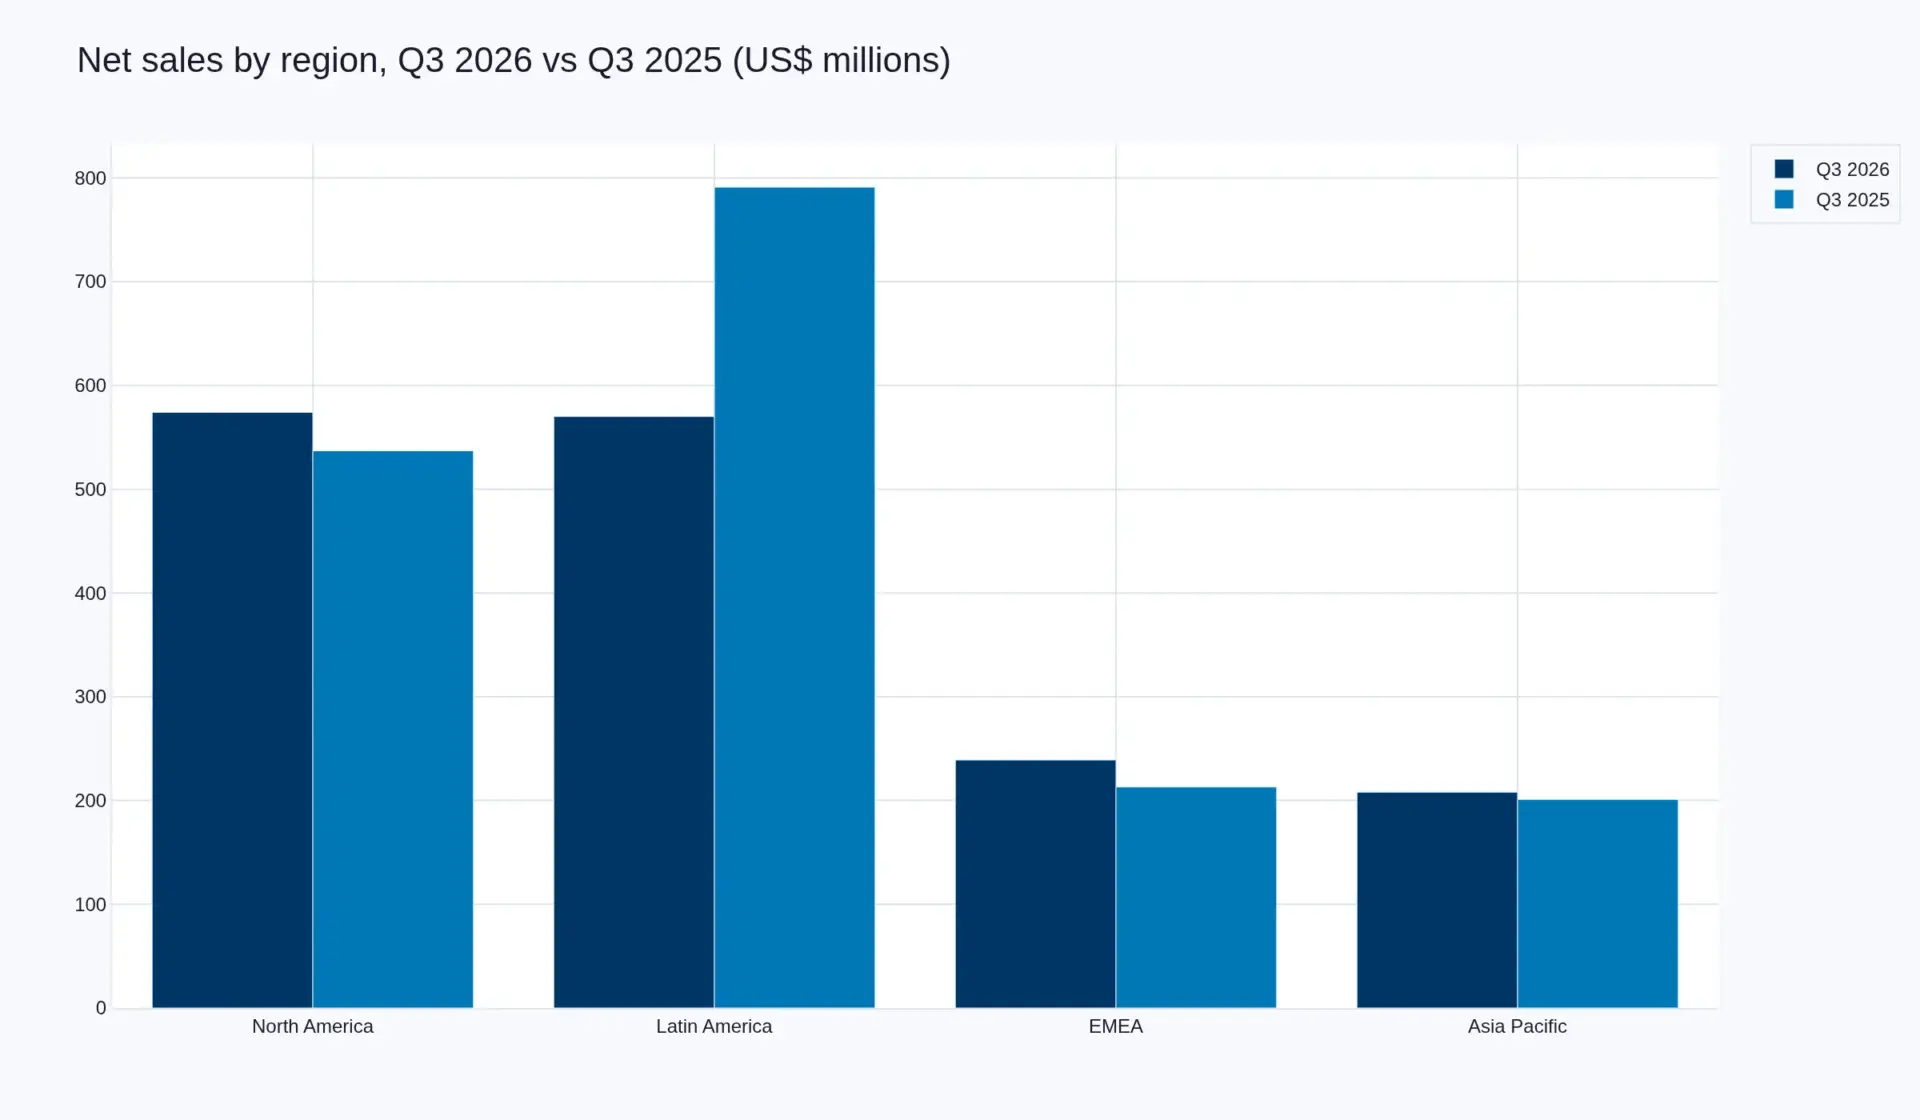
Corteva sells crop protection chemistry and biologicals and earns revenue in four regions: North America, Latin America, EMEA and Asia Pacific. Its portfolio has four product lines — herbicides, insecticides, fungicides and biologicals — sold to growers through distributors, retailers and other channel partners. In the nine months to 30 September 2026, on an adjusted pro forma basis that treats the seed business as discontinued, net sales were US$5,357m and adjusted pro forma operating EBITDA was US$943m, a margin of 17.6%. North America was the largest region at US$1,826m, ahead of EMEA at US$1,438m and Latin America at US$1,403m, with Asia Pacific at US$690m.
|
US$17,400m FY2025 net sales, combined group — the last full year before the separation |
US$3,850m FY2025 operating EBITDA, a 22.13% margin |
US$5,357m Nine months to 30 September 2026, adjusted pro forma — down 1% |
US$1.10–1.125bn FY2026 guidance, adjusted pro forma operating EBITDA |
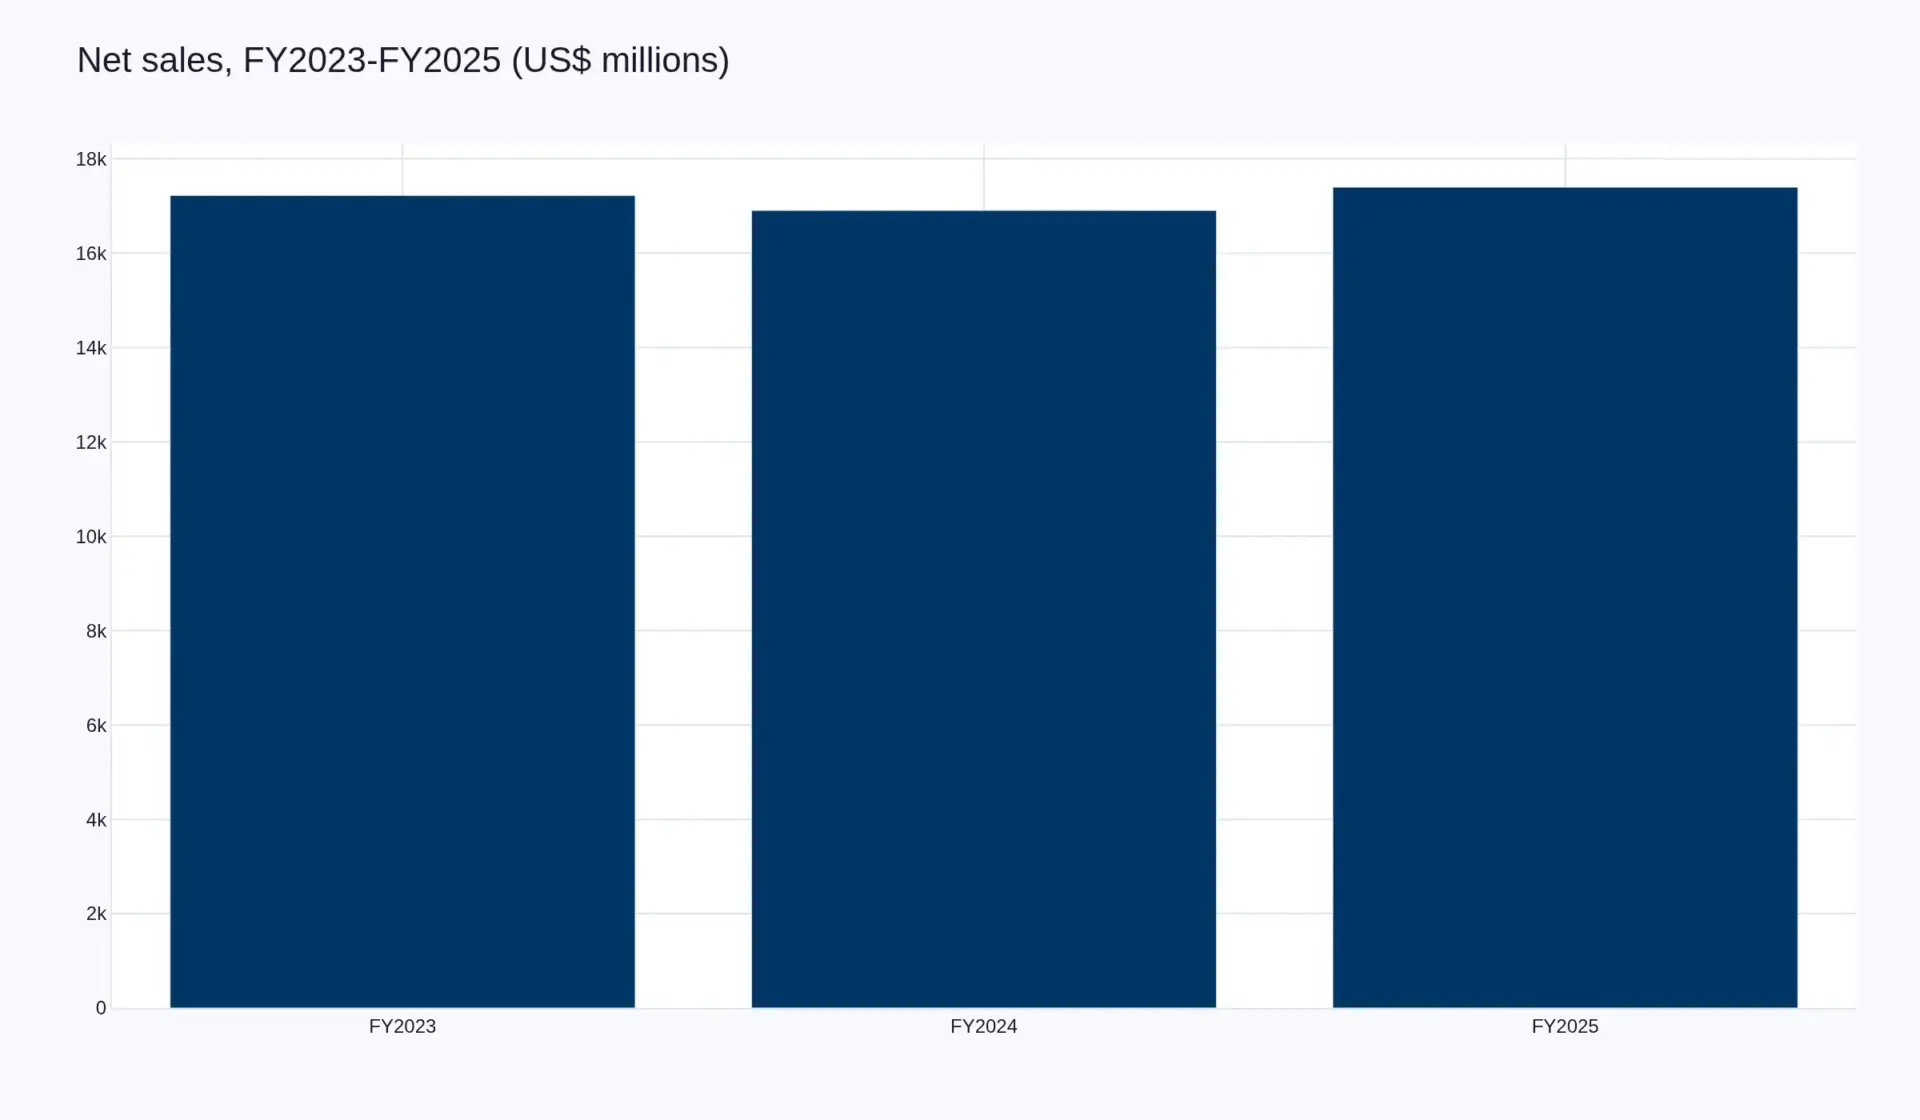
The company’s reported history divides at the separation. As a combined group it reported net sales of US$17,226m in FY2023, US$16,908m in FY2024 and US$17,400m in FY2025. Seed was the larger and more profitable segment: 56.45% of FY2024 net sales at a 23.25% segment operating EBITDA margin, against 17.28% in crop protection. Post-separation, the company guides to US$1.10–1.125bn of adjusted pro forma operating EBITDA for FY2026, a midpoint equal to 28.9% of the FY2025 combined figure. The company has not published a comparable full-year pro forma sales outlook.
Key Highlights
| Period | Highlight |
|---|---|
| FY2025, combined group | Net sales US$17,400m (+2.91% on FY2024), operating EBITDA US$3,850m at a 22.13% margin, operating EPS US$3.34, free cash flow US$2,900m and more than US$1.5bn returned to shareholders. |
| 1 October 2026 | The seed segment was separated into Vylor Inc. (NYSE: VYLR). Luke Kissam became chief executive of Corteva and Jeff Rudolph chief financial officer; four directors and four officers departed. |
| Nine months to 30 September 2026 | Adjusted pro forma: net sales US$5,357m (−1%), operating EBITDA US$943m (flat), margin 17.6% (+30 basis points), operating EPS US$0.76 (+49%). |
| Q3 2026 | Adjusted pro forma: net sales US$1,591m (−9%), operating EBITDA US$222m (−17%), margin 14.0% (−140 basis points). Price −7%, volume −2%; Latin America organic sales −31%. |
| FY2026 guidance | Adjusted pro forma operating EBITDA of US$1.10–1.125bn and adjusted pro forma operating EPS of US$0.76–0.80. |
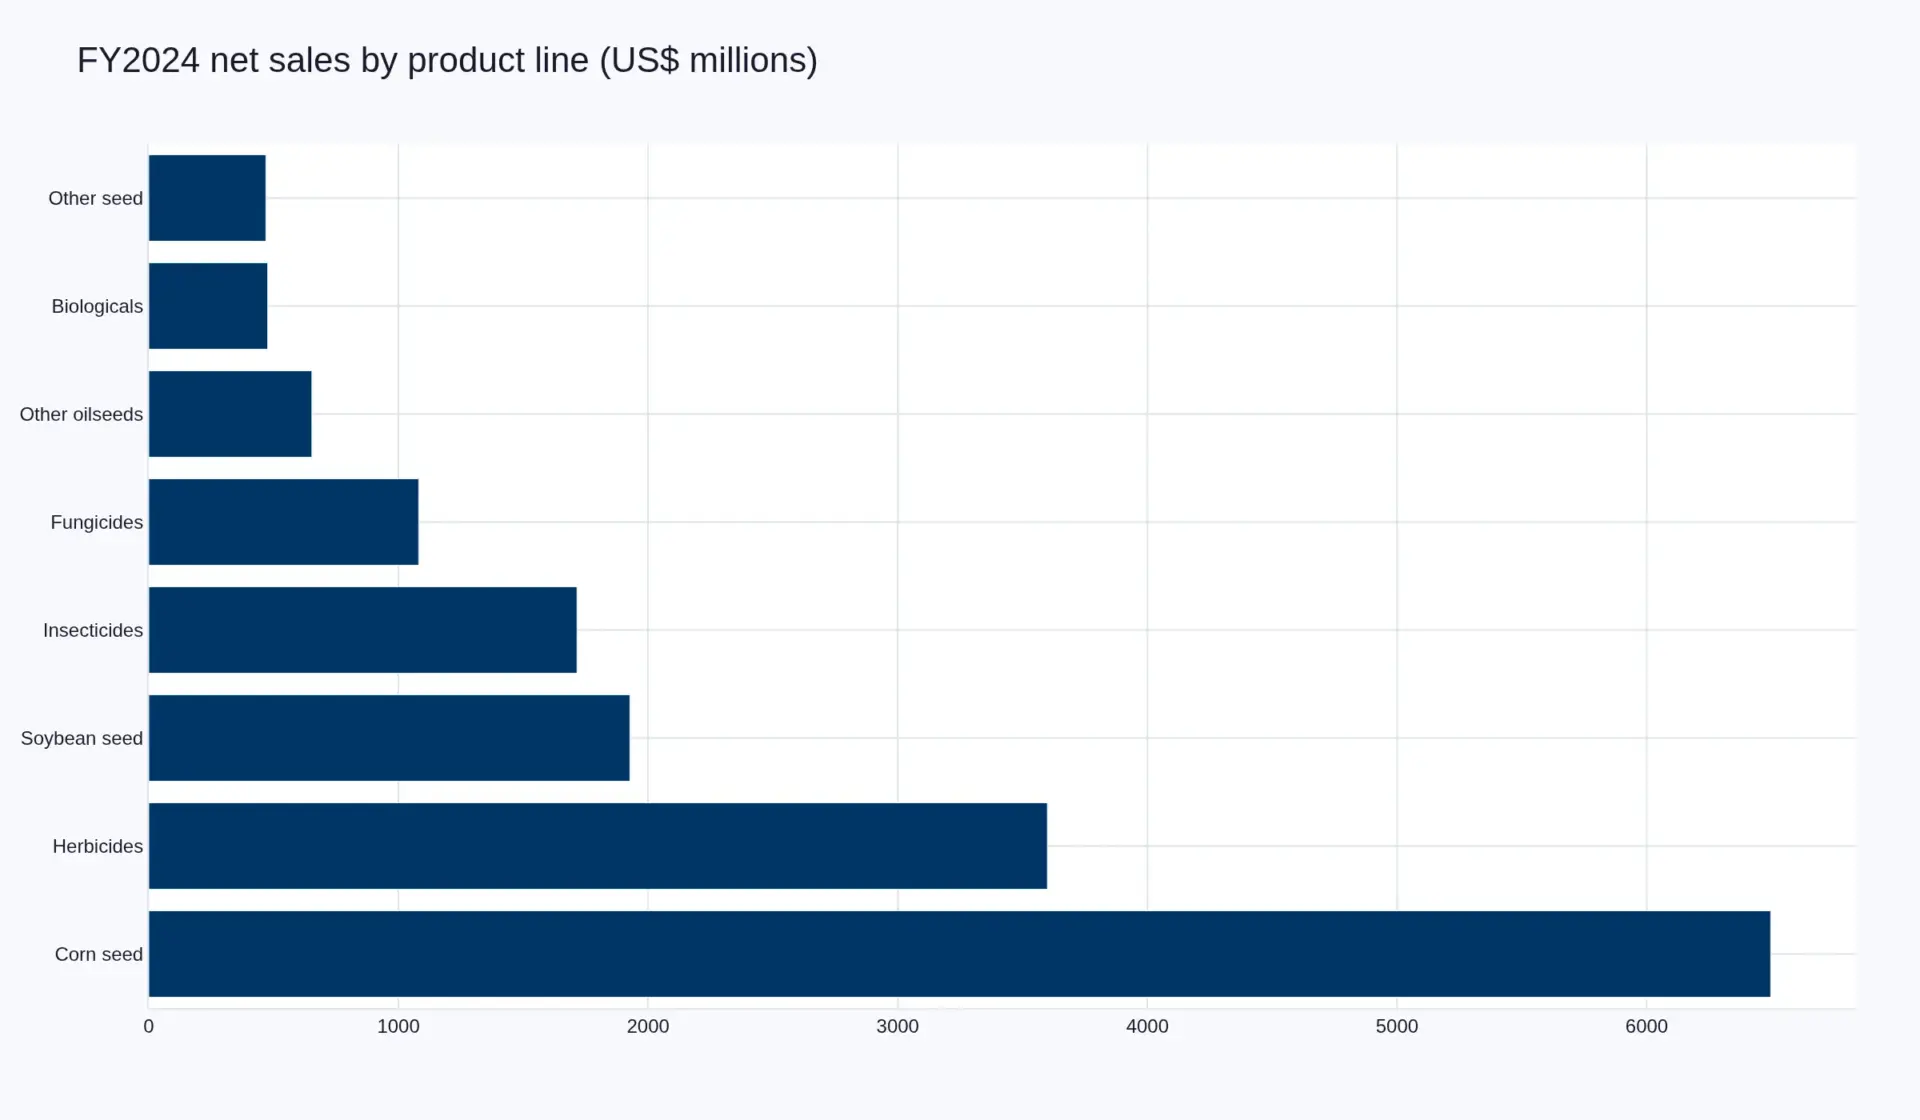
| FY2024 product-line detail | Last published split: corn seed US$6,496m, herbicides US$3,599m, soybean seed US$1,927m, insecticides US$1,715m, fungicides US$1,081m, biologicals US$476m. |
Company Overview
Business Description
Corteva’s crop protection business is organised into four product lines. Herbicides are the largest at US$3,599m of FY2024 net sales, followed by insecticides at US$1,715m, fungicides at US$1,081m and biologicals at US$476m. The company sells to growers through channel partners, and its quarterly results are sensitive to distributor inventory positions and to farmer financing conditions in its largest markets; the third quarter of 2026 release attributes the Latin American decline to elevated channel inventory and delayed purchasing.
Until 1 October 2026 the company also owned a seed business — corn, soybean, other oilseeds and other seed, including the Pioneer genetics operation — that represented 56.45% of FY2024 net sales. That business now trades as Vylor Inc. Corteva’s product-line revenue disclosure has not been published since the separation, so FY2024 remains the last complete account of what the portfolio is made of.
| Product line | FY2024 (US$m) | FY2023 (US$m) | Change |
|---|---|---|---|
| Seed — now Vylor Inc. | |||
| Corn | 6,496 | 6,447 | +1% |
| Soybean | 1,927 | 1,858 | +4% |
| Other oilseeds | 653 | 708 | −8% |
| Other seed | 469 | 459 | +2% |
| Crop Protection — retained | |||
| Herbicides | 3,599 | 4,034 | −11% |
| Insecticides | 1,715 | 1,598 | +7% |
| Fungicides | 1,081 | 1,112 | −3% |
| Biologicals | 476 | 491 | −3% |
| Seed total | 9,545 | 9,472 | +1% |
| Crop protection total | 7,363 | 7,255 | +1% |
Organisational Structure and Footprint
The separation replaced the group’s executive team and part of its board. Luke Kissam, previously chief executive of Albemarle, joined Corteva on 1 June 2026 to lead the crop protection business before the split and became chief executive of the listed company on 1 October 2026. Four directors — Charles Magro, Kerry Preete, Marcos Lutz and Karen Grimes — resigned at the effective time, Kissam joining the board in their place. Four officers, including Magro and chief financial officer David Johnson, left to lead Vylor.
| Name | Position |
|---|---|
| Luke Kissam | Chief executive officer and director; previously chief executive of Albemarle, joined 1 June 2026 |
| Jeff Rudolph | Chief financial officer |
| Brook Cunningham | Chief commercial officer |
| Ralph Ford | Chief integrated operations officer |
| Patrick Ward | Director; chair of the audit committee |
| David Everitt | Director; chair of the people and compensation committee |
| Departed at separation | Directors Charles Magro, Kerry Preete, Marcos Lutz and Karen Grimes; officers Magro, David Johnson, Sam Eathington and Tim O’Connor, who left to lead Vylor |
Corteva remains at its Zionsville Road headquarters in Indianapolis, where about 1,500 of the roughly 22,000 people employed by the pre-separation group worked. Vylor is headquartered at Corteva’s former campus in Johnston, Iowa, where the group had about 3,000 employees. The two companies provide services to one another under transition agreements disclosed in the separation filings.
| Region | Q3 2026 | Q3 2025 | Reported | Organic | 9M 2026 | 9M 2025 | Organic |
|---|---|---|---|---|---|---|---|
| North America | 574 | 537 | +7% | +7% | 1,826 | 1,821 | flat |
| Latin America | 570 | 791 | −28% | −31% | 1,403 | 1,601 | −18% |
| EMEA | 239 | 213 | +12% | +14% | 1,438 | 1,345 | +1% |
| Asia Pacific | 208 | 201 | +3% | +5% | 690 | 652 | +7% |
| Total | 1,591 | 1,742 | −9% | −9% | 5,357 | 5,419 | −4% |
Financial Performance
Key Financial Highlights
Two bases of presentation appear on this page and they are not comparable. FY2023 to FY2025 are consolidated figures for the group including the seed segment, which was part of the company throughout those years. From the third quarter of 2026 the company reports adjusted pro forma figures, which treat the seed business as discontinued and restate the prior year on the same basis. Any comparison across the two bases is a comparison of two different companies.
| US$ millions unless stated | FY2023 | FY2024 | FY2025 |
|---|---|---|---|
| Net sales | 17,226 | 16,908 | 17,400 |
| of which organic sales | — | — | 17,560 |
| Operating EBITDA | — | 3,376 | 3,850 |
| GAAP income from continuing operations | — | 863 | 1,200 |
| GAAP earnings per share (US$) | — | 1.22 | 1.75 |
| Operating earnings per share (US$) | — | 2.57 | 3.34 |
| Cash from operations, continuing | — | — | 3,500 |
| Free cash flow | — | — | 2,900 |
| Dividends declared per share (US$) | — | 0.66 | — |
| Adjusted pro forma | Q3 2026 | vs Q3 2025 | 9M 2026 | vs 9M 2025 |
|---|---|---|---|---|
| Net sales | US$1,591m | −9% | US$5,357m | −1% |
| Organic sales | — | −9% | — | −4% |
| Operating EBITDA | US$222m | −17% | US$943m | flat |
| Operating EBITDA margin | 14.0% | −140 bps | 17.6% | +30 bps |
| Operating EPS | US$0.06 | −57% | US$0.76 | +49% |
| GAAP income (loss) from continuing operations | US$(54)m | n.m. | US$112m | −68% |
|
22.13% Operating EBITDA margin, FY2025 consolidated |
28.9% FY2026 guidance midpoint as a share of FY2025 consolidated operating EBITDA |
17.6% Operating EBITDA margin, nine months to 30 September 2026, adjusted pro forma |
Revenue Breakdown
On the FY2024 filing, which is the last year with a complete segment and product-line breakdown, seed was 56.45% of net sales and crop protection 43.55%. Within crop protection, herbicides were the largest line at US$3,599m and the weakest, down 11% on FY2023; insecticides grew 7% to US$1,715m and both fungicides and biologicals declined 3%.
| Segment | Net sales (US$m) | Share of group | Segment EBITDA (US$m) | Segment margin |
|---|---|---|---|---|
| Seed — now Vylor | 9,545 | 56.45% | 2,219 | 23.25% |
| Crop protection — retained | 7,363 | 43.55% | 1,272 | 17.28% |
| Total | 16,908 | 100% | 3,491 | — |
FY2025 segment split. The FY2025 release disclosed segment growth rates (Seed +4% net, Crop Protection +2% net) rather than absolute segment sales. Applying those rates to the audited FY2024 base gives approximately US$9,927m for Seed and US$7,473m for Crop Protection. Those two figures are derived, carry rounding of up to US$50m, and are used on this page only where marked as approximations.
Profitability Analysis
The margin structure the company took into the separation was set by the segment it gave up. In FY2024, seed earned a 23.25% segment operating EBITDA margin against 17.28% in crop protection — nearly six points higher on the same filing. What remains with Corteva is therefore the lower-margin half, at a smaller revenue base.
FY2025 performance inside the combined group was driven by two different mechanisms. Seed grew 3% on price and 2% on volume. Crop protection grew 5% on volume and gave up 2% on price. In the third quarter of 2026, the first reported quarter as a crop protection company, price fell 7% while volume fell 2%, with the pricing decline attributed to competitive pressure on molecules late in their lifecycle in Brazil and to acetochlor in the United States; North America volume rose 19% and EMEA organic sales rose 14% in the same quarter.
Cash generation at the combined group was substantial: US$3,500m from continuing operations and US$2,900m of free cash flow in FY2025, up 69%, with more than US$1.5bn returned to shareholders. No full-year cash flow figure has been published for the post-separation company; the board authorised its first dividend as a stand-alone company in November 2026.
SWOT Analysis
|
|
||||
|
|
Recent Developments
Strategic Moves
| Date | Development |
|---|---|
| 1 Oct 2025 | Board unanimously approves a tax-free separation into two public companies: seed (“SpinCo”) and crop protection (“New Corteva”). Legacy liabilities, including the historical DuPont pension plan and PFAS obligations, are to be retained by New Corteva. Dis-synergies estimated at US$80–100m. |
| Feb 2026 | Corteva finalises a comprehensive resolution of litigation with Bayer, giving multi-year clarity on trait access and licensing, accelerating the path to royalty neutrality to 2026 and supporting a US$1bn net royalty income target by 2035. |
| 14 Apr 2026 | Leadership named for both companies: Luke Kissam to lead New Corteva with Jeff Rudolph as chief financial officer; Chuck Magro to lead the seed company with David Johnson as chief financial officer. |
| 1 Jun 2026 | Kissam joins the company as chief executive of the crop protection business, ahead of the separation. |
| 14 Sep 2026 | Board approves the distribution of Vylor shares; record date 24 September 2026. |
| 1 Oct 2026 | Separation effective at 12:03am New York time. Vylor Inc. becomes an independent NYSE-listed company under VYLR. Kissam appointed chief executive and a director; Rudolph chief financial officer; Cunningham chief commercial officer; Ford chief integrated operations officer. Magro, Preete, Lutz and Grimes resign from the board; Magro, Johnson, Eathington and O’Connor resign as officers. |
Financial Developments
| Date | Development |
|---|---|
| 3 Feb 2026 | FY2025 results for the combined group: net sales US$17,400m (+3% reported, +4% organic), operating EBITDA US$3,850m (+14%), operating EPS US$3.34 (+30%), free cash flow US$2,900m (+69%). Consolidated 2026 guidance set at US$4.0–4.2bn of operating EBITDA — the last guidance issued for the combined company. |
| 11 Nov 2026 | First quarterly report as a crop protection company. Adjusted pro forma net sales US$1,591m (−9%), operating EBITDA US$222m (−17%), margin 14.0% (−140 basis points), GAAP loss from continuing operations US$(54)m. Nine-month net sales US$5,357m (−1%), operating EBITDA US$943m (flat), operating EPS US$0.76 (+49%). FY2026 guidance set at US$1.10–1.125bn of adjusted pro forma operating EBITDA and US$0.76–0.80 of adjusted pro forma operating EPS. |
| Nov 2026 | Board authorises the first common dividend since the separation. |
| 12 Nov 2026 | Vylor reports its first quarter as a stand-alone company: nine-month net sales US$8.5bn (+4%) and operating EBITDA US$2.7bn (+8%), with full-year guidance reaffirmed at approximately US$10.4bn of sales and US$2.8bn of operating EBITDA. |
Business Strategy
Global Strategy
The company describes its operating priorities as differentiated innovation, productivity and disciplined execution, and its separation case as greater focus on crop protection with growth through new products, biologicals and cost reduction. The measurable elements of that programme, as disclosed:
| Pillar | What the company discloses |
|---|---|
| Innovation in the existing portfolio | New product sales are credited with the regional growth in Q3 2026: North America volume +19%, EMEA organic sales +14% and Asia Pacific organic +5%, with price held flat in EMEA. |
| Productivity and cost | Nine-month 2026 adjusted pro forma operating EBITDA was flat on a 4% organic sales decline, with margin up 30 basis points to 17.6% — the only year-on-year margin expansion disclosed since the separation. Separation dis-synergies were estimated at US$80–100m. |
| Portfolio focus | Four product lines only, and no seed business after 1 October 2026. Biologicals at US$476m are the smallest line and the one the company identifies as a growth avenue. |
| Licensing and royalties | The Bayer settlement accelerated royalty neutrality to 2026 and underpins a US$1bn net royalty income target by 2035. |
| Capital returns | A first post-separation dividend was authorised in November 2026; the combined group returned more than US$1.5bn to shareholders in FY2025. |
Focus-Market Strategy
Regional disclosure is where the strategy meets its constraints, because the four regions are performing very differently in the same year.
| Region | 9M 2026 sales (US$m) | 9M organic | Q3 organic | What drives it |
|---|---|---|---|---|
| North America | 1,826 | flat | +7% | Volume rose 19% in the quarter on new products and early demand, absorbing the acetochlor pricing headwind; management described acetochlor pricing as consistent with expectations. |
| Latin America | 1,403 | −18% | −31% | Elevated channel inventory and delayed purchasing under farmer liquidity constraints and high interest rates in Brazil, with price down 7% on mature molecules. |
| EMEA | 1,438 | +1% | +14% | Demand for new and differentiated products, with price held flat in the quarter. |
| Asia Pacific | 690 | +7% | +5% | Volume up 7% in the quarter against price down 2% in a competitive market. |
Position in the markets we model
Pheonix Research publishes its own market models for the markets this company sells into, so a company’s disclosed revenue can be divided by an independently built market size to give an implied share with a denominator the company did not choose. These are Pheonix arithmetic on two published inputs, not company statements.
| Market we model | Our 2025 size | Our 2033 forecast | Our CAGR | Company revenue used | Implied share |
|---|---|---|---|---|---|
| Global crop protection market | US$72.40bn | US$100.00bn | 4.12% | ~US$7.5bn (FY2025 segment) | 10.36% |
| Global agricultural biologicals market | See linked model | See linked model | — | US$0.48bn (FY2024 biologicals line) | See linked model |
| Global seed market | US$78.40bn | US$118.95bn | 5.35% | ~US$9.9bn (FY2025 seed segment, now Vylor) | 12.63% |
| Global corn (maize) seed market | US$24.60bn | US$35.25bn | 4.60% | US$6.50bn (FY2024, now Vylor) | 27.62% |
| Global soybean seed market | US$12.60bn | US$17.40bn | 4.12% | US$1.93bn (FY2024, now Vylor) | 15.93% |
The corn and soybean rows pair audited FY2024 product-line revenue with a 2024 market derived by deflating our 2025 base at our own published CAGR — US$23.52bn for corn and US$12.10bn for soybeans. Those are the only like-for-like pairings available for product lines, because the company has not published that detail since the separation.
| Our model | Value CAGR | Volume CAGR | Implied price CAGR | Company’s FY2025 realisation |
|---|---|---|---|---|
| Global corn (maize) seed | 4.60% | 1.11% | +3.46% | Price +3%, volume +2% |
| Global crop protection | 4.12% | 1.88% | +2.20% | Price −2%, volume +5% |
Read beside the company’s own disclosure, the seed business realised pricing in line with the price path our corn seed model implies, while crop protection gave up price in a market our model suggests can carry modest annual price growth. That difference in pricing environment is the clearest quantitative distinction between the two businesses as they now stand separately.
Data status
Corteva’s former seed business now trades as Vylor Inc. and does not yet carry its own Wikidata identifier. Market reports that name Vylor — including our Global Corn (Maize) Seed report, which lists it as the second-ranked competitor as “Vylor (Corteva Seed & Genetics)” — currently bind that mention to Q63197674, the identifier for Corteva, Inc. A dedicated identifier for Vylor is pending; until it is minted, seed-market revenue shares attributed to this entity include the separated business. That resolution is in progress and will be reflected on this page.
Sources
- Form 8-K, completion of separation, 1 October 2026 — SEC EDGAR
- Vylor Inc. Form 8-K, distribution of shares, 1 October 2026 — SEC EDGAR
- Third quarter 2026 results and updated outlook, 11 November 2026 — SEC EDGAR / PR Newswire
- Corteva reports third-quarter 2026 results — PR Newswire
- Full year 2025 results, 3 February 2026 — PR Newswire
- FY2024 consolidated segment information — SEC EDGAR
- Fourth quarter and full year 2024 results — SEC EDGAR
- Corteva completes split of crop protection and seed businesses — Inside INdiana Business / Indianapolis Business Journal, 1 October 2026
- Corteva splits in two — Hoosier Ag Today, 4 October 2026
- Vylor Q3 2026 earnings call transcript — Investing.com
- corteva.com — company announcements and press releases
- Corteva investor relations — filings, results presentations and webcasts
- Wikidata Q63197674 — entity identifier and aliases
- Corteva logo, File:Corteva logo.svg — Wikimedia Commons
Provenance. Entity resolution: Wikidata Q63197674, bound to Pheonix graph entity MIEN-node_8b2eea48. Financial figures are company-reported and linked to the filing or release they came from; they have not been restated. Market sizes, forecasts and CAGRs are Pheonix Research models and link to the report they come from. Implied shares, margins and the value/volume/price decompositions are Pheonix arithmetic on those two sets of inputs. Where a figure is derived rather than reported — the FY2025 segment split, the 2024 denominators in the implied-share table — the page says so in place. Last verified 13 November 2026.
Market Presence
Corteva, Inc. is mentioned across 6 market reports.
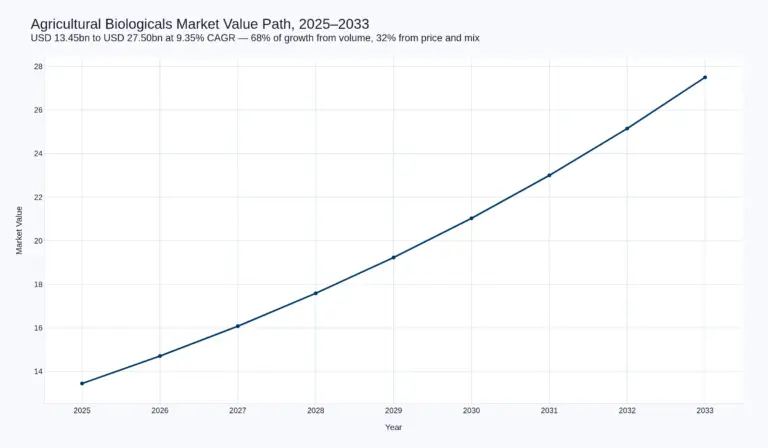
Global Agricultural Biologicals (Biopesticides & Biostimulants) Market Report, Size, Share and Forecast 2026–2033
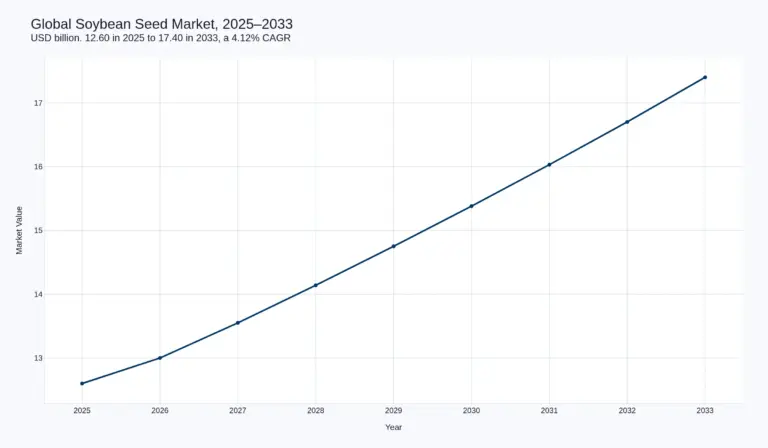
Global Soybean Seed Market Report, Size, Share and Forecast 2026–2033
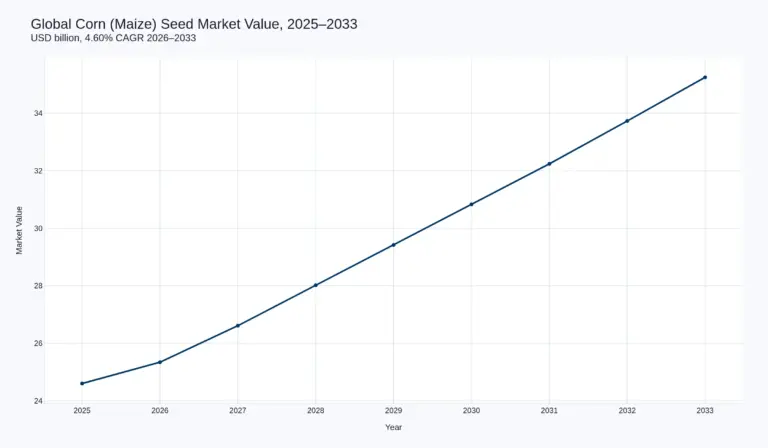
Global Corn (Maize) Seed Market Report, Size, Share and Forecast 2026–2033
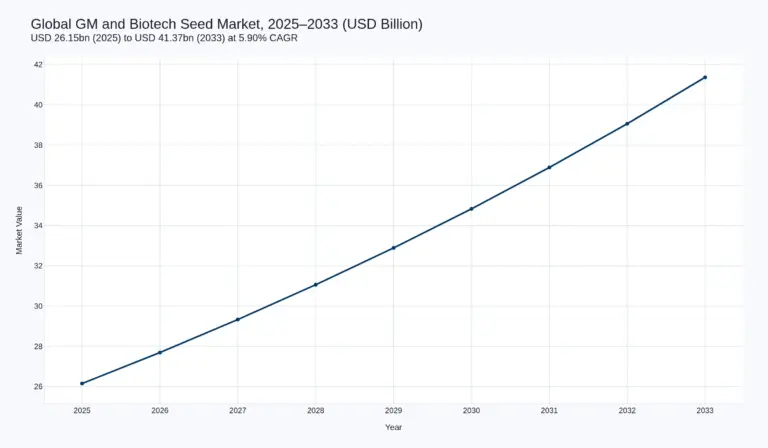
Global Genetically Modified and Biotech Seeds Market Report, Size, Share and Forecast 2026–2033
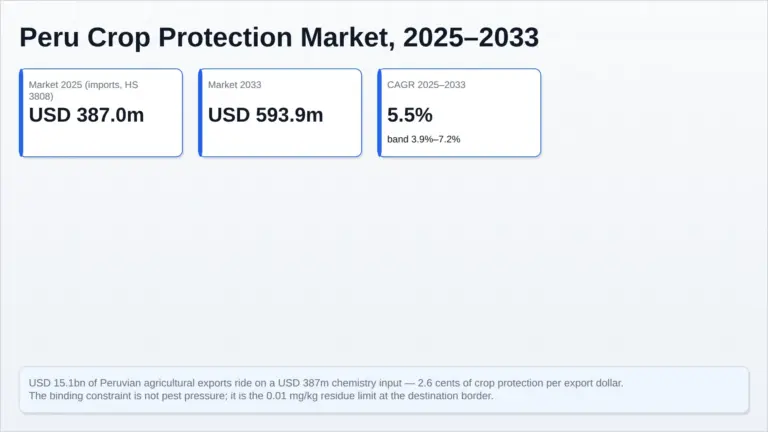
Peru Crop Protection Market Report, Size, Share and Forecast 2026–2033
