
Global Sustainable Investing Market Report, Size, Share and Forecast 2026-2033: USD 84 Billion Left the Funds and the Assets Still Rose to USD 3.9 Trillion
The market that reported a loss and posted a record
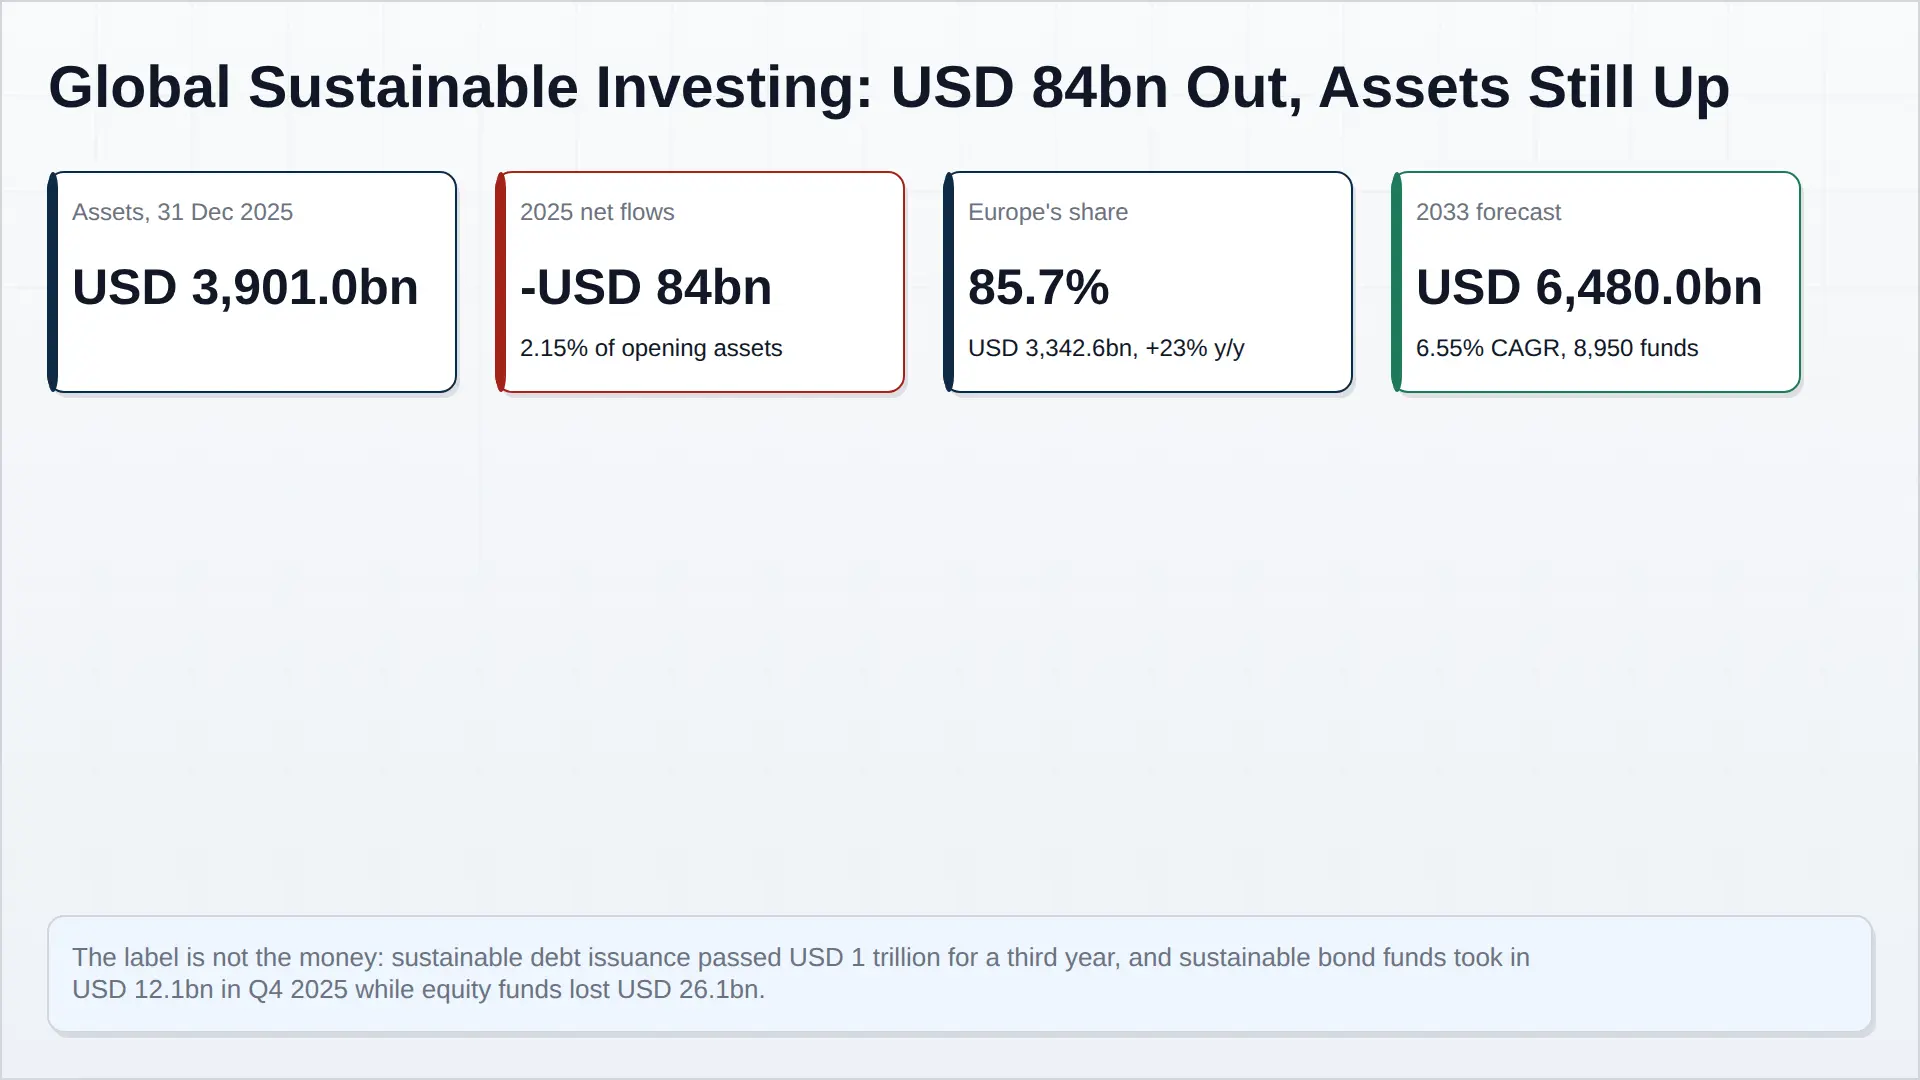
In 2025 the global sustainable fund market recorded its first annual net redemption since 2018. Investors pulled USD 84 billion more than they added, a reversal from USD 38 billion of inflows in 2024 and a swing of USD 122 billion in twelve months. Any conventional reading of that number says the category is in retreat. The assets say otherwise: they finished the year at USD 3,901.0 billion across 7,064 funds, up on 2024, with Europe at an all-time high of USD 3,342.6 billion after a 23 per cent annual gain.
Both figures are correct because net flow and asset growth are no longer operating at comparable scale. A USD 84 billion redemption against a USD 3.9 trillion base is 2.15 per cent. A 23 per cent market return is eleven times larger. In a market this size, the sentiment signal in the flow number and the economic reality in the asset number have separated: flows now measure the mood of the marginal retail buyer, while assets measure the accumulated stock that institutions have not sold.
What actually left, and where it went
The composition of the outflow is more informative than its size. Sustainable equity funds lost USD 26.1 billion in the fourth quarter; sustainable bond funds gained USD 12.1 billion. Sustainable passive funds recorded their first full year of net outflows at USD 35.1 billion, against USD 48.9 billion from active vehicles. The buyers did not stop buying sustainability; they stopped buying it in the wrapper that had been priced on a story and started buying it in the wrapper priced on a yield.
That rotation has an external corroboration that is hard to argue with. Aligned green bond issuance reached USD 653.5 billion in 2025, the second-highest annual volume ever recorded, and total aligned GSS+ issuance passed USD 1 trillion for the third consecutive year, taking the cumulative stock to USD 6.8 trillion. Debt capital markets are not sentimental. A green bond is bought by investors who need duration, credit exposure and, increasingly, a use-of-proceeds framework they can audit. The fact that this market grew while equity fund flows turned negative is the single clearest piece of evidence that 2025 was a rotation, not a withdrawal.
The relabelling effect is now large enough to move the statistics
The second mechanism is administrative rather than economic. European fund naming rules forced managers to substantiate the words in their product names, and the industry responded by changing the words. Between January 2024 and September 2025 at least 1,450 European funds were renamed, roughly 31 per cent of those in scope, with 121 renamings in the third quarter of 2025 alone and 64 of those dropping ESG language. A rename moves assets out of the measured sustainable universe without a single redemption. At 31 per cent of the in-scope population, that effect is no longer a rounding error; it is a material driver of the reported size of the market, and it will keep suppressing measured growth through 2027 as the remaining funds align their names with their holdings.
Three boundaries, moving at once
Three regulatory processes ran in parallel in 2025 and early 2026, and they do not point in the same direction. The EU tightened the definition of a sustainable fund through the ESMA naming guidelines while loosening the definition of a reporting company through the Omnibus simplification, approved by the Council in February 2026, which raised the CSRD threshold to companies above 1,000 employees and €450 million in turnover. The United States moved in the opposite direction, withdrawing federal climate disclosure requirements and allowing its sustainable fund market to shrink for a thirteenth consecutive quarter.
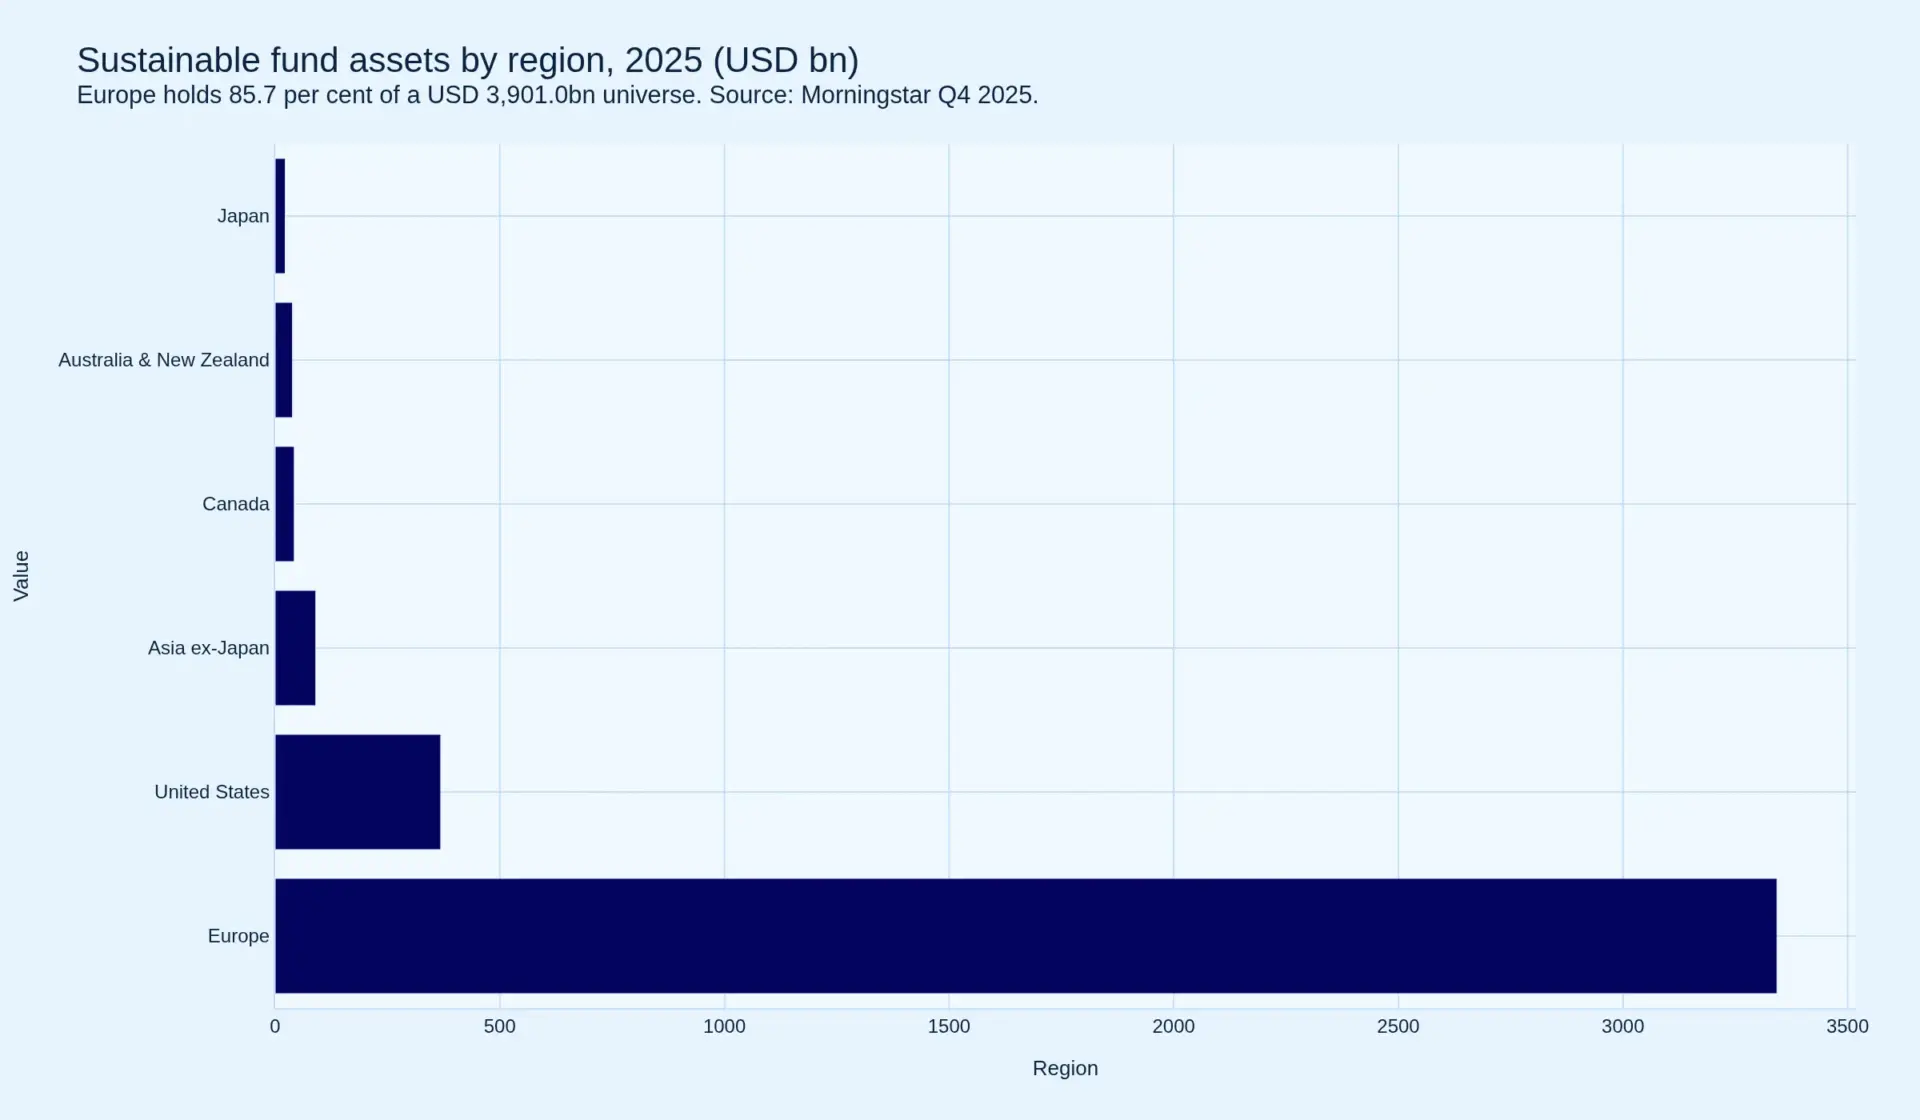
The consequence for anyone sizing this market is uncomfortable but simple: the measured total is now a function of regulatory geography. Europe holds 85.7 per cent of global sustainable fund assets and 74.1 per cent of the products, and sustainable funds are roughly 20 per cent of the European fund universe against about 1 per cent of the American one. That twenty-fold gap is not a difference in investor values. It is a difference in what the two jurisdictions require a product to be called.
Forecast and commercial consequence
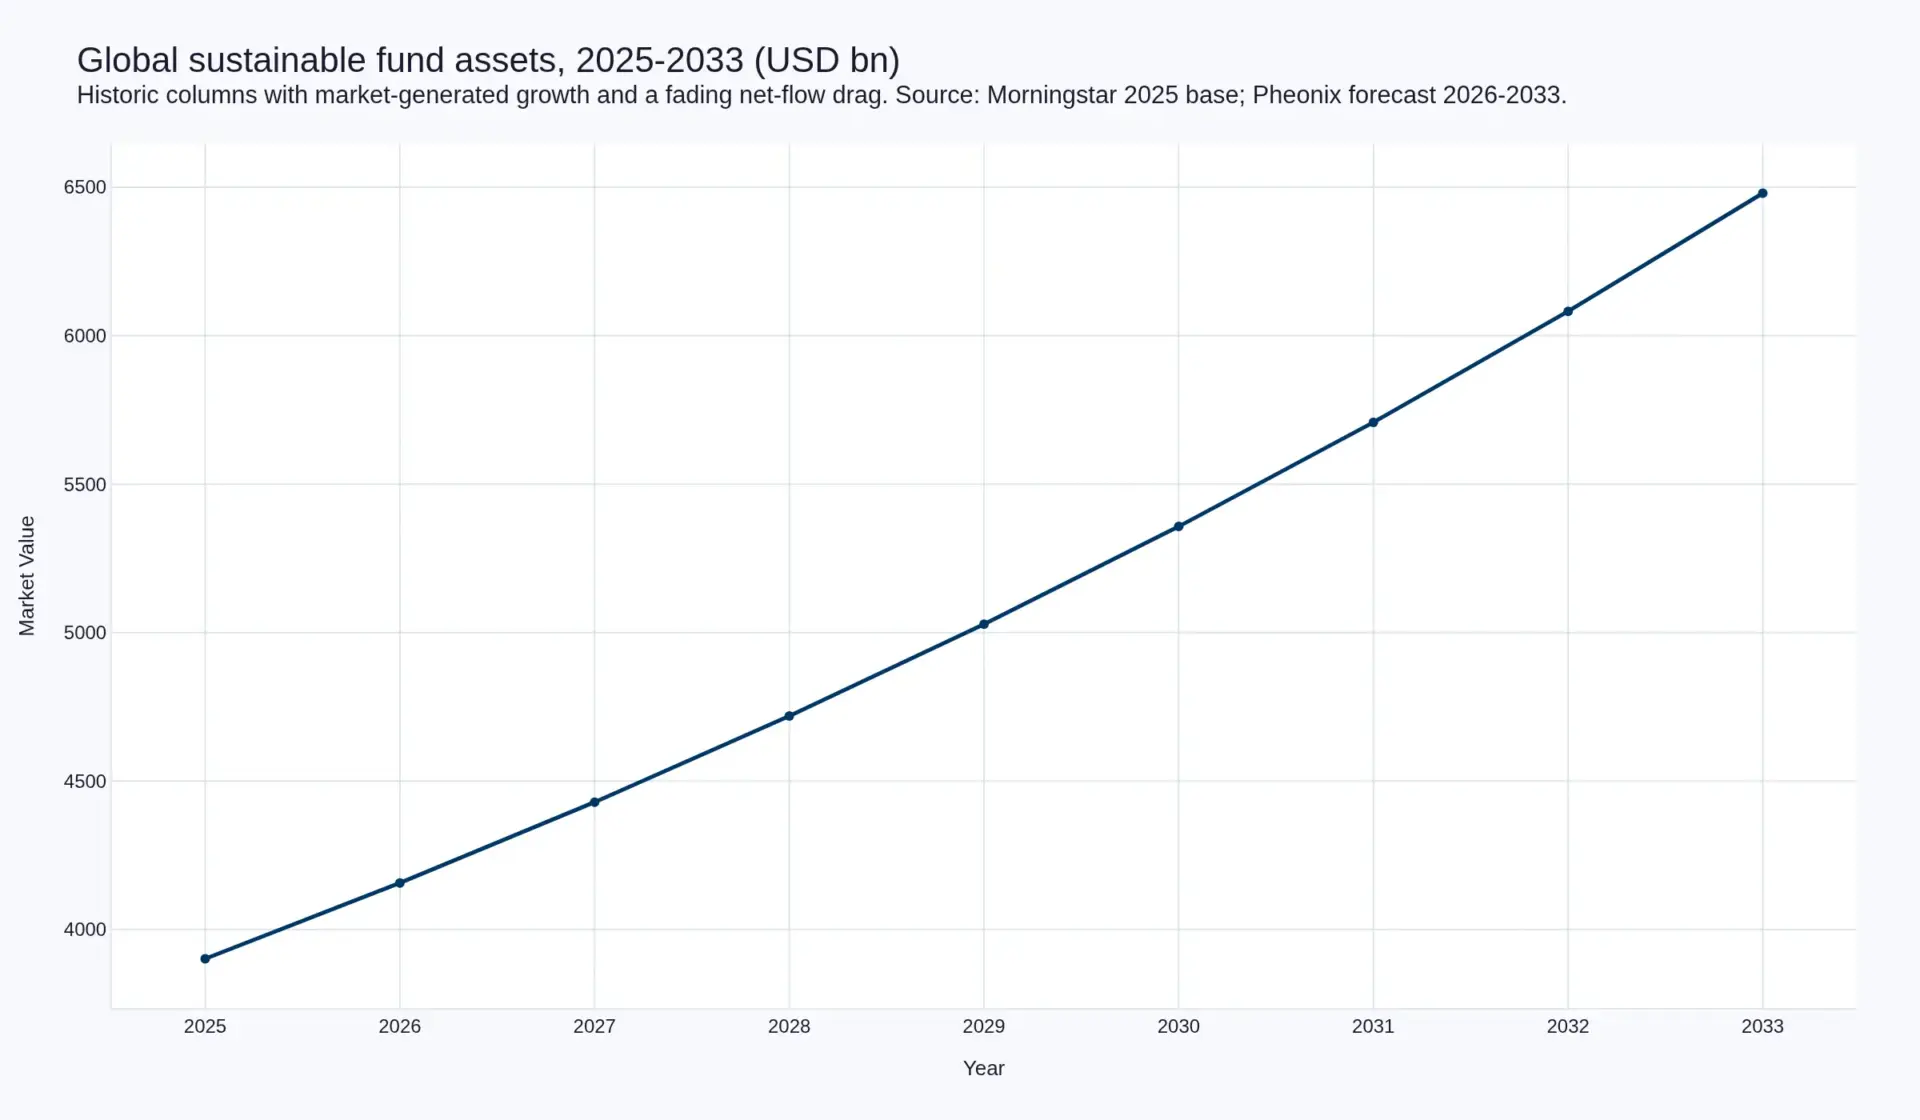
Pheonix models the fund universe reaching USD 6,480.0 billion by 2033 at a 6.55 per cent CAGR, with the product count growing at only 3.00 per cent to 8,950 funds. The gap between those two rates is the forecast's substance: the industry will consolidate into fewer, larger vehicles, with average assets per fund rising from USD 552.2 million to USD 724.0 million.
Revenue will lag assets. On a Pheonix estimate of 38 basis points of average fee in 2025, compressing to about 34 basis points by 2033 as fixed income and passive take share, the sustainable fund fee pool grows from USD 14.82 billion to USD 22.03 billion, a 5.08 per cent CAGR against 6.55 per cent on assets. The ten largest franchises already hold USD 1,585.0 billion, 40.6 per cent of the universe, and BlackRock alone holds 11.6 per cent. Scale is the only reliable defence in a market where the product is commoditising and the label is depreciating.
The strategic question
For an asset manager, the decision is whether to compete in labelled products where fees compress and the regulatory perimeter keeps moving, or in customised mandates where fees hold but the assets become invisible to every statistic including the manager's own marketing. For a data provider, the decision is harder: the compliance customer base has just been cut by an order of magnitude, and the growth must come from risk analytics sold to investors rather than disclosure analysis sold to issuers. Both decisions are downstream of one judgement — whether sustainable investing is a product category or an investment technique. The 2025 data suggests the second, and the industry has not yet repriced for it.
Sustainable investing had the strangest year of its short institutional life in 2025. Investors withdrew a net USD 84 billion from sustainably-labelled funds and exchange-traded products — the first annual net redemption since 2018, and a reversal from USD 38 billion of inflows in 2024. In the same twelve months the assets in those funds rose, ending at USD 3,901.0 billion across 7,064 products, with Europe at a record USD 3,342.6 billion. Meanwhile sustainable debt issued into the market for the third consecutive year above USD 1 trillion, and the cumulative stock of aligned green, social, sustainability and sustainability-linked debt reached USD 6.8 trillion.
There is no contradiction in those numbers once the market is read correctly. The label is not the money. Redemptions were concentrated in equity funds and in products whose names had been doing the work that evidence was supposed to do. The capital that left one wrapper reappeared in another — in sustainable fixed income, which took in USD 12.1 billion in the fourth quarter alone while sustainable equity funds lost USD 26.1 billion, and in segregated mandates that no fund-flow statistic can see. Between January 2024 and September 2025, more than 1,450 European funds were renamed, roughly 31 per cent of those in scope: renamings do not move a dollar, but they move a dollar out of the measured universe, and 2025 was the year that accounting effect arrived in the data.
Market snapshot and definition
This report measures the market at its narrowest defensible boundary: assets under management in funds and exchange-traded products that are marketed, labelled or regulated as sustainable, ESG, impact or transition, at year-end. On that definition the market is USD 3,901.0 billion in 2025 and USD 6,480.0 billion in 2033, a 6.55 per cent compound annual growth rate. The product count grows far more slowly, from 7,064 to 8,950 at 3.00 per cent, which means the average vehicle carries USD 724.0 million by 2033 against USD 552.2 million now — a 31.1 per cent increase in the size of the typical fund.
| Metric | 2025 | 2033 | CAGR |
|---|---|---|---|
| Assets under management (USD bn) | 3,901.0 | 6,480.0 | 6.55% |
| Sustainably-labelled funds (number) | 7,064 | 8,950 | 3.00% |
| Assets per fund (USD m) | 552.2 | 724.0 | 3.45% |
| Net flows (USD bn) | −84.0 | +77.8 (Pheonix) | — |
| Fee pool (USD bn, Pheonix estimate) | 14.82 | 22.03 | 5.08% |
| Aligned sustainable debt, cumulative (USD tn) | 6.8 | not forecast | — |
The number that decides every other number
There are two credible measurements of "sustainable investing" and they differ by a factor of eight. The fund universe measured here is USD 3.9 trillion. The Global Sustainable Investment Alliance, which counts institutional mandates and internally managed portfolios as well as funds, last measured the market at USD 30.3 trillion across five major regions in its 2022 review — down from USD 35.3 trillion in 2020, a fall driven almost entirely by a methodology change in the United States, where the measured total went from USD 17.1 trillion to USD 8.4 trillion without a dollar leaving the country. Non-US markets grew 20 per cent over the same period.
| Measurement | What it counts | Size | Use it for |
|---|---|---|---|
| Fund universe (Morningstar) | Open-end funds, ETFs and ETPs explicitly labelled sustainable | USD 3.90tn | Flow analysis, product economics, fee pool |
| Total managed (GSIA, 2022) | Funds plus segregated mandates plus internally managed assets | USD 30.3tn | Addressable capital, institutional share of wallet |
| Regulated category (SFDR) | EU Article 8 and 9 funds, including non-sustainable ones that merely promote a characteristic | €6.8tn | Compliance burden, distribution constraint |
| Sustainable debt (Climate Bonds) | Aligned GSS+ bonds cumulative, not assets under management | USD 6.8tn | Balance-sheet-side transition capital |
Any statement of market size in this sector that does not name its measurement is a marketing statement. The USD 3.9 trillion figure is the one that can be tracked quarterly, reconciled to flows and priced. That is why this report forecasts it, and why it treats the USD 30.3 trillion figure as an addressable-capital ceiling rather than a market size.
Key findings
- The market shrank by flows and grew by performance. USD 84 billion left sustainable funds in 2025 — 2.15 per cent of opening assets — while European assets rose 23 per cent to a record. At this scale, return on assets and net flow are no longer in the same order of magnitude: net flow is roughly one-tenth as powerful as market movement.
- Fixed income absorbed the demand. Sustainable bond funds took in USD 12.1 billion in the fourth quarter of 2025 while sustainable equity funds lost USD 26.1 billion. Globally, aligned green bond issuance reached USD 653.5 billion in 2025, the second-highest annual volume on record, and GSS+ issuance exceeded USD 1 trillion for the third consecutive year.
- Passive lost its exemption. Sustainable passive funds recorded their first annual net outflows, USD 35.1 billion, against USD 48.9 billion from active. Passive had been the growth engine of the previous five years precisely because it was impossible to argue about a fee; that protection has ended.
- Renaming is now a market event. 121 European funds renamed in the third quarter of 2025 alone, 64 of them dropping ESG language; at least 1,450 renamings since January 2024, about 31 per cent of in-scope funds. "Sustainable" remains the most-used term in fund names at more than 860 funds, ahead of "ESG" at 709 and "transition" at roughly 310.
- Europe is the product; the United States is the counter-example. Europe holds 85.7 per cent of global sustainable fund assets and 74.1 per cent of the products. Sustainable funds are about 20 per cent of the European fund universe and about 1 per cent of the US one — a twenty-fold gap in penetration between two markets with comparable wealth. The United States recorded its thirteenth consecutive quarter of outflows in the fourth quarter of 2025.
- Concentration is the competitive reality. The ten largest sustainable fund franchises manage USD 1,585.0 billion, 40.6 per cent of the global universe. BlackRock alone holds USD 452.6 billion, 11.6 per cent of everything.
- The fee pool is growing half as fast as the assets. On a Pheonix estimate of 38 basis points on average assets, the sustainable fund fee pool is USD 14.82 billion in 2025, rising to USD 22.03 billion by 2033 as average fees compress to about 34 basis points. Assets grow 66 per cent; revenue grows 49 per cent.
- The regulatory base of the market is being cut back. Final Council approval in February 2026 of the EU's sustainability reporting simplification raised the CSRD threshold to companies above 1,000 employees and €450 million in turnover. The data providers who sell ESG disclosure analysis to those companies lose most of their customer list, years before their fund clients stop needing the analysis.
Regional distribution, 2025
| Region | Assets (USD bn) | Share | Funds | Q4 2025 flows (USD bn) |
|---|---|---|---|---|
| Europe | 3,342.6 | 85.7% | 5,231 | −2.0 |
| United States | 368.4 | 9.4% | 454 | −4.6 |
| Asia ex-Japan | 90.3 | 2.3% | 662 | −1.4 |
| Canada | 42.4 | 1.1% | 231 | −0.1 |
| Australia & New Zealand | 38.5 | 1.0% | 258 | +0.4 |
| Japan | 22.4 | 0.6% | 228 | −1.5 |
| Global | 3,901.0 | 100% | 7,064 | −13.4 |
Source: Morningstar, Global Sustainable Fund Flows, fourth quarter 2025. Regional totals are Morningstar's; shares are calculated here.
Where the capital went instead
The funds market is the visible half of sustainable finance and, in 2025, the shrinking half. The debt market is the growing one, and it has a different demand profile: a green bond is bought for its coupon and its structure first, and its environmental classification second. That ordering makes it far more resilient to the political weather that moved through the United States in 2025.
| Segment | 2025 volume | Direction |
|---|---|---|
| Green bonds | USD 653.5bn | 64% of aligned GSS+ issuance; cumulative above USD 4tn |
| Sustainability bonds | USD 217.3bn | Use-of-proceeds growth, sovereign-led |
| Social bonds | USD 141.2bn | Flat to lower; the pandemic-era cohort has matured |
| Sustainability-linked bonds | USD 14.0bn | +46% year on year from a small base, after two years of contraction |
| Aligned GSS+ total, 2025 | >USD 1tn | Third consecutive year above USD 1tn; cumulative USD 6.8tn |
Source: Climate Bonds Initiative, Global State of the Market 2025. Europe accounted for 45 per cent of annual GSS+ volume and USD 3 trillion of the cumulative total; Asia-Pacific issued USD 305.6 billion in 2025; issuance has now been recorded in 109 countries against a global bond market of more than USD 100 trillion.
What this report argues. Sustainable investing did not decline in 2025; it was reclassified. Three boundary-setting processes — European fund naming rules, the EU's reporting simplification, and US federal deregulation — moved at the same time, and each one shrank the measured market without touching the underlying capital. The commercial consequence is that the winners from here are not the managers with the best sustainability story. They are the managers with the cheapest compliant product in fixed income, and the data providers who can reprice from a shrinking compliance market into a growing risk market.
Related Pheonix research
- Sustainable Finance & ESG Investing — the segment page, covering funds, mandates, sustainable debt, ESG data and transition finance.
- Portable Hydrogen Fuel Cell Market — a transition-finance use-of-proceeds sector, and the clearest test of whether labelled capital reaches hardware.
- Chemicals and Advanced Materials Market — the hard-to-abate side of the transition, where revenue per tonne falls while volume rises.
- Global Electric Tractor Market — an early-stage electrification market where policy support, not private capital, sets the volume.
Articles on this market
- Europe's Most Ambitious Sustainable Funds Have Lost Money for Eight Straight Quarters — why the strictest SFDR category is the only one with sustained redemptions, and what the divergence between Article 9, Article 8 and Article 6 flows says about the price of ambition.
- Forty New Funds a Quarter: Sustainable Investing Has Stopped Launching Products — the unit economics of a fund launch, why 1,450 renamings replaced product creation, and who survives as average fund size rises 31.1 per cent.
Sources
- Morningstar, Global Sustainable Fund Flows: Q4 2025 — report (PDF)
- Morningstar, SFDR Article 8 and Article 9 Funds: Q3 2025 — report (PDF)
- Climate Bonds Initiative, Global State of the Market 2025 — climatebonds.net
- Global Sustainable Investment Alliance, Global Sustainable Investment Review 2022 — gsi-alliance.org
- Council of the European Union, Council signs off simplification of sustainability reporting and due diligence requirements, 24 February 2026 — press release
- MSCI Inc., Fourth Quarter and Full Year 2025 Results — investor release
- European Securities and Markets Authority, fund naming guidelines — esma.europa.eu
Table of Contents
- Market snapshot and definition
- Competitive landscape: ten managers hold 40.6 per cent
- Value chain and the fee pool
- Investment activity: where the money actually went
- Technology and data: the audit trail becomes the product
- Regulatory landscape: three boundaries moving at once
- Market risk
- Methodology and sources
Competitive Landscape
A concentrated market that does not look concentrated
7,064 products sound like a fragmented market. They are not. The ten largest sustainable fund franchises held USD 1,585.0 billion at the end of 2025, 40.6 per cent of the USD 3,901.0 billion universe, and the concentration is increasing as renamings remove small products from the measured population and as distribution consolidates onto a smaller number of platforms.
| Rank | Manager | Sustainable fund assets (USD bn) | Share of universe |
|---|---|---|---|
| 1 | BlackRock | 452.6 | 11.6% |
| 2 | Amundi | 215.7 | 5.5% |
| 3 | UBS | 207.9 | 5.3% |
| 4 | BNP Paribas | 123.9 | 3.2% |
| 5 | Swisscanto | 122.7 | 3.1% |
| 6 | DWS Group | 116.4 | 3.0% |
| 7 | Natixis | 109.7 | 2.8% |
| 8 | Nordea | 91.0 | 2.3% |
| 9 | KBC | 75.6 | 1.9% |
| 10 | Vanguard | 69.5 | 1.8% |
| Top ten | 1,585.0 | 40.6% |
Source: Morningstar, Global Sustainable Fund Flows Q4 2025. Shares calculated by Pheonix.
What the league table reveals about strategy
The composition of the top ten is not a list of the world’s largest asset managers. It is a list of the managers whose home market regulated the product. Six of the ten are European or European-headquartered franchises — Amundi, BNP Paribas, Swisscanto, DWS, Natixis and Nordea — each of which built sustainable ranges under a regulatory regime that made the label saleable across borders. KBC, a Belgian bank-insurer with EUR 75.6 billion, holds more labelled assets than Vanguard holds globally at USD 69.5 billion. That ranking is impossible to explain by investment skill and straightforward to explain by distribution geography.
BlackRock is the exception that proves the rule. Its USD 452.6 billion is 11.6 per cent of the global universe, built on a European ETF and index platform rather than on its American retail base, and it is the only franchise in the table with genuine global reach. The gap between first and second — USD 236.9 billion — is larger than the entire ninth-placed franchise.
The data and index layer: a different competitive game
Upstream of the fund table sits a much more concentrated market. Issuer ratings, climate risk models and screened benchmarks are supplied by a handful of firms whose economics are per-asset or per-issuer rather than per-dollar-managed. MSCI, S&P Global and Morningstar — which owns Sustainalytics — are the three names that recur across both fund portfolios and index construction.
The economics here are structurally better than fund management. MSCI reported 2025 operating revenue of USD 3,134.5 million, up 9.7 per cent, with fourth-quarter revenue up 10.6 per cent and a 93.4 per cent retention rate. That retention is the number to watch: it is the measure of how hard it is to switch an index or a rating feed once it is embedded in a mandate, a benchmark or a regulatory filing. Fund managers face fee compression and redemption risk every quarter; index and ratings providers face renegotiation risk every three years.
But the two customer bases inside that layer are diverging sharply. Selling ratings and emissions estimates to investors grows with the asset base. Selling disclosure analysis and reporting software to corporates grows with the number of corporates required to disclose — and the EU’s February 2026 simplification, raising the CSRD threshold to companies above 1,000 employees and €450 million turnover, removes most of that list. The provider with a diversified investor base emerges stronger; the provider that built a compliance-software business around CSRD faces a market that has just lost an order of magnitude of its customers.
Competitive intensity and the next five years
Three dynamics will set the shape of this market by 2030. The first is the fixed-income rotation: managers without credible sustainable credit capability are losing the only part of the market that is growing. The second is the passive squeeze: with sustainable passive funds recording their first annual outflow, the marginal product competes on price in a market where the buyer increasingly wants a mandate instead. The third is the cost of compliance as a competitive moat — a mid-sized manager cannot absorb the naming, disclosure and reporting obligation that a franchise with USD 200 billion of labelled assets can.
The most likely outcome is further concentration: the top ten moving from 40.6 per cent towards half the market, and the long tail of sub-USD 100 million products either merging, reclassifying out of the labelled universe, or closing. That is not a decline in sustainable investing; it is the normal industrial consolidation of a category that has stopped being new.
Value Chain
The chain starts with a mandate, not a product
Sustainable finance is one of the few markets where the retail-facing product is the least important part of the chain by asset value. The chain runs: asset owner (pension fund, insurer, sovereign fund, endowment) sets a mandate; an asset manager implements it; a platform or distributor packages and sells it; an index provider defines the benchmark; a rating agency scores the issuers; an assurance provider verifies the claims; and, in the debt market, a second-party opinion provider certifies the use of proceeds. Each link takes a fee, and each fee is under different pressure in 2025.
| Link | What is sold | 2025 pricing pressure |
|---|---|---|
| Asset owner | Policy, exclusion lists, stewardship mandates | Buyer, not seller — but increasingly writing bespoke mandates that bypass funds |
| Asset manager | Fund management, engagement, transition planning | Severe — average asset per fund rising while fees fall; first passive outflow year on record |
| Platform / distributor | Access, shelf space, suitability labelling | Consolidating; the regulatory label does the differentiation |
| Index provider | Screened, Paris-aligned and net-zero benchmarks | Low — licensing is per-asset and grows with the passive base |
| Ratings and data | Issuer scores, climate and physical risk, controversy flags | Moderate — but the issuer-disclosure customer base is being cut back sharply |
| Assurance / SPO | Verification of sustainability statements and use of proceeds | Rising in debt, falling in equity disclosure |
Where the money is: the fee pool
The sustainable fund fee pool is the clearest way to see the commercial reality behind the asset number. Applying a Pheonix estimate of 38 basis points to average assets produces USD 14.82 billion of revenue on USD 3,901.0 billion in 2025. That is the entire global fee pool for labelled products — roughly four and a half times MSCI’s total 2025 revenue of USD 3,134.5 million, from a universe more than two hundred times its size in assets. Sustainable fund management is an extremely low-margin business relative to the capital it controls, and that is before the fixed-income mix shift.
By 2033 the pool reaches USD 22.03 billion on USD 6,480.0 billion at about 34 basis points. The four basis points of compression cuts USD 3.2 billion of annual revenue that would otherwise have existed: assets grow 66 per cent over the period, revenue 49 per cent. Every strategic plan in this sector that assumes fee rates hold is implicitly assuming the fixed-income rotation reverses, because bond mandates cannot carry equity fees.
Why the value chain is migrating to mandates
The most important movement in 2025 was not between funds but out of them. Segregated mandates let an asset owner state its own exclusion policy, its own transition thresholds and its own reporting, without depending on a fund’s published name — which is exactly what a European pension fund needs when a name carries legal consequence. The manager keeps the relationship and often a higher absolute fee per relationship. The asset leaves the flow statistics permanently.
This is why the measured market can shrink while the business grows, and it explains the otherwise puzzling coexistence of record European assets with record European outflows. It also sets up the competitive problem: mandates are won in negotiated processes with a handful of large consultants, where scale and track record matter more than brand, and where the ten franchises holding 40.6 per cent of the labelled universe start with a structural advantage.
The debt side of the chain
Sustainable debt runs a different chain: issuer, arranger, second-party opinion provider, verifier, investor. Its economics are far healthier in 2025. With USD 6.8 trillion cumulative and more than USD 1 trillion of annual aligned issuance for three consecutive years, the verification and assurance layer has a growing volume of work that is mandated by the instrument’s own framework rather than by a fund’s marketing decision. The provider that certifies a green bond is paid per transaction and is not exposed to whether the bond’s label survives a naming review.
That asymmetry — framework-driven work growing, label-driven work shrinking — is the single most useful thing to know about this value chain. It predicts where the durable revenue sits for the next five years, and it explains why the data and verification businesses have held up far better than the fund flows suggest they should.
Investment Activity
2025 was a year of withdrawal, not deployment
The most important investment fact about 2025 is a negative one. There were 40 new sustainable fund launches globally in the fourth quarter — a launch rate that, annualised, is among the lowest since the category was established. Against that, 121 European funds were renamed in the third quarter alone and 64 of those dropped ESG language from their names. When a manager renames rather than closes, it is telling you the strategy is still believed in and the label no longer is. When it launches almost nothing, it is telling you the distribution economics have stopped working.
This is the opposite of a capital-deployment problem. The capital is there and it is moving. What has stopped is product creation, because a new labelled fund in 2026 must survive a naming review, a disclosure regime and a fee comparison against an index product — a hurdle that most business cases no longer clear.
Where the capital actually deployed
The deployment is visible on the balance-sheet side of the market rather than the fund side. Aligned GSS+ issuance exceeded USD 1 trillion for the third consecutive year in 2025, taking the cumulative stock to USD 6.8 trillion. Green bonds alone accounted for USD 653.5 billion, 64 per cent of aligned issuance and the second-highest annual volume ever recorded, with cumulative green bond issuance now above USD 4 trillion.
| Instrument | 2025 (USD bn) | Momentum |
|---|---|---|
| Green bonds | 653.5 | Second-highest year on record; cumulative above USD 4tn |
| Sustainability bonds | 217.3 | Sovereign and agency-led, growing |
| Social bonds | 141.2 | Below the 2020–21 peak, stable |
| Sustainability-linked bonds | 14.0 | +46% year on year, from a collapsed base |
| Aligned GSS+ total | >1,000 | Third consecutive year above USD 1tn |
The sustainability-linked bond market deserves a separate note because it is the market’s own referendum on its credibility. SLBs pay a penalty if the issuer misses a pre-agreed target, so they only work if the target is ambitious enough for the penalty to matter. Issuance contracted for two years as investors and regulators concluded that many early SLBs carried penalties too small to change behaviour. A 46 per cent rebound in 2025, from a small base, is the first sign that the structure is being rewritten around real step-ups rather than marketing commitments.
Why there was no consolidation wave
The 2020–2023 period in this sector was defined by acquisition: ratings agencies bought ESG research houses, exchanges bought data providers, and asset managers bought specialist boutiques to acquire capability quickly. That wave is over. In 2025 there were no significant acquisitions of scale in sustainable fund management or in ESG data, and the consolidation that occurred took the form of fund mergers and closures rather than corporate transactions.
The reason is valuation. The assets that would have justified a premium in 2021 are now being repriced against a market where labelled products lose money on flow and where the issuer-disclosure customer base has just been legislated away. A buyer of an ESG software business in 2026 is buying a customer list that is about to shrink. A buyer of a sustainable fund range is buying assets that can be renamed out from under it. Neither is a compelling entry point, which is why the sector’s consolidation is happening inside existing institutions rather than across them.
The asymmetry that matters
Deployment is not evenly distributed across geographies. Europe issued 45 per cent of annual GSS+ volume and holds USD 3 trillion of the cumulative USD 6.8 trillion; Asia-Pacific issued USD 305.6 billion in 2025; issuance has now been recorded across 109 countries. The United States, which holds the world’s deepest capital market, is the notable laggard in new labelled issuance and the clear leader in sustainable fund redemptions.
That pattern tells you where the next phase of investment activity will be financed. The transition is being funded by European and Asian balance sheets, and the instruments are increasingly sovereign, agency and supranational rather than corporate. For an investor, that means duration and credit quality are becoming the binding constraints on the labelled market rather than the availability of projects — a very different market from the one the sector described to itself in 2021.
Technology & Innovation
The technology problem is not measurement, it is auditability
For fifteen years the technology story in sustainable investing was data: more coverage, more indicators, more frequent updates. That problem is largely solved and has stopped being the differentiator. What replaced it is harder and more valuable: proving that a stated claim corresponds to what actually happened in a portfolio, a supply chain or a financed emissions book, in a form that survives review by a regulator, a client and a court.
That shift changes what a technology provider sells. Coverage maps were sold to asset managers as a research input. Audit trails are sold to asset managers as a compliance artefact, to asset owners as a monitoring tool and to auditors as evidence. The second product is defensible; the first is a commodity.
Four technologies that are actually changing the cost curve
Machine reading of disclosure. Large language models have collapsed the cost of extracting structured data from unstructured disclosures — annual reports, bond frameworks, transition plans. The immediate effect is deflationary for the research layer: if a model can extract Scope 1 and 2 emissions at a fraction of the cost of a manual analyst, the analyst’s product has to move up the value chain to judgement rather than extraction. The second-order effect is more important: it makes the long tail of small issuers analysable, which is precisely the population that the EU’s reporting simplification has just exempted from disclosure.
Financed-emissions accounting. Scope 3 and financed emissions are the largest and least reliable numbers in the system, and the methodologies that govern them — including the Partnership for Carbon Accounting Financials framework used across banking and asset management — are converging on attribution rules that require loan-level and holding-level data rather than estimates. Building that pipeline once, to a standard that survives assurance, is now a larger undertaking than building the analytics on top of it.
Physical and transition risk modelling. Climate risk models have moved from scenario narratives to geospatial asset-level exposure, and the buyer has changed with them: insurers, banks and sovereign funds now buy physical-risk models for capital and underwriting decisions, not for sustainability reporting. This is the healthiest demand in the data market because it is driven by prudential regulation, which is far more durable than disclosure regulation.
Tokenised and traceable instruments. Digital bond issuance with use-of-proceeds tracking at the instrument level remains small, but it addresses the structural weakness of the labelled debt market: a green bond’s environmental claim currently rests on a framework and a second-party opinion rather than on observable flows of money. Instrument-level traceability would move verification from ex-ante certification to ex-post evidence, which is the direction every regulator is heading.
The AI paradox in this market
Artificial intelligence is simultaneously the most credible growth narrative in sustainable investing and its least differentiated product. Almost every large manager now markets AI-driven ESG analytics, and almost none of them can explain what the model does that a competitor’s model does not. The reason is that the underlying inputs are largely public and identical: the same filings, the same emissions databases, the same news feed.
The durable edge sits in proprietary inputs rather than models. A manager with twenty years of engagement records — what was asked of which company, what was promised, what was delivered — holds something no model can scrape. This is the quiet strategic argument for stewardship as an asset rather than a cost: it is the only part of the sustainable investment process that generates data no one else has.
What the technology layer cannot fix
Ratings divergence on the same issuer remains wide, and the cause is not data quality but definitional choice — different providers weight materiality, controversy and forward-looking risk differently, and each is internally consistent. No technology resolves a disagreement about what should be measured.
Performance attribution is the other gap. Only 26 per cent of ESG indexes outperformed in 2025, against 45 per cent in 2024, and the sector still cannot cleanly separate the effect of the sustainability screen from the effect of the style and sector tilts that come bundled with it. Until it can, the performance debate will be settled by narrative rather than evidence — and 2025 supplied the critics with their best year of evidence in a decade. Notably, the exception was renewable energy, where an index tracking the sector returned 24.8 per cent against 17.4 per cent for the global equity market, around the COP30 summit in Brazil. One year of out-performance in one sector is not a thesis, but it is a reminder that the underlying transition is real even when the packaging of it is not.
Market Risk
The risks that would change the market size, not just the mood
Most published risk lists for this sector are reputational. The risks worth modelling are the ones that change the measured size of the market, because those are the ones that force a reallocation of capital rather than a revision of talking points. There are five.
Definition risk. The market has already demonstrated that its measured size can fall by USD 5 trillion without a dollar moving: that is what happened to the GSIA total between 2020 and 2022 when the United States changed its counting methodology and USD 8.7 trillion left the American number. Nothing prevents a second such revision, and the fund universe is exposed to the same mechanism at a smaller scale — 1,450 renamings since January 2024 have already removed assets from the count. A reader should treat any single-point estimate of this market, including the one in this report, as conditional on its definition.
Fee-compression risk. The Pheonix fee pool estimate falls from 38 to 34 basis points over the forecast period as fixed income and passive take share. Four basis points sounds trivial and is not: on USD 6,480.0 billion it is USD 2.6 billion of annual revenue that does not exist at the end of the period. If average fees fall to 30 basis points instead, the 2033 fee pool is USD 19.44 billion rather than USD 22.03 billion, and the whole margin structure of the sector’s smaller managers fails.
Regulatory reversal risk. The EU’s February 2026 simplification is the clearest example: a single decision raised the CSRD threshold to companies above 1,000 employees and €450 million in turnover, removing the majority of the corporate population that the sustainability data industry was built to serve. Regulation that creates a market can remove it, and in this sector it did so within four years of creating it.
Political and jurisdictional risk. The United States has no federal climate disclosure requirement in force and its sustainable fund market has now recorded thirteen consecutive quarters of outflows. A manager whose sustainable capability is concentrated in one jurisdiction carries the risk that the label becomes a liability there while remaining an asset elsewhere — a problem no single product architecture solves.
Data-integrity risk. Ratings divergence on the same issuer remains wide, and the 2025 performance record gives the critics their strongest evidence in years: only 26 per cent of ESG indexes outperformed in 2025, against 45 per cent in 2024. When the label’s financial case weakens at the same time as its methodological case is being questioned, the product loses both its return argument and its values argument simultaneously.
Market structure and concentration
The top ten franchises hold 40.6 per cent of the universe and the largest holds 11.6 per cent. Concentration is a risk in both directions: it makes the market’s direction dependent on a small number of product decisions, and it makes the smaller managers — most of the 7,064 funds — structurally unviable as the compliance cost per product rises. Expect the product count to grow far more slowly than the assets, which is exactly what the 3.00 per cent volume CAGR in this forecast encodes.
The scenario that is not in the base case
The base case assumes the fixed-income rotation holds, European assets keep compounding at market rates, and outflows fade to a modest net inflow by 2030. The bear case is that renamings accelerate past 50 per cent of the in-scope population, sustainable bond funds fail to compensate for equity redemptions, and the measured universe ends 2030 below USD 4 trillion — growth of under 1 per cent a year. The bull case is a US re-entry into labelled products after the 2028 political cycle and a transition-finance category that finally carries its own framework; on that path the market reaches USD 7.5 trillion by 2033.
Pheonix holds the middle at USD 6,480.0 billion. The asymmetry worth noting is that the bear case requires no new regulation and no new political event; it is simply the continuation of 2025’s flows for another four years. The bull case requires two things outside the industry’s control.
What would change our mind
Three observable thresholds. If European net flows turn positive for two consecutive quarters, the rotation thesis is confirmed and the outflow narrative is finished. If renamings slow below 5 per cent of in-scope funds per year, the label has stabilised and the measured universe can grow again on its own terms. And if sustainable bond funds exceed 15 per cent of global sustainable fund assets — from roughly 11 per cent now — fixed income has become the market’s centre of gravity rather than its refuge. Any one of those three would justify revisiting the forecast; two together would justify raising it.
Regulatory Landscape
Three regulators, three directions
No other part of the financial system is being redrawn by three jurisdictions pulling in opposite directions at the same time. Europe is tightening what a fund may call itself while loosening what a company must report. The United States has withdrawn its federal disclosure requirement and allowed the product to compete without a regulatory advantage. Asia is converging on an international reporting baseline while keeping its own fund-labelling regimes. A global product now has to be compliant, marketable and, in some markets, deliberately unnamed.
Europe: the label gets legal weight
The European regulatory stack has three layers that operate on different populations. The Sustainable Finance Disclosures Regulation governs what a fund must disclose and, through Articles 8 and 9, classifies it. The ESMA guidelines on funds’ names govern what it may call itself. The Corporate Sustainability Reporting Directive governed what the underlying companies must publish — until February 2026.
The naming layer is where the commercial consequences have been sharpest. Article 8 and 9 funds held €6.8 trillion at the end of the third quarter of 2025, roughly 59 per cent of EU fund assets, a share that makes the classification almost meaningless as a sustainability signal — it captures the majority of the market rather than a segment of it. Within that total, Article 9 funds, the genuinely sustainable category, recorded their eighth consecutive quarter of outflows, at €7.1 billion in the third quarter, while Article 8 funds took in €75 billion and Article 6 funds, which claim no sustainability objective at all, took in €134 billion.
| EU fund category | Claim | Q3 2025 net flow | Signal |
|---|---|---|---|
| Article 9 | Sustainable investment objective | −€7.1bn | Eighth consecutive quarter of redemptions |
| Article 8 | Promotes a characteristic | +€75bn | Up from +€47bn in Q2 2025 |
| Article 6 | No sustainability claim | +€134bn | The unlabelled market is absorbing more money than the labelled one |
Source: Morningstar, SFDR Article 8 and Article 9 Funds, Q3 2025.
Read that table carefully and the strategic problem becomes obvious. The stricter the claim, the more money leaves. Article 9, the only category with a genuine sustainability objective, has now bled for two years. Article 6, which claims nothing, is the fastest-growing. Investors are not paying for ambition; they are avoiding legal exposure and buying a lower fee.
Europe: the reporting base gets cut
In February 2026 the Council gave final approval to the simplification of the EU’s sustainability reporting and due diligence regime. The Corporate Sustainability Reporting Directive now applies to companies above 1,000 employees and €450 million in net turnover, and the corporate sustainability due diligence directive to companies above 5,000 employees and €1.5 billion in turnover, with a transition exemption for companies that would have reported first.
This is the most consequential regulatory event of the period for the data industry, and its logic is competitive rather than environmental: the stated purpose was to boost EU competitiveness by removing reporting burden from mid-sized companies. The effect on this market is straightforward. The number of companies required to publish sustainability data has fallen by what the Commission framed as a large majority, so the disclosure-analysis and reporting-software businesses that were built on that obligation now serve a much smaller, much larger-company customer base. The fund and index side of the data market — scoring issuers for investors — is unaffected, because an investor’s need to compare issuers does not depend on the issuer being compelled to publish.
United States: withdrawal
The United States has no federal climate-disclosure requirement in force, and federal policy has moved from mandating disclosure to constraining ESG considerations in investment advice. At the state level the picture is inverted, with several states legislating their own disclosure and divestment requirements while others legislate against ESG considerations in public pension management. The practical result is a market in which the same product is regulated differently depending on the domicile of the investor rather than the asset.
The fund data reflects it. Sustainable funds are roughly 1 per cent of the US fund universe against about 20 per cent of the European one, and US sustainable funds recorded their thirteenth consecutive quarter of outflows in the fourth quarter of 2025. Whatever American investors believe about sustainability, they are not buying it in a labelled wrapper.
Asia and the international baseline
Outside Europe and the United States, the direction is convergence on a common reporting baseline. The ISSB’s IFRS S1 and S2 have become the reference standard in a growing number of Asia-Pacific and other markets, which matters commercially because a single global baseline reduces the cost of serving a global fund. Asia-Pacific issued USD 305.6 billion of aligned sustainable debt in 2025, and Japan, China and India all run domestic frameworks that sit alongside the international baseline rather than replacing it.
The strategic implication of the three-way split is that compliance is no longer a moat that protects a global franchise; it is a cost that must be paid three times in three different forms. The manager who treats regulation as a product decision — the same strategy sold under three labels, or under none — carries a structural cost advantage over the manager who treats it as an identity.