
Editorial Article
Two Countries Are 47.69 Per Cent of Global E-Commerce. The Other 52 Per Cent Is a Model.
There is a number in circulation for the size of global e-commerce, and it is quoted to two decimal places. It has never been observed. No statistical agency in the world measures global online retail: what exists is a set of national accounts, and only a handful of them are large enough, frequent enough and methodologically stable enough to carry a world total.
That is the honest structure behind the USD 7,950.0 billion base in the Global E-Commerce Market Report 2026–2033. Two national statistics offices carry 47.69 per cent of the goods layer. The remainder is modelled. This article is about which half is which, and why the distinction is worth more to a buyer than the growth rate.
The market is five layers, and only one of them is a shop
A single total for e-commerce cannot be reconciled to anything, because it silently adds a delivered parcel to a booked airline seat to an app subscription. The build separates them, and the separation is the reason the arithmetic below is possible at all.
| Layer | 2025 (USD bn) | 2033 (USD bn) | CAGR |
|---|---|---|---|
| Goods retail | 6,420.0 | 11,030.8 | 7.00% |
| Travel, accommodation and experiences | 985.0 | 1,630.2 | 6.50% |
| Food delivery and on-demand | 290.0 | 577.8 | 9.00% |
| Digital goods and subscriptions | 150.0 | 267.5 | 7.50% |
| Event ticketing | 105.0 | 167.4 | 6.00% |
| Total | 7,950.0 | 13,673.7 | 7.01% |
Goods retail is 80.75 per cent of the base. It is also the only layer with a hard external anchor, which is why the credibility of the whole total rests on a conversation between two governments.
The two anchors, and the fact that they measure different things
United States. The Census Bureau’s quarterly release puts adjusted retail e-commerce at USD 340.2 billion in the second quarter of 2026, against total retail of USD 1,986.5 billion — 17.1 per cent of all retail sales, and 12.2 per cent growth against 6.7 per cent for retail overall. On the 2025 annual basis the series contributes USD 1,230.9 billion to the goods layer.
China. The National Bureau of Statistics reports online retail of physical goods at RMB 13,092.3 billion in 2025, up 5.2 per cent, equal to 26.12 per cent of total retail sales of consumer goods. At 7.15 to the dollar that is USD 1,831.1 billion.
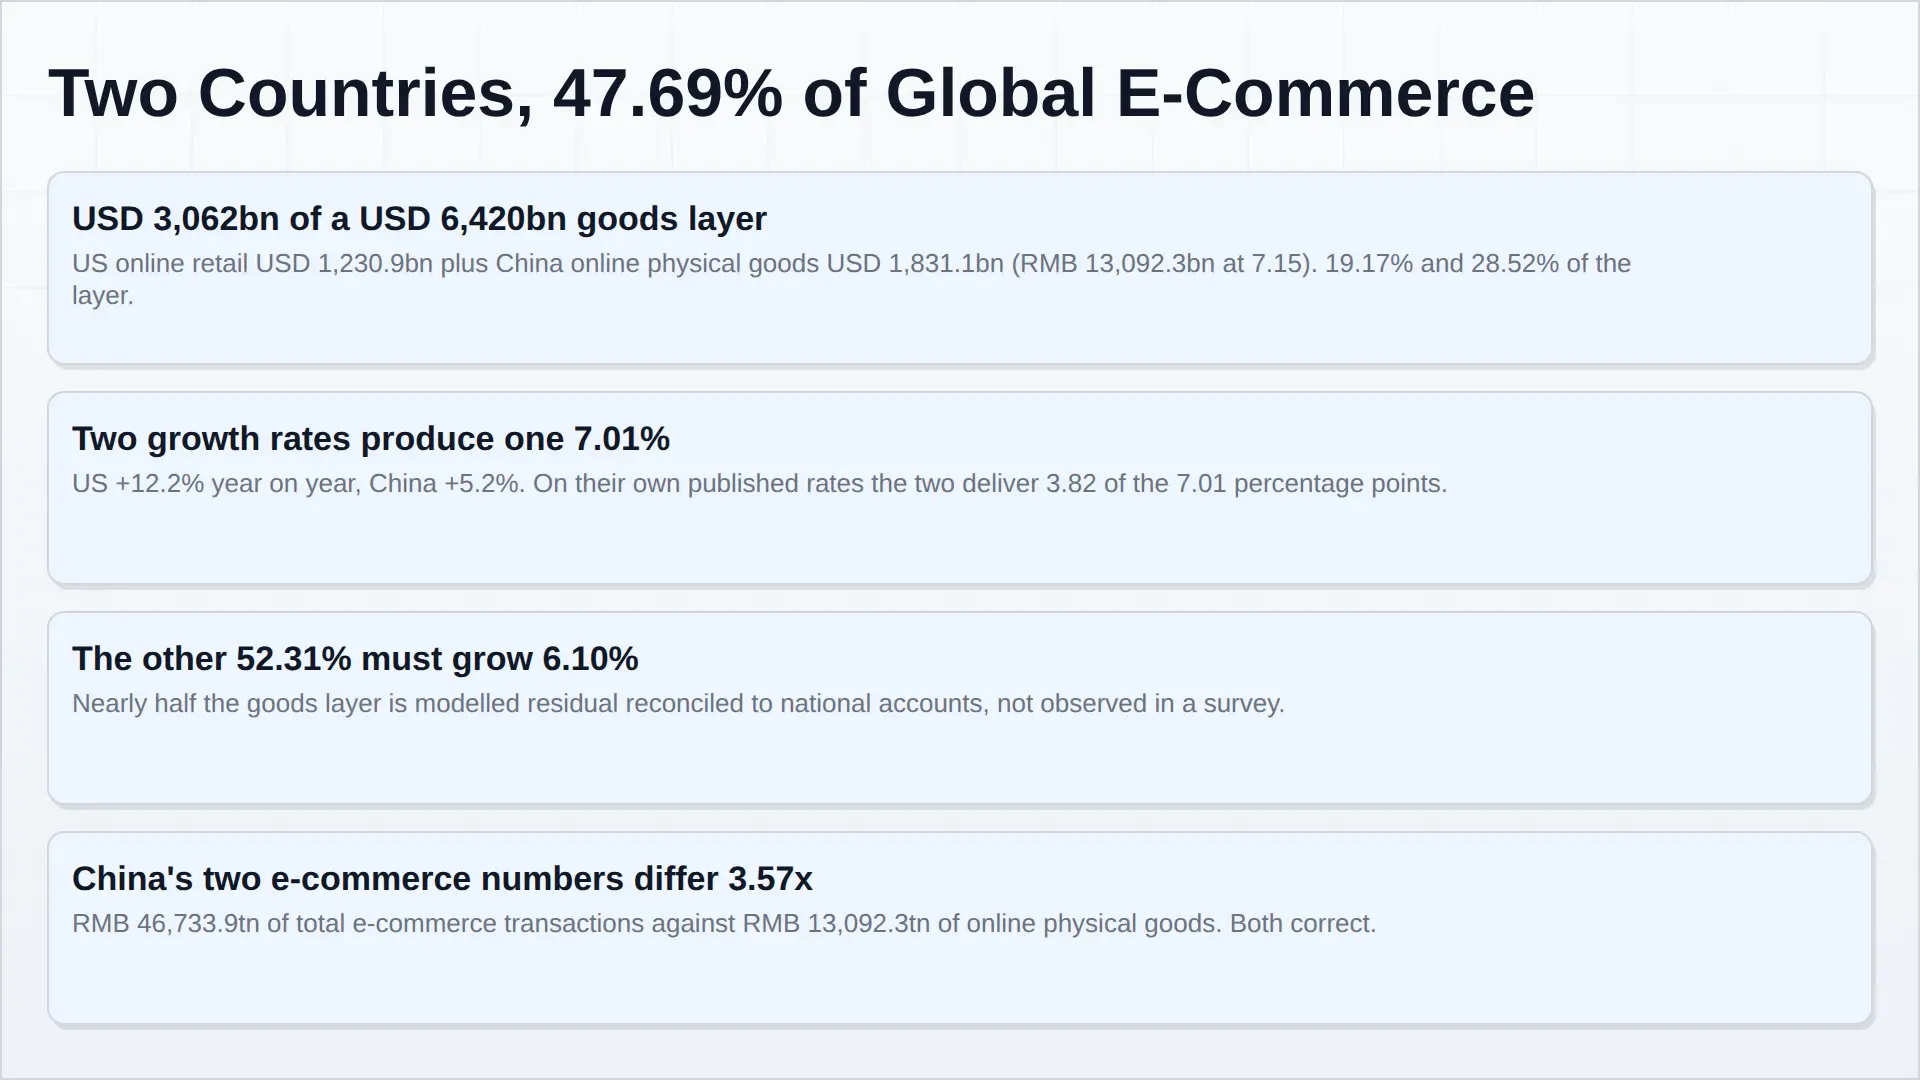
Sum the two: USD 3,062 billion, or 47.69 per cent of a USD 6,420 billion goods layer. Two countries, half the market.
Three things about the pairing deserve to be said plainly, because none of them is in the headline.
First, the two growth rates are not for the same period. The American figure is a quarter against the same quarter a year earlier. The Chinese figure is a calendar year. Averaging a quarterly year-on-year rate into an annual forecast is defensible only if the quarter is representative, and nobody outside the two agencies can confirm that it is.
Second, the American anchor has a revision already dated. The Census page carrying the second-quarter 2026 publication states that as of 28 September 2026 it no longer holds the most current estimates, with revised and adjusted figures due in the third-quarter release on 19 November 2026. A market forecast built on a national account inherits that account’s revision calendar. This is not a flaw in the method; it is what the method costs.
Third, 17.1 per cent and 26.12 per cent are not comparable penetration rates. They measure e-commerce against retail in two economies with different retail structures and different treatment of services. The gap of nine percentage points between them is real; its size is not precise.
What the other 52.31 per cent has to do
Now the part that is genuinely load-bearing. Give the two anchors their published growth rates and weight them by their share of the goods layer, and the arithmetic is unforgiving.
| Anchor | 2025 (USD bn) | Weight of goods layer | Published growth | Contribution (points) |
|---|---|---|---|---|
| United States | 1,230.9 | 19.17% | 12.2% | 2.34 |
| China | 1,831.1 | 28.52% | 5.2% | 1.48 |
| The two together | 3,062.0 | 47.69% | — | 3.82 |
| Rest of world (modelled) | 3,358.0 | 52.31% | 6.10% required | 3.19 |
Read the last row again. The anchors, on their own published numbers, supply 3.82 of the 7.01 percentage points the market is forecast to grow. The residual 52.31 per cent — most of the world’s population, much of it shopping on retail infrastructure that is still substantially cash-based — has to grow 6.10 per cent a year to make the total land.
That is a plausible number. It is not an observed one. And it means the forecast’s principal risk is not consumer demand, currency or even delivery cost. It is that nearly half the world’s e-commerce is a residual that has been reconciled to two national accounts and then grown forward at a rate those accounts imply.
What one point of growth is worth
The corollary of concentration is sensitivity, and it runs in a direction most readers do not expect: the Chinese number moves the global figure harder than the American one, because the base is larger.
| If this moves by one point | The global goods layer moves by |
|---|---|
| China online retail of physical goods | 0.29 points |
| US retail e-commerce | 0.19 points |
| Both | 0.48 points |
A Chinese deceleration from 5.2 to 3.2 per cent would remove roughly 0.57 points from global e-commerce growth without a single change in American behaviour, European policy or delivery economics. The report’s own risk chapter treats this as risk factor five, and it is the only one that requires no operational assumption at all.
The definitional trap that is worth more than the growth rate
China publishes two e-commerce numbers, both correct, and they differ by a factor of 3.57.
RMB 46,733.9 billion is total e-commerce transactions. RMB 13,092.3 billion is online retail of physical goods. The first includes business-to-business trade, services and wholesale flows; the second is the consumer goods layer that belongs in a retail comparison. A page that quotes the first while claiming to describe the consumer market has overstated it by three and a half times, and it will do so in good faith, citing a government release.
This is the reason the report excludes business-to-business trade explicitly and states the exclusion where a reader can find it. Every sizing decision in this market is a definitional decision first. Until the definition is fixed, the growth rate is not comparable to anything, and the decimal places are decoration.
What a buyer should do with a 47.69 per cent
If half the market is two national accounts and the other half is a reconciled residual, then the appropriate use of the global number is as a denominator, not as a decision. The decision variables sit one layer below it, and they are unit economics.
Of the USD 7,950 billion spent online in 2025, platforms booked USD 480.0 billion of rent — 6.04 cents on every dollar of merchandise sold. That layer is measured separately in the Global E-Commerce Platform Market Report 2026–2033, because it grows at 8.60 per cent against the market’s 7.01 and it is a different business with a different ceiling.
Below the platform sits the transaction. The Global Digital Payment Gateway Market Report puts the gateway layer at 26.71 basis points on the value it processes — and falling. The Japan Digital Payment Acceptance Market Report puts acceptance at 61.4 basis points, set by the interchange regime rather than by software.
Read in that order — six cents of rent, twenty-six basis points of gateway, sixty-one basis points of acceptance — the numbers describe what a single consumer order actually costs before a merchant books a margin. That is a decision an operator can act on. Whether the world’s e-commerce is 7.95 or 8.2 trillion is not.
How this article and the report behind it were built
The research is roughly 70 per cent secondary and 30 per cent primary. The secondary layer is national statistics — the US Census Bureau’s quarterly e-commerce series, the National Bureau of Statistics of China, Eurostat and national retail trade releases — plus company filings and results releases for the platform layer. The primary layer is qualitative and carries no magnitude: merchant-side and platform-operator conversations, conference and trade-show material, and open-ended interviews used to establish which cost lines actually move per order. No figure in this article is derived from a primary conversation; the primary work explains the mechanism, and the national accounts supply the numbers.
The layer build, the FX basis of 7.15 to the dollar, the reconciliation of the residual and the sensitivity above are set out in full in chapters three and five of the underlying report. Where a figure is model output rather than a published disclosure — the four service layers beneath goods retail, and the 52.31 per cent residual — the report says so at the point of use.
Sources
US Census Bureau, Quarterly Retail E-Commerce Sales, Second Quarter 2026, released 18 August 2026 (census.gov/retail/ecommerce). National Bureau of Statistics of China, online retail of physical goods and total retail sales of consumer goods, calendar 2025. Amazon.com, Inc. and Shopify Inc. annual filings and full-year 2025 results, via SEC EDGAR. Alibaba Group Holding Limited, fiscal 2026 results release.
Related reading: India Quick Commerce Market 2026–2033, where delivery density rather than national accounts sets the growth rate.
Frequently Asked Questions
How big is the global e-commerce market?
USD 7,950.0 billion in 2025, rising to USD 13,673.7 billion in 2033 at a 7.01 per cent CAGR. Goods retail is USD 6,420.0 billion of that, or 80.75 per cent of the base, with travel and accommodation at USD 985.0 billion, food delivery and on-demand at USD 290.0 billion, digital goods at USD 150.0 billion and event ticketing at USD 105.0 billion.
What share of global e-commerce do the US and China represent?
47.69 per cent of the goods layer: USD 3,062 billion of USD 6,420 billion. That is USD 1,831.1 billion from China's RMB 13,092.3 billion of online retail of physical goods at 7.15 to the dollar, plus USD 1,230.9 billion from the US 2025 annual e-commerce total.
Why do official Chinese sources give two different e-commerce numbers?
China reports RMB 46,733.9 billion of total e-commerce transactions and RMB 13,092.3 billion of online retail of physical goods. The first includes business-to-business trade, wholesale and services; the second is the consumer goods layer that belongs in a retail comparison. The gap between them is 3.57 times, and both figures are correct.
How much of the global e-commerce forecast is modelled rather than observed?
52.31 per cent of the goods layer. The US and Chinese anchors cover 47.69 per cent on published national statistics; the remainder is a residual reconciled to smaller national series and grown forward at 6.10 per cent a year, the rate required to land the 7.01 per cent total.