
Japan Digital Payment Acceptance Market Report, Size, Share and Forecast 2026–2033: The Last Seven Points Cost Less Than the First Twenty-One
Japan Digital Payment Acceptance and Processing Market, 2026–2033: Snapshot
| Metric | Value |
|---|---|
| Market size, 2025 | USD 6,750.7 million |
| Market size, 2033 | USD 8,009.5 million |
| CAGR, 2026–2033 | 2.16 per cent |
| Increment, 2025–2033 | USD 1,258.8 million |
| Cashless transaction value, 2025 | JPY 162.7 trillion (USD 1,099.3 billion) |
| Cashless transaction value, 2033 | JPY 232.0 trillion (USD 1,567.6 billion) |
| Volume CAGR, 2026–2033 | 4.54 per cent |
| Blended acceptance take rate, 2025 | 61.4 basis points |
| Blended acceptance take rate, 2033 | 51.1 basis points |
| Cashless payment ratio, 2025 (domestic indicator) | 58.0 per cent (46.3 per cent on the international comparison indicator) |
| Largest method, 2025 | Credit cards — 87.6 per cent of acceptance revenue |
| Fastest-growing method | Code payments — 10.58 per cent |
| Base year / forecast window | 2025 / 2026–2033 |
| Currency, unit and FX basis | USD, millions, at JPY 148 = USD 1 |
What this report actually counts
Japan is the most over-measured and under-documented payments market in the world. The ratio is published every March by the ministry that set the target, the transaction counts are published alongside it, and the two are quoted constantly. What almost nobody publishes is the fee.
In scope: the net revenue earned by acquirers, payment service providers, gateway platforms and code-payment operators on Japanese cashless volume — merchant discount retained after interchange and scheme fees, processing and platform fees, and the settlement and payout margin on the same transaction. This is the money the acceptance layer keeps.
Out of scope, and disclosed rather than quietly included: interchange, which is paid by the acquirer to the issuer and is set within scheme rules; scheme and network fees; consumer rewards and points, which are a marketing cost of the layer rather than revenue; revolving credit interest and card lending; and terminal hardware. Interchange alone is the largest single component of a Japanese merchant's card cost and it belongs to the issuing side, not to this layer.
The consequence is a market that looks small against the value it clears. JPY 999.1 billion of acceptance revenue sits on JPY 162.7 trillion of cashless value — 61.4 basis points. That ratio, not the yen total, is what this report forecasts. Between 2025 and 2033 Japanese cashless value compounds at 4.54 per cent and acceptance revenue compounds at 2.16 per cent. The whole of the difference is the take rate falling to 51.1 basis points.
Table of contents
- Market definition and scope
- Executive summary
- Market size and forecast, 2025–2033
- 3.1 The acceptance-revenue build, method by method
- 3.2 Method table, 2025 and 2033
- 3.3 Volume and price, decomposed
- 3.4 The two ratios that describe the same country
- 3.5 Japan against the global gateway layer
- Competitive landscape and market structure
- Value chain: who is paid on a Japanese transaction
- Investment activity and capital flows
- Technology and innovation
- Market risk and disruption
- Regulatory and policy environment
- Method, sources and the primary-research layer
- About Pheonix Research
- Disclaimer
Market size and forecast, 2025–2033
3.1 The acceptance-revenue build, method by method
The market is built from value and price, not extrapolated from a headline. Four payment methods are separated because each is priced by a different mechanism and bought by a different person inside the merchant: a card acceptance contract signed with an acquirer, a code-payment merchant agreement signed with a wallet operator, an e-money acceptance agreement bundled into a terminal, and a debit arrangement that in Japan has spent two decades failing to grow.
Each method is sized as cashless transaction value multiplied by the net rate that value attracts at the acceptance layer. Two official sources fix the value: the Ministry of Economy, Trade and Industry publishes the annual cashless payment ratio and its method split, and the Bank of Japan publishes Payment and Settlement Statistics for debit and e-money. The rates are calibrated to the only public decomposition of a Japanese acquirer-gateway's revenue lines — GMO Payment Gateway's own disclosures — and then applied to a market many times its size. The calibration is set out in section 5.
3.2 Method table, 2025 and 2033
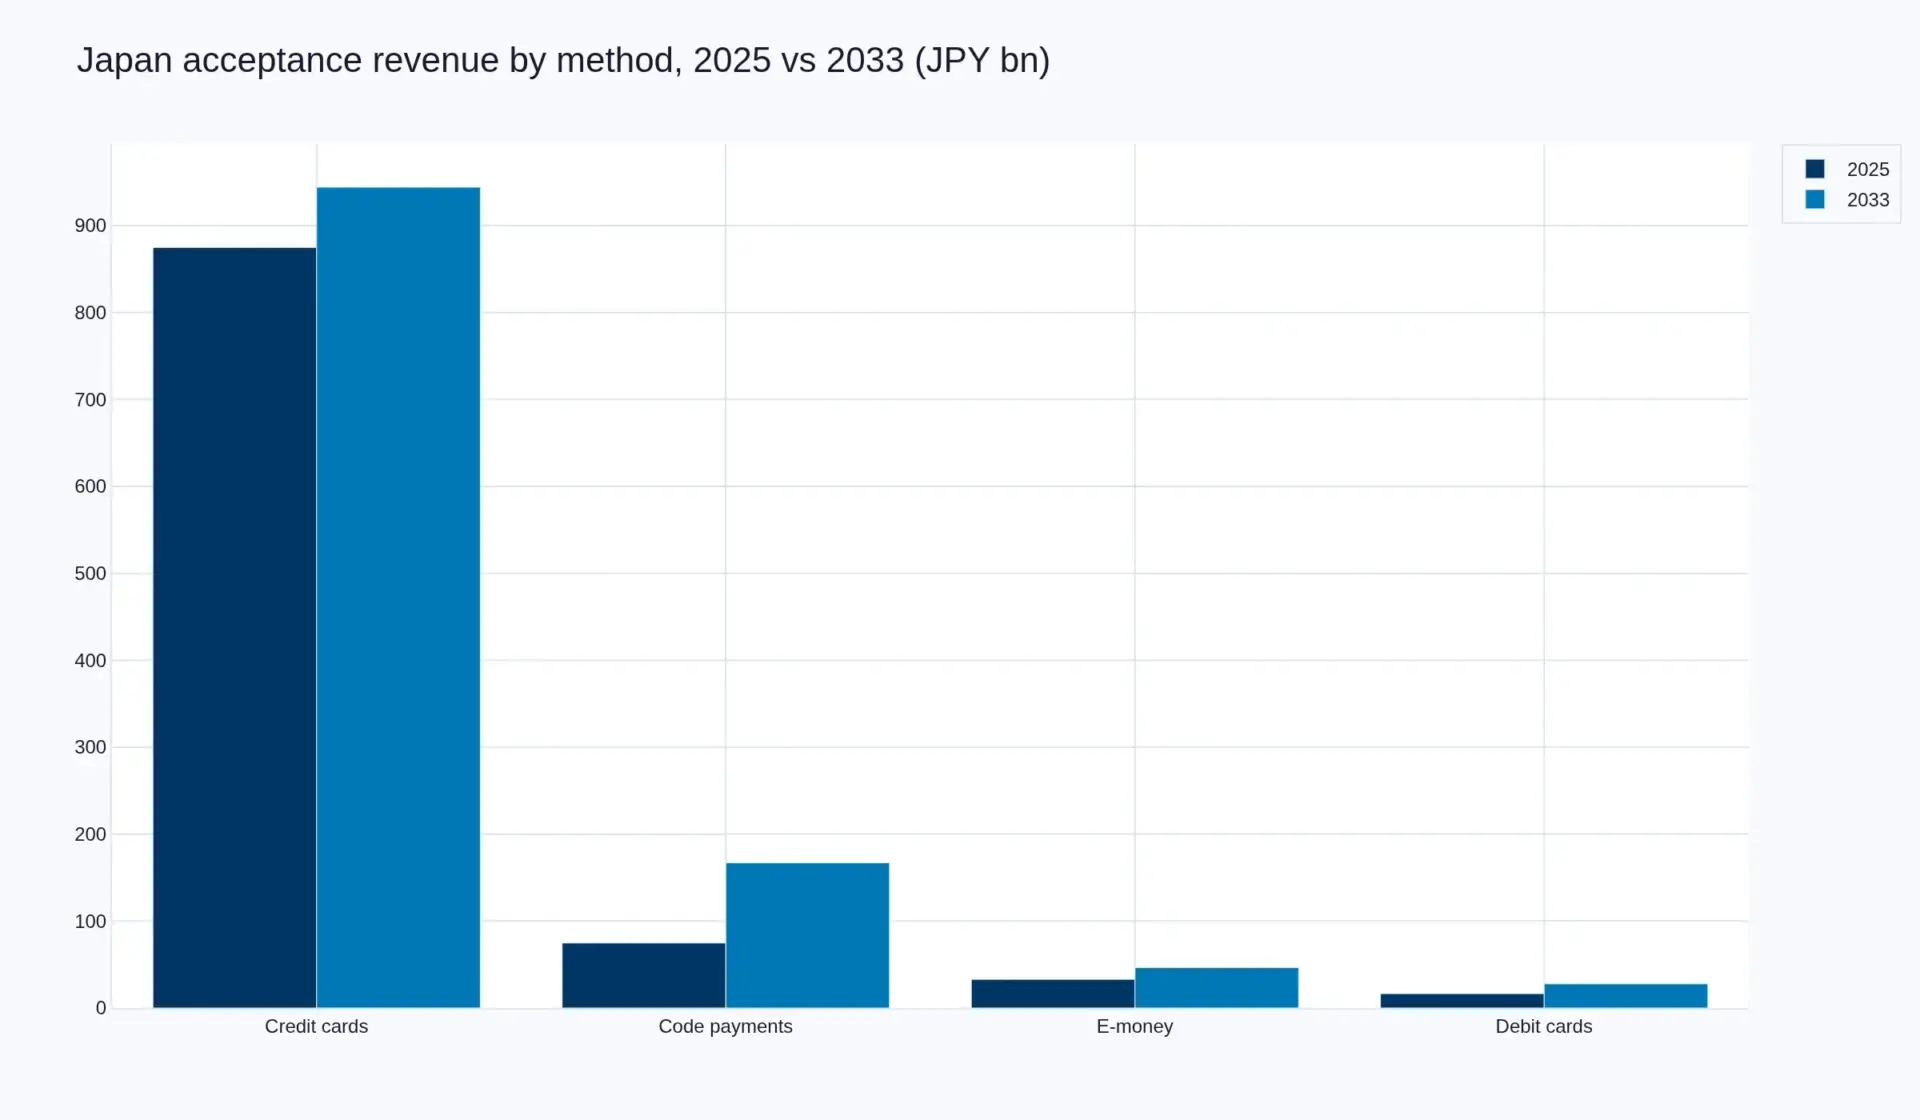
| Method | 2025 value (JPY tn) | 2025 net rate (bps) | 2025 revenue (JPY bn) | 2033 value (JPY tn) | 2033 net rate (bps) | 2033 revenue (JPY bn) | CAGR |
|---|---|---|---|---|---|---|---|
| Credit cards | 134.6 | 65.0 | 874.9 | 171.7 | 55.0 | 944.2 | 0.96% |
| Code payments | 16.6 | 45.0 | 74.7 | 41.8 | 40.0 | 167.0 | 10.58% |
| Electronic money | 6.0 | 55.0 | 33.0 | 9.3 | 50.0 | 46.4 | 4.35% |
| Debit cards | 5.5 | 30.0 | 16.5 | 9.3 | 30.0 | 27.8 | 6.74% |
| Total | 162.7 | 61.4 | 999.1 | 232.0 | 51.1 | 1,185.4 | 2.16% |
In US dollars at JPY 148, acceptance revenue moves from USD 6,750.7 million in 2025 to USD 8,009.5 million in 2033 — an increment of USD 1,258.8 million, a multiple of 1.186x. A constant FX rate is an assumption, not a forecast, and it is disclosed as such: a materially weaker yen would raise the dollar value of a flat yen market without anything having improved.
3.3 Volume and price, decomposed
Two numbers carry the forecast, and the second one is the report.
Value grows 4.54 per cent a year. That is not heroic. It assumes the cashless ratio reaches METI's own long-term goal of 80 per cent on the domestic indicator by 2033, against 58.0 per cent in 2025, on a consumer spending base that grows only slowly. On the domestic basis, JPY 162.7 trillion at 58.0 per cent implies a denominator of JPY 280.5 trillion in 2025; at JPY 290 trillion and 80 per cent in 2033, the numerator is JPY 232.0 trillion. That is the entire volume story, and it requires no new behaviour beyond a target the government set in December 2025.
The take rate falls from 61.4 to 51.1 basis points — a 16.8 per cent decline in the price of accepting a yen over eight years. This is not a forecast of a price war. It is a forecast of mix, and three things push the blended rate down without anyone behaving badly.
- Code payments take share at a lower rate. Code payments reach 14.1 per cent of acceptance revenue by 2033 from a tenth of the value today, and they clear at 40 basis points because there is no interchange inside the transaction to fund a richer one.
- The last points of penetration are the small ones. A merchant who still takes only cash in 2026 is, almost by definition, a low-ticket, low-volume merchant in a thin catchment. Converting them adds merchant locations and transaction count faster than it adds value, and value is what the fee is charged on.
- Disclosure is doing what disclosure does. METI, working with the Japan Fair Trade Commission, published the standard rates for credit card interchange in 2022 and the allocation of merchant fees in 2023, and added a disclosure guideline for code-payment operators selling to small merchants. A merchant who can see the split can negotiate it.
Read the model as a spread, not a point. Hold the take rate flat and the market reaches JPY 1,424.5 billion by 2033; hold value flat and let price fall, and it contracts to JPY 831.0 billion. Reality sits between them, and the base case leans toward price.
3.4 The two ratios that describe the same country
Two cashless ratios are now published for Japan and they differ by nearly twelve percentage points. This is not a data conflict and it is the single most useful definitional fact in the market.
On 31 March 2026, METI reported that the 2025 cashless payment ratio reached 58.0 per cent, on JPY 162.7 trillion of cashless value. The method split: credit cards 82.7 per cent (JPY 134.6 trillion), code payments 10.2 per cent (JPY 16.6 trillion), electronic money 3.7 per cent (JPY 6.0 trillion) and debit cards 3.4 per cent (JPY 5.5 trillion).
On the international comparison indicator, the same year's ratio is 46.3 per cent. The difference is the denominator. The international basis includes imputed rent for owner-occupied housing — roughly JPY 57 trillion, about 17 per cent of the total — which nobody can pay by card, because a homeowner cannot charge rent to themselves. METI's December 2025 Cashless Promotion Study Group moved the target onto the domestic basis for exactly that reason, and set 65 per cent by 2030 and 80 per cent long term there, against 55 per cent on the older basis.
Anyone comparing Japan with Korea, China or Sweden on the 46.3 per cent figure and concluding Japan is a laggard is comparing a numerator with the wrong denominator. Anyone using 58.0 per cent and concluding the market has seven points of easy growth has not noticed what the next seven points are made of. The next seven points are small-ticket merchants, and small-ticket merchants are the least valuable merchants per yen of fee. That is the arithmetic behind a 4.54 per cent volume rate producing a 2.16 per cent revenue rate.
3.5 Japan against the global gateway layer
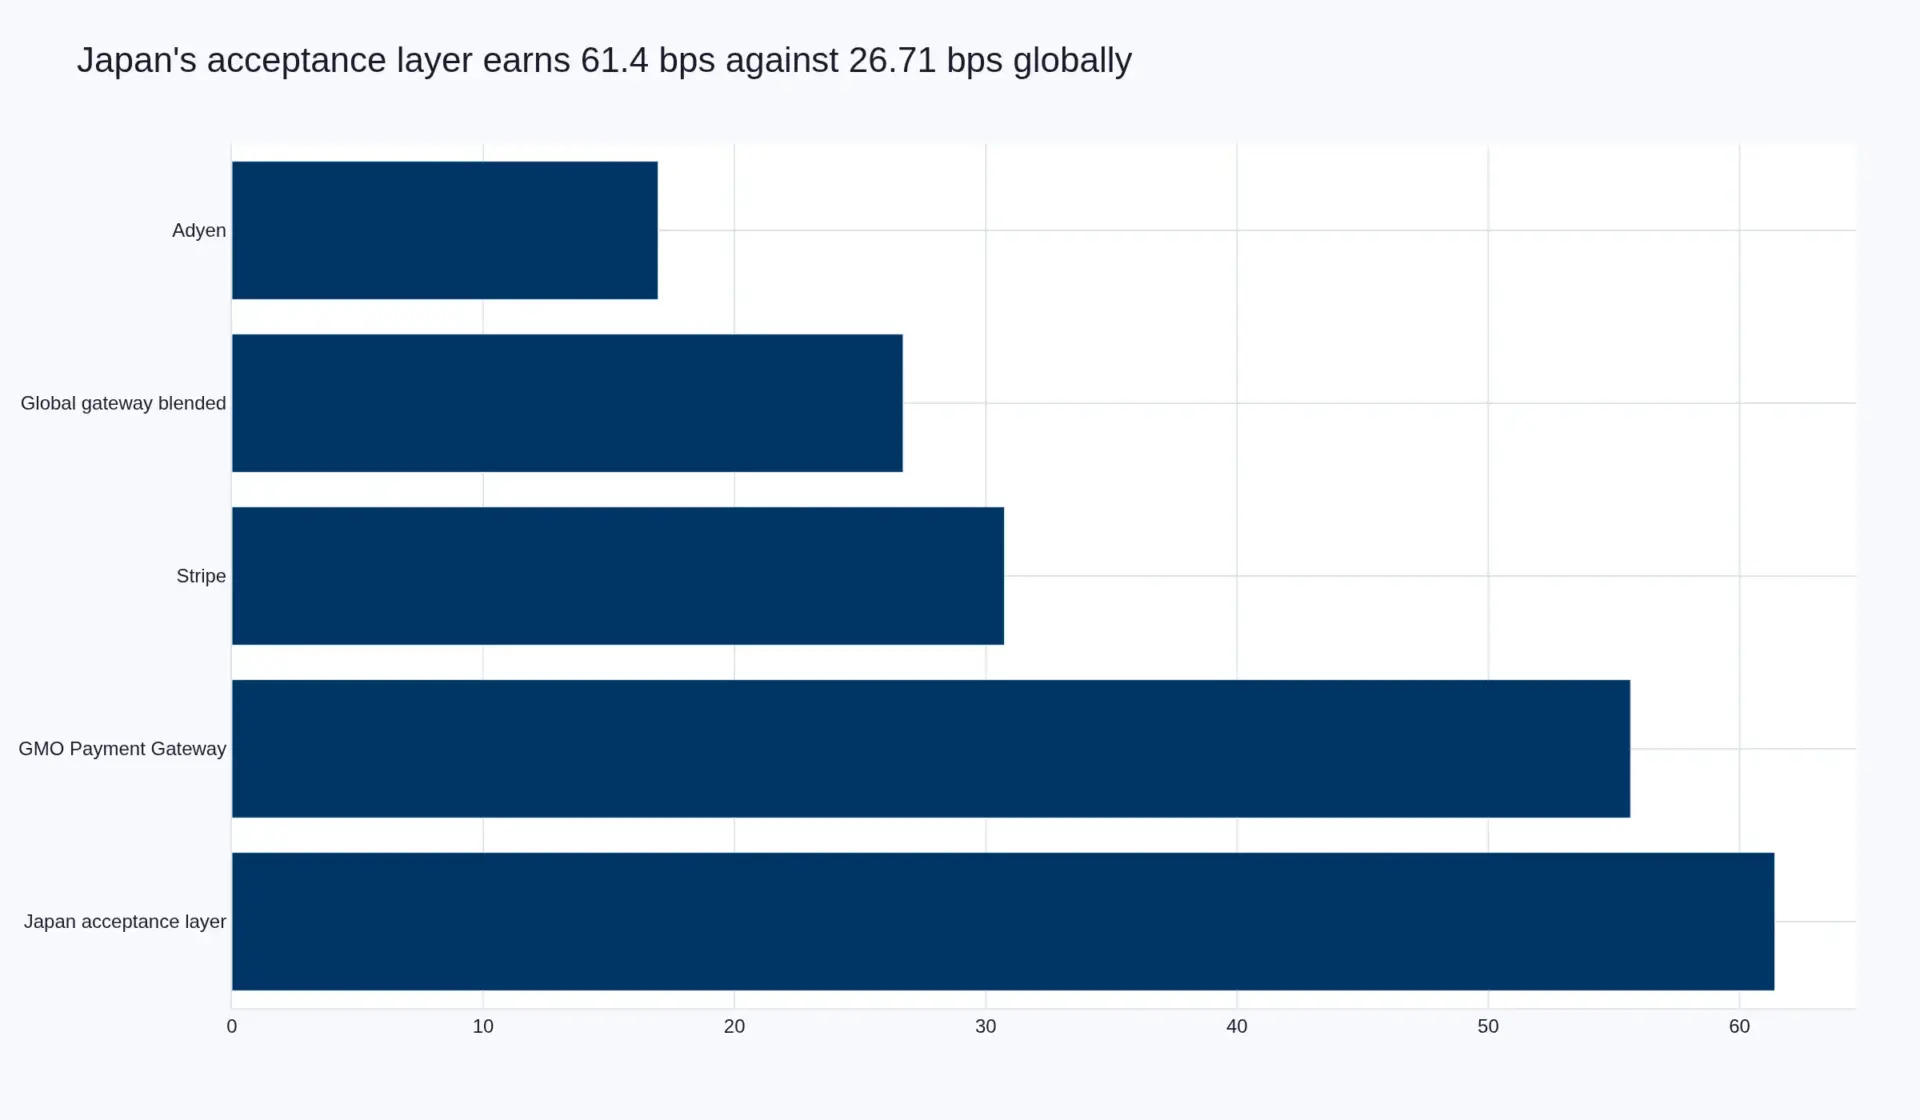
Japan's acceptance layer earns 61.4 basis points. The global gateway layer, measured on the same net-of-interchange basis in our Global Digital Payment Gateway Market report, earns 26.71 basis points. Japan is roughly 2.3 times more valuable per dollar cleared.
That gap is not efficiency and it is not technology. It is structure: a domestic interchange regime that leaves a wider spread inside the transaction, a merchant base that historically accepted the standard tier, and an acquiring market where the largest participants have been able to hold a rate that a globally competitive processor cannot. It is also the reason the global platforms have found Japan difficult to enter directly and have mostly entered through partnership or acquisition, and it is the reason the take rate in this report has somewhere to fall from.
For the banking and identity layers underneath this market, see our Global Digital Banking Market and Anti-Money Laundering coverage; for the demand side that sets Japanese transaction values, see Global E-Commerce.
Articles on this market
Two supporting analyses extend the findings in this report, both built from the same figures and the same acceptance-revenue build.
- Japan's Cashless Ratio Is 58.0 Per Cent. It Is Also 46.3 Per Cent, in the Same Year. — the two official ratios, the JPY 57 trillion of imputed housing rent behind the gap, and why the 2030 goal needs a third of the pace Japan just delivered.
- Accepting a Yen in Japan Earns 61.4 Basis Points. The World Earns 26.71. — where the structural premium is manufactured inside one acquirer, and why disclosure rather than competition takes a sixth of it back.
Method, sources and the primary-research layer
Secondary layer — 70 per cent of the evidence base, and it carries every number in this report. Official statistics: METI's 2025 cashless payment ratio release and its Cashless Promotion Study Group summary of December 2025; the Bank of Japan's Payment and Settlement Statistics for debit and electronic money; the Japan Consumer Credit Association's Credit Card Transaction Survey, which METI uses for the credit card numerator across 26 major issuers; the Payments Japan Association's code-payment usage survey; and the Cabinet Office's National Accounts for the denominator. Company disclosures: GMO Payment Gateway's segment revenue lines and quarterly processed value, Adyen's half-year net revenue and processed volume, and PayPay's own published user and merchant-location figures. Policy record: METI's publication of interchange standard rates (September and November 2022) and merchant-fee allocation ratios (June 2023), both produced with the Japan Fair Trade Commission.
Primary layer — 30 per cent, and it carries no number of its own. Structured interviews with merchant-side payments and finance leads across retail, marketplaces and services; open-ended interviews with commercial teams at domestic acquirers and at code-payment operators; sessions and corridor conversations at Japanese payments and retail-technology conferences; and a merchant acceptance survey covering pricing, settlement timing and authorisation performance. The primary layer exists to establish mechanism — why a merchant chooses a provider, which line of the fee is negotiable, what actually triggers a switch — and never to originate a figure. Where a primary observation and a secondary figure disagree, the figure stands and the disagreement is disclosed.
No third-party market-research estimates are used or cited anywhere in this report. Every number traces to a named official release, a named company disclosure, or an arithmetic step shown in the text.
About Pheonix Research
Pheonix Research builds bottom-up market intelligence from unit economics: volume multiplied by the price that volume actually attracts, reconciled line by line against primary disclosures rather than accepted as a headline. Our reports separate the layer being measured from the layers adjacent to it, disclose what is excluded and why, and publish the ladder back up so a reader can reconcile to a wider definition instead of taking either number on trust. Primary research establishes how an obligation prices and who bears it; it carries no number.
Disclaimer
This report is provided for information only and does not constitute investment, legal, tax or accounting advice. Figures are estimates built from the sources listed above; forecast years are modelled, not observed. Currency conversions use a constant JPY 148 = USD 1 basis for comparability, and a change in the exchange rate will change dollar figures without any change in the underlying market. Company and regulator names are used for identification; no endorsement is implied in either direction.
Table of Contents
1. Market Definition and Scope
1.1 What the acceptance layer is 1.2 What is included 1.3 What is excluded, and why 1.4 The net-of-interchange principle 1.5 Reconciliation to a merchant-discount definition
2. Executive Summary
2.1 Market Snapshot, 2025-2033 2.2 The rate, not the value 2.3 The seven points that cost less 2.4 Where the fee sits 2.5 Analyst Viewpoint
3. Market Size and Forecast, 2025-2033
3.1 The acceptance-revenue build, method by method 3.2 Method table, 2025 and 2033 3.3 Volume and price, decomposed 3.4 The two ratios that describe the same country 3.5 Japan against the global gateway layer 3.6 Sensitivity: flat price and flat value
4. Competitive Landscape and Market Structure
4.1 Three take-rate bands, one function 4.2 Card-issuer-affiliated acquirers 4.3 Independent PSP and gateway 4.4 Code-payment operators 4.5 Platform and marketplace acceptance 4.6 Consolidation logic 4.7 What competition is actually about
5. Value Chain: Who Is Paid on a Japanese Transaction
5.1 The card anatomy: issuer, scheme, acquirer, gateway 5.2 The code-payment anatomy: no interchange to share 5.3 E-money and transit 5.4 Debit, the market that never arrived 5.5 The four revenue lines of a domestic acquirer 5.6 Settlement, float and the merchant’s real cost
6. Investment Activity and Capital Flows
6.1 A capital-light layer 6.2 What the 2019 reward programme actually funded 6.3 SME financing as adoption policy 6.4 Capability versus merchant locations 6.5 What to conclude
7. Technology and Innovation
7.1 JPQR and cross-border QR interoperability 7.2 Tokenisation and the credential 7.3 Fraud and phishing as the real adoption constraint 7.4 Payments the consumer does not notice 7.5 B2B and corporate card acceptance 7.6 Agentic commerce and the mandate
8. Market Risk and Disruption
8.1 Merchant fee politics 8.2 Code-payment economics under fee compression 8.3 Thin-catchment merchants and the last seven points 8.4 Demographic and rural density 8.5 Operational and data risk 8.6 Cash as resilience
9. Regulatory and Policy Environment
9.1 The Cashless Promotion Study Group and the 2025 targets 9.2 Interchange standard-rate disclosure, 2022 9.3 Merchant-fee allocation disclosure, 2023 9.4 Small-merchant disclosure guideline 9.5 Industry self-regulation and the unified QR standard 9.6 Licensing and the Payment Services Act 9.7 Forward outlook to 2033
10. Method, Sources and the Primary-Research Layer
10.1 Secondary sources, named 10.2 Primary layer, and what it cannot do 10.3 Arithmetic and rounding 10.4 FX basis 10.5 Exclusion of third-party market-research estimates
11. About Pheonix Research
12. Disclaimer
Competitive Landscape
Competitive landscape and market structure
Three take-rate bands, one function
The Japanese market is not one market. It is three pricing regimes performing the same function, and the distance between them is the most useful single observation in this report.
| Provider type | What sets the rate | Approximate net rate | Where it keeps it |
|---|---|---|---|
| GMO Payment Gateway — domestic acquirer-gateway | Acquiring spread inside the domestic interchange structure | 55.66 bps | Merchant acquiring spread plus transaction fee |
| Adyen — global enterprise PSP | Processing fee on merchants who have already unbundled acquiring | 16.96 bps | Processing fee and platform modules |
| Code-payment operators, led by PayPay | Merchant fee with no interchange to share | 40–45 bps at the acceptance layer | Merchant fee, less processing and rewards |
The 3.28x gap between GMO Payment Gateway and Adyen is not a technology gap and not an efficiency gap. GMO earns an acquiring spread because it carries the acquiring position inside a domestic interchange structure. Adyen earns a processing fee on merchants who have already unbundled acquiring, and it has largely entered Japan through partnership and enterprise accounts rather than by competing for the domestic merchant base.
The four channels, and who owns each
- Card-issuer-affiliated acquirers. The merchant base arrives with the card relationship. They hold the widest spread and the weakest software, and their commercial question is retention rather than acquisition.
- Independent PSP and gateway. GMO Payment Gateway, SB Payment Service, DG Financial Technology and PAY.JP compete on coverage, integration and authorisation. This is where the take-rate ceiling is genuinely contested, because a merchant here can switch without changing its card or its bank.
- Code-payment operators. PayPay reports 75 million registered users and, on its own published figures, merchant locations measured in millions. That is a distribution moat rather than a fee moat: the operator wins because the consumer already has the app, and the merchant accepts because the consumer asks for it.
- Platform and marketplace acceptance. Merchants whose volume is inside a marketplace or a platform see the acceptance decision made for them or offered at a rate they cannot separately negotiate. This channel grows with e-commerce and takes rate away from the other three.
The dilution mechanism, in Japanese
The global evidence on take-rate dilution is unambiguous and it transfers. Adyen disclosed that processed volume rose 8 per cent including a single large-volume customer and 21 per cent excluding that customer. Thirteen percentage points of volume arrived and almost none of it arrived as revenue. Japan has the same mechanism with a different trigger: the largest domestic merchants, and the platforms that host them, negotiate against their own credible alternative, and the marginal revenue on their volume approaches the marginal cost of serving it.
What is different in Japan is the starting point. A market earning 61.4 basis points has more room to fall than one earning 26.71, and the disclosure regime that arrived in 2022 and 2023 gave the negotiating side the information it needed to ask.
Structure: fragmented at acceptance, concentrated at the wallet
Acceptance is fragmented. Hundreds of acquirers, PSPs and terminal providers serve a merchant base measured in millions of locations, and no participant holds a dominant share of total merchant fee revenue. The wallet layer is the opposite: code payments are concentrated in a handful of consumer applications, and the largest of them operates at a scale that makes displacing it a decade-long project rather than a product decision.
That asymmetry explains the consolidation pattern. Acquirers consolidate volume, because volume amortises a licence and a settlement balance sheet. Platforms consolidate capability — orchestration, fraud, payouts — because capability is what raises the take rate. The two strategies produce very different multiples for the same sector, and Japanese M&A in this layer has for several years been a reallocation between them rather than a wave of like-for-like mergers.
What competition is actually about
Not price. Price is where competition is reported. Three things decide who wins a Japanese account, in the order merchants describe them: authorisation performance on their own traffic; coverage of the methods that actually clear, on one contract, at one settlement cycle; and operational depth — settlement timing, chargeback handling, reconciliation and the quality of the integration team. The third is unglamorous and is the most common reason an incumbent is replaced.
The implication is uncomfortable but simple. The price competition that produces the take-rate series in this report is real, and it is being fought over a service that merchants do not primarily choose on price. Providers competing only on basis points are competing for the accounts that will leave them next year.
Value Chain
Value chain: who is paid on a Japanese transaction
Two anatomies, not one
A Japanese payment is either a card transaction with an issuer inside it, or it is not. That single distinction explains the entire spread between one method’s take rate and another’s, and it explains why the code-payment boom changed so little about who gets paid.
Table: the anatomy of two transactions
| Stage | Card transaction | Code transaction |
|---|---|---|
| Consumer’s funding source | Issuer’s credit line | Bank account, or a card linked to the wallet |
| Issuer economics | Interchange, set within scheme rules | None, unless a card is linked behind the wallet |
| Network | Scheme assessment on every transaction | None; the QR standard is not a scheme |
| Acquirer or accepting operator | Merchant discount less interchange and scheme fees | Merchant fee, retained whole after processing cost |
| Gateway or PSP | Basis points, or an acquiring spread if it is also the acquirer | Platform and settlement fees, or nothing if vertical |
| Consumer reward | Issuer-funded points | Operator-funded points |
| Who bears fraud loss | Issuer, subject to chargeback rules | Operator, in most cases |
The four revenue lines of a domestic acquirer
GMO Payment Gateway publishes the cleanest public decomposition of a Japanese acceptance business, and it is the calibration for this report. Its revenue is reported in four lines: an initial revenue line from onboarding and setup, a stock and recurring line from subscriptions and platform modules, a transaction-fee line charged in basis points, and a merchant-acquiring spread line where it carries the acquiring position. On its disclosed quarterly consolidated processed value, the transaction-fee line alone works out to roughly 14.6 basis points, while the blend including acquiring spread is 55.66 basis points.
That ratio inside a single company is the most important number in the Japanese market. The acquiring spread is approximately three times the size of the processing fee. It is also the line that METI’s disclosure programme points directly at, because the acquiring spread is what remains of the merchant discount after interchange and scheme fees are taken out — and until 2022 the merchant could not see any of those components.
Debit, the market that never arrived
Japanese debit cards carry JPY 5.5 trillion of value, 3.4 per cent of the cashless numerator, two and a half decades after the rail was built. The reason is not technology. A debit transaction’s economics leave so little for the accepting side that it has never been worth an acquirer’s sales call to a merchant who already accepts credit, and the consumer has had no reason to prefer it over either credit or a wallet. It is a useful control on the forecast: a rail can be nationally interoperable, cheap and unloved simultaneously.
The merchant’s real cost is not the fee
The primary layer of this research — merchant-side payments and finance leads, interviewed across retail, marketplaces and services, and the commercial conversations at the Japanese payments and retail-technology conferences where acquirers and merchants meet — describes the decision in the same order every time. Fee is negotiated annually. Settlement timing is reviewed quarterly. Authorisation and failure rates are reviewed monthly. The monthly review is what replaces a provider.
That matters for a take-rate forecast because it means the fee can fall without the incumbent losing the account, and it means a new entrant cannot win an account on price alone. It also sets the boundary of this analysis honestly: the 51.1 basis points in 2033 is the price of the service, and it is not the number in the merchant’s board pack. The number in the board pack is the share of attempted payments that completed.
Investment Activity
Investment activity and capital flows
A layer that scales without a balance sheet
Acceptance processing is one of the few financial businesses that grows without capital. Adyen earned EUR 1,302.9 million of net revenue in the first half of 2026 on EUR 803.8 billion of processed volume — a take rate in the low teens of basis points — at a 49 per cent EBITDA margin, with capital expenditure at about 5 per cent of net revenue. The constraint on growth is not funding. It is merchant acquisition and integration.
That changes what an investment question in this market even is. The honest version is not how much capital it takes, but what the capital buys, and there are only three answers.
| What capital buys | Japanese example | Effect on take rate | Effect on multiple |
|---|---|---|---|
| Authorisation and completion performance | Issuer connectivity, tokenisation, retry logic, fraud scoring | Protects the rate by making the provider non-substitutable | Highest, because it is the merchant’s own KPI |
| Method and rail coverage | Wallet acceptance, unified QR, bank and convenience-store rails | Raises revenue where the rail carries a spread | Moderate; coverage is copyable within a cycle |
| Merchant locations | Subsidised terminals, discounted onboarding, wallet incentives | Lowers the blended rate immediately | Negative if unmanaged |
What the 2019 reward programme actually funded
The code-payment land grab in Japan was not venture-funded and it was not a payments innovation story. It was a fiscal response to a consumption tax increase. From October 2019, for nine months, a point-reward programme supported cashless payment at small and medium merchants as a demand-smoothing measure accompanying the tax rise, and it ran alongside terminal subsidies and low-interest financing for merchants adopting cashless.
Read structurally, that programme bought merchant locations and consumer habits with public money, at a moment when the private return on either was negative. The industry that emerged is real and durable. But the cost of acquiring those locations was never in a payments company’s P&L, and any forecast that assumes the same acquisition economics going forward is assuming a subsidy that has already been spent.
Small-merchant financing as adoption policy
METI’s policy framework includes a low-interest lending facility through the Japan Finance Corporation, aimed at small and micro businesses adopting cashless payment, explicitly targeting two anxieties: the working-capital effect of a delayed settlement cycle, and the burden of the merchant fee itself. That is a distinctive Japanese instrument. Rather than capping the fee, the state finances the merchant’s cost of paying it.
For the forecast, the relevant point is that adoption support is still being spent on the margin where revenue per merchant is lowest. It is efficient policy and it is dilutive revenue.
Capability versus locations
Two strategies are visible and the market prices them very differently. Buying capability — orchestration, fraud scoring, reconciliation, payouts, embedded lending — attaches new revenue to volume that already exists, at near-zero marginal cost. Buying locations adds volume at a rate near the cost of serving it, and in Japan it requires terminals, salespeople and merchant education in a market where merchant density outside the major metros is low.
The only growth in this layer that does not dilute the take rate is software sold to merchants already processing on the platform. That is why the code-payment channel in this report grows fastest at 10.58 per cent and why the acceptance layer as a whole still only reaches 2.16 per cent.
What to conclude
Capital allocation in Japanese acceptance is a statement about which half of the business an operator believes in. Money spent on authorisation and software defends the take rate. Money spent on merchant locations buys growth the model assumes will be priced near zero. Both are rational. Only one shows up in a revenue CAGR.
Technology & Innovation
Technology and innovation
The technology’s purpose is completion, not price
Almost every innovation in this layer exists to complete a payment that would otherwise fail, or to make a payment possible on a rail the merchant could not otherwise reach. Neither reduces what the merchant pays. Both make the provider harder to replace. That is why a blended take rate can fall for eight years while individual providers hold or raise their rate on the accounts they care about.
Table: what is moving in Japan specifically
| Capability | What it changes in Japan | Who captures the value |
|---|---|---|
| JPQR, the unified QR standard | One merchant-facing code for multiple wallet brands, built to the EMVCo standard by the Cashless Promotion Council | Acquirers and terminals, by lowering the cost of accepting a second and third wallet |
| Cross-border QR interoperability | Inbound visitors paying with a home-market wallet at a Japanese merchant under government-to-government arrangements | The merchant and the acquiring layer, through incremental tourism volume |
| Tokenisation | Replaces the card number with a network-issued token that survives card replacement | The provider holding the token, which becomes the system of record |
| Phishing takedown networks | Cross-issuer closure of sites that harvest card credentials, coordinated by the card industry associations | The issuer primarily; the acceptance layer through lower fraud and dispute cost |
| Payments the consumer does not notice | METI’s stated long-term vision: the intention to pay remains the consumer’s, the act of paying disappears into the interface | Whoever owns the interface, which is increasingly not a payments company |
| Corporate card and B2B acceptance | Extends card economics into business-to-business settlement that was historically invoiced | Issuers first; the acquiring layer through higher average ticket |
Two are deflationary and four are not
JPQR and cross-border QR interoperability both reduce the cost and effort of accepting a new wallet, which is good for merchants and neutral-to-negative for the fee, because they commoditise the acceptance integration. Tokenisation, fraud suppression, interface ownership and B2B acceptance all either defend or extend the fee.
The code-payment boom is usually described as the technology story of Japanese payments. It is more accurately a standards story. What JPQR did was make the merchant’s terminal indifferent between wallet brands — and a merchant who is indifferent between wallets is a merchant who negotiates on price, because the cost of saying no has fallen.
Fraud is the adoption constraint, not the cost line
The reason to treat fraud as a technology topic rather than a risk appendix is that it decides where merchants are willing to expand acceptance. Phishing that harvests card credentials is the dominant attack pattern against Japanese cardholders, and the industry’s response has been collective: from April 2025 domestic card companies began closing confirmed phishing sites through a shared takedown arrangement, coordinated with the card industry association and the anti-phishing council, with the participating group subsequently widening from eight companies to thirteen and the volume of closed URLs reaching roughly fifty thousand by the time the expansion was announced in March 2026.
That is a genuine technology investment with no revenue attached to it. It is also the precondition for the last seven points of cashless penetration: a small merchant in a thin catchment adopts acceptance when the downside is a monthly fee, and does not when the downside is a dispute they cannot investigate.
The maturity question
This is a mature technology market with low patent intensity. The innovation is in configuration, coverage and standards rather than in protected mechanism, and there is no defensible technology moat to sustain a price premium. The durable advantages are data on authorisation performance for a specific merchant’s traffic, coverage of the methods that actually clear on one contract, and switching cost in integration and reconciliation. All three are real; none of them appears in a technology roadmap, which is why a provider’s own narrative about innovation is a poor guide to its revenue.
Market Risk
Market risk and disruption
The risk that matters is the fee, not the volume
Japan’s volume is about as forecastable as any market in the world: the government publishes the target, the statistics are annual, audited by three separate bodies and revised transparently. The uncertainty in this report sits almost entirely on the price side, and it is a political uncertainty rather than a commercial one.
Risk 1 — merchant-cost politics
The 40 per cent adoption goal was met early, and the replacement target was set on a denominator that flatters the number. What is left of the policy agenda is cost. METI and the Japan Fair Trade Commission have already published interchange standard rates and merchant-fee allocation ratios, and the guideline for small merchants sets out what cashless operators must disclose. Each of those steps makes the fee more negotiable, and none of them is reversible in practice.
This is the risk with the largest effect on the forecast and the smallest visibility. A take rate falling to 51.1 basis points by 2033 is our base case; a faster decline is entirely plausible, and it would lower revenue without touching a single volume assumption.
Risk 2 — code-payment economics under compression
Code-payment operators earn a merchant fee with no interchange inside it, and fund consumer rewards out of it. That model works on scale and it works less well on a compressed fee. The pressure is asymmetric: the operator cannot reduce the reward without losing the consumer habit that produces the merchant’s willingness to pay, and cannot raise the merchant fee in a market where the ministry publishes allocation ratios. Watch the reward line, not the user count.
Risk 3 — the last seven points are the thin ones
Converting the remaining merchants adds locations and transaction count faster than value. Because the fee is charged on value, that mix shift is deflationary by construction. It is also where the operating cost per acquired merchant is highest and where disclosure obligations are newest.
Risk 4 — demography and catchment
An ageing population with a shrinking rural merchant base limits both the value available and the density needed to serve it profitably. The same demographic that makes cash sticky in thin catchments also caps the ticket sizes that would make those merchants worth acquiring. Japan’s cashless story is increasingly an urban story, and the residual is expensive to reach.
Risk 5 — operational and data risk
This layer concentrates sensitive data and single points of failure. The sector’s own record shows both sides of it: card-industry coordination closed roughly fifty thousand phishing URLs after the April 2025 takedown arrangement began, while in November 2026 one of the largest domestic acquirer-gateways published an apology and notice regarding the potential theft of certain customer information. Incidents of that kind do not change a take rate directly. They change merchant willingness to consolidate volume onto one provider, which slows the migration that produces scale economics.
Risk 6 — cash as resilience, and as competition
Cash is the fallback rail in a country with high seismic exposure, and that is a legitimate reason for merchants and consumers to keep it. It is not a reason to expect the cashless ratio to stall — the ratio has risen every year — but it does cap how completely any single digital rail can become the default, and it constrains the case for removing cash handling from a merchant’s cost base.
What is not a risk, and is often sold as one
Technology substitution is frequently presented as an existential threat to this layer. It is not. Tokenisation, orchestration, agentic credentials and payout settlement all defend or extend the fee. Only account-to-account rails genuinely deflationary, and in Japan the debit rail that would carry them has spent two decades at 3.4 per cent of the numerator. The substitution risk in this market is slower than the narrative, and the price risk is faster.
Regulatory Landscape
Regulatory and policy environment
Japan regulates this market through disclosure, not through price caps
That is the single most important thing to understand about the Japanese acceptance layer, and it is the opposite of the European approach. Europe legislated the interchange ceiling and then mandated instant-payment parity. Japan published the components of the merchant fee and let merchants negotiate. The effect on a five-year forecast is slower and, in our view, more durable.
The Cashless Promotion Study Group and the 2025 reset
METI convened its Cashless Promotion Study Group and published its summary in December 2025, after the previous government goal — around 40 per cent by 2025 — had been met early. The summary replaced it with a two-tier structure: 65 per cent by 2030 and 80 per cent long term, both on the domestic indicator, equivalent to 55 per cent on the international comparison indicator. The reason for moving the target onto the domestic basis is disclosed in the summary itself: the international denominator includes imputed rent for owner-occupied housing, about JPY 57 trillion or roughly 17 per cent of the total, so a target set on it is partly a target nobody can transact.
For this market the consequence is precise. Seven percentage points of headroom to 2030, and about twenty-two to the long-term goal, are all in the small-merchant, low-ticket tail. That is a policy ambition with a weak revenue multiplier, which is why the volume CAGR in this report is 4.54 per cent against a revenue CAGR of 2.16 per cent.
Interchange disclosure, 2022
METI, working with the Japan Fair Trade Commission, published the standard rates for credit card interchange — the fee an acquirer pays the issuer on a card transaction — in September and November 2022. The stated purpose was to raise market transparency and give merchants information they could use in price negotiations, with the explicit aim of easing the merchant cost burden as cashless usage rose. It is not a cap. It is a published reference price for a component that had been invisible.
Merchant-fee allocation, 2023
In June 2023 METI published the allocation ratios of the merchant fee — how the discount a merchant pays divides between issuer, scheme and acquirer. This is the second and more consequential disclosure, because it converts a single opaque number into three visible ones, and it tells a merchant exactly which party to argue with.
For an acceptance layer that earns a spread over interchange, a published allocation is a direct constraint on that spread. It does not set the fee; it removes the informational asymmetry that sustained it.
The small-merchant disclosure guideline
Alongside the disclosure programme, METI published a guideline for code-payment and cashless operators on what they must disclose to small merchants — the fee structure, the settlement cycle and the conditions attached to the service. This addresses the segment where the last seven points live, and where the merchant has the least negotiating power and the least ability to compare offers.
Standards and self-regulation
JPQR, the unified QR code standard, was drawn up by the Cashless Promotion Council to the EMVCo international standard, and METI has used it as the basis for government-to-government interoperability arrangements with other Asian markets, including memoranda with Indonesia in 2022 and Cambodia in 2023. Industry bodies carry much of the operational rule-making: the Japan Consumer Credit Association for card statistics and credit information, the Payments Japan Association for code-payment usage data, and cross-industry arrangements for fraud and phishing suppression.
Licensing
Payment services in Japan operate under the Payment Services Act and related financial regulation, with funds-transfer obligations determining which activities require registration. The practical relevance for a foreign entrant is not the licence itself but the pairing of licence with a domestic settlement and sponsorship arrangement; that pairing is the barrier, and it is why global platforms have entered through partnership.
Forward outlook to 2033
Between 2026 and 2033, expect the policy emphasis to move from consumer adoption to merchant cost, because the adoption goal is nearly met and the cost debate is not. Three things follow. Disclosure is likely to extend rather than retreat, and code-payment operators will face the same transparency the card acquirers did. Interchange will stay a published reference rather than a cap, unless the merchant-cost debate changes register. And cross-border QR interoperability will keep expanding as a tourism and trade policy instrument, which benefits the accepting layer without raising the fee it earns on each transaction.
The regulatory risk to this forecast is therefore not a price cap. It is that transparency accelerates the take-rate decline faster than the base case assumes — which would be good for merchants, good for cashless penetration, and bad for anyone who bought this layer on its historical spread.