Company Profile
Bridgestone Corporation
Bridgestone Corporation is a Japanese tyre and rubber group that sells tyres, retread services and mobility solutions in more than 150 countries and regions. For the year ended 31 December 2025 it reported revenue of ¥4,429.5bn, adjusted operating profit of ¥493.7bn and an adjusted operating margin of 11.1 per cent. Nine months into the following year it reported record revenue and record adjusted operating profit — ¥3,554.3bn and ¥445.3bn respectively — and on 12 November 2026 raised its full-year revenue guidance to ¥4,700bn while leaving profit guidance unchanged.
The company is at the end of a structural programme it calls “business restructuring and rebuilding (2nd stage)”, under which it has closed or reduced capacity at plants in the United States, Spain, Belgium, Brazil and Argentina, transferred non-core materials businesses and rewritten its regional cost base. The programme shows most clearly in truck and bus tyres, where adjusted operating profit rose 53 per cent in FY2025, and in Europe, the Middle East and Africa, where the margin rose from 3.6 per cent to 5.0 per cent in FY2025 and reached 6.7 per cent over the first nine months of FY2026.
Reference data
The identifiers below are the ones this page is bound to. The Wikidata item and the Pheonix entity identifier are the keys that link the profile to the group’s market-report mentions elsewhere on this site.
| Item | Value |
|---|---|
| Legal name | Bridgestone Corporation |
| Listing | Tokyo Stock Exchange and Fukuoka Stock Exchange; code 5108 |
| Established | 1 March 1931; founder Shojiro Ishibashi |
| Headquarters | 1-1, Kyobashi 3-chome, Chuo-ku, Tokyo 104-8340, Japan |
| Global CEO and Representative Executive Officer | Yasuhiro Morita (as of January 2026) |
| Vice President and Senior Officer, Global CFO | Naoki Hishinuma |
| Paid-in capital | ¥126,354m (31 December 2025) |
| Employees, consolidated | 115,716 (31 December 2025); 13,934 at the parent company |
| Manufacturing footprint | 105 plants at end-2025; about 120 manufacturing plants and R&D facilities in total |
| Markets served | More than 150 countries and regions |
| Wikidata | Q179433 |
| Pheonix entity identifier | MIEN-node_ad0b9267 |
| Corporate site | bridgestone.com |
| Latest full-year filings | Consolidated financial statements, fiscal year ended 31 December 2025 (IFRS) |
Executive summary
FY2025 was a flat year at the top line and a slightly better one at the operating line. Revenue of ¥4,429.5bn was unchanged on FY2024 and adjusted operating profit rose 2.2 per cent to ¥493.7bn, lifting the margin to 11.1 per cent from 10.9 per cent. Reported operating profit fell 14.0 per cent to ¥381.2bn because the year carried ¥112.5bn of restructuring and impairment charges. Profit attributable to owners of parent rose 14.8 per cent to ¥327.3bn, helped by a ¥70.4bn reversal of tax expense relating to uncertain tax positions recognised in earlier years.
The nine months to 30 September 2026 are stronger than the guidance the company set itself in February. Revenue rose 9.9 per cent to ¥3,554.3bn and adjusted operating profit rose 20.9 per cent to ¥445.3bn, lifting the margin to 12.5 per cent. Of the ¥76.9bn increase in adjusted operating profit, ¥44.0bn came from currency; excluding currency the increase was ¥32.9bn. On 12 November 2026 the company raised revenue guidance for the year to ¥4,700bn from ¥4,500bn and held adjusted operating profit guidance at ¥515bn and profit guidance at ¥340bn, citing a more difficult fourth quarter as raw material costs rise.
|
FY2025 revenue
¥4,429.5bn
Flat on FY2024
|
FY2025 adjusted operating profit
¥493.7bn
11.1% margin, +0.2 pts
|
Nine months FY2026 revenue
¥3,554.3bn
+9.9 per cent, a record
|
FY2026 revenue guidance
¥4,700bn
Raised from ¥4,500bn
|
| Period | Highlight |
|---|---|
| FY2025 operating result | Adjusted operating profit ¥493.7bn (+2.2 per cent); margin 11.1 per cent (+0.2 pts); operating profit ¥381.2bn after ¥112.5bn of restructuring and impairment charges |
| FY2025 net profit | ¥327.3bn (+14.8 per cent), including a ¥70.4bn reversal of tax expense on uncertain tax positions recorded in prior years |
| Cost and tariff pressure | Direct U.S. tariff cost of about ¥25bn in FY2025 and about ¥55bn assumed for FY2026; ¥24bn incurred in the first nine months of FY2026 |
| Nine months FY2026 | Revenue ¥3,554.3bn (+9.9 per cent) and adjusted operating profit ¥445.3bn (+20.9 per cent), both records; profit attributable ¥318.9bn (+57 per cent); margin 12.5 per cent |
| Guidance, 12 November 2026 | Revenue raised to ¥4,700bn; adjusted operating profit held at ¥515bn; profit held at ¥340bn; the company flags potential upside but expects a tougher fourth quarter |
| Capital returns | ¥300bn buyback completed and cancelled in FY2025 (7.3 per cent of shares); ¥150bn buyback and ¥150bn of straight corporate bonds completed in 2026 (3.5 per cent of shares cancelled) |
| Dividend | ¥230 per share for FY2025 (+¥20); a further ¥10 increase planned for FY2026, stated on the post-split basis as ¥125 |
| Operations | Fire at the Tosu plant in Japan on 8 November 2026 damaged part of the vulcanisation line; partial production resumed on 11 November; the financial effect is described as limited |
Company overview
Business description
Bridgestone manufactures and sells tyres and sells the services that surround them. The premium tyre business covers passenger car and light truck tyres, truck and bus tyres, and specialties — off-the-road tyres for mining and construction, aircraft tyres, agricultural tyres and motorcycle tyres. The solution business covers commercial business-to-business solutions including mining, aviation and retread services sold largely under the Bandag name; a retail network operating under banners including TiresPlus, Firestone Complete Auto Care, Wheel Works and Speedy; and a mobility technology business the company describes as strategic. Diversified products covers air springs, chemical and industrial products, and sports and cycle goods.
The group sells under two principal tyre brands, Bridgestone and Firestone, and has run a multi-brand strategy in North America since the second stage of its restructuring began: Bridgestone is positioned at the premium end and Firestone is being revived as the volume brand. Two platforms carry the technology story — ENLITEN, the lightweight low-rolling-resistance tyre architecture, and MASTERCORE, the truck and bus casing platform — and the company has said both will move from their first to their second generation during 2026.
| Business | Revenue (¥bn) | Adjusted operating profit (¥bn) | Margin | Profit vs FY2024 |
|---|---|---|---|---|
| Tyre business (core) | 2,935.6 | 377.0 | 12.8% | 102% |
| Solutions business (growth) | 1,420.7 | 111.9 | 7.9% | 143% |
| — retail | 1,058.7 | 69.7 | 6.6% | 126% |
| — commercial BtoB solutions | 362.0 | 42.2 | 11.7% | 182% |
| Diversified products business | 287.1 | 11.3 | 3.9% | n.m. |
| Group total | 4,429.5 | 493.7 | 11.1% | 102% |
The simple total of the business lines does not equal consolidated revenue, because retail tyre sales are counted inside both the tyre business and the retail line and because of consolidation eliminations. “Profit vs FY2024” is the company’s own index with FY2024 equal to 100.
Organisational structure and footprint
Bridgestone reorganised its executive structure with effect from 24 March 2026, placing a Global CEO, a Global CFO and a set of functional chiefs alongside regional operating companies. Profit and loss responsibility sits with the operating units: BSJP for the Japan tyre business, BSDP for diversified products, BSAM for the Americas including both North and Latin America, BSEMEA for Europe, the Middle East and Africa, BSAPIC for Asia Pacific, India and China, G-MICA for global mining, industrial, construction and aviation tyres, and WEST Retail for the retail network. Cross-functional and global optimisation responsibility sits with an EAST CEO, a WEST CEO, a Chief Product Officer, a Chief Manufacturing Officer, a Chief Innovation Officer and a Chief Quality Officer. The company states that the structure is intended to concentrate resource allocation on technology and competitiveness.
At the end of December 2025 the group operated 105 manufacturing plants and, including research and development sites, about 120 facilities. More than 150 countries and regions are served, and the consolidated workforce was 115,716, of whom 13,934 were employed by the parent company in Japan.
| Plant type | Americas | Europe, Middle East and Africa | Asia Pacific, India and China | Japan | Total |
|---|---|---|---|---|---|
| New tyre plants | 14 | 10 | 12 | 10 | 46 |
| Other tyre-related plants | 8 | 1 | 4 | 11 | 24 |
| Raw materials plants | 4 | 2 | 5 | 2 | 13 |
| Diversified products plants | 6 | 2 | 5 | 9 | 22 |
| Number of plants | 32 | 15 | 26 | 32 | 105 |
Financial performance
Key financial highlights
| Metric | FY2024 | FY2025 | Change | 9M FY2025 | 9M FY2026 | Change |
|---|---|---|---|---|---|---|
| Revenue | 4,430.1 | 4,429.5 | flat | 3,234.9 | 3,554.3 | +9.9% |
| Adjusted operating profit | 483.3 | 493.7 | +2.2% | 368.4 | 445.3 | +20.9% |
| Adjusted operating margin | 10.9% | 11.1% | +0.2 pts | 11.4% | 12.5% | +1.1 pts |
| Operating profit | 443.3 | 381.2 | −14.0% | — | — | — |
| Profit before tax | — | 354.7 | — | — | — | — |
| Profit attributable to owners of parent | 285.0 | 327.3 | +14.8% | 203.5 | 318.9 | +57% |
| ROIC | 8.2% | 8.3% | +0.2 pts | — | — | — |
| ROE | 8.1% | 8.6% | +0.5 pts | — | — | — |
| Capital expenditure | 389.8 | 365.9 | −6.1% | 221.6 | 213.9 | −3.5% |
| Depreciation and amortisation | 348.1 | 353.2 | +1.5% | 265.4 | 277.4 | +4.5% |
| Free cash flow | 293.8 | 435.5 | +141.7 | 243.7 | 309.7 | +66.0 |
| Dividend per share (¥) | 210 | 230 | +20 | — | — | — |
FY2025 figures exclude the anti-vibration rubber business, which the group classifies as discontinued operations; FY2024 comparatives are restated on the same basis. The FY2025 profit figure includes a ¥70.4bn reversal of tax expense relating to uncertain tax positions recorded in prior years.
Revenue breakdown
Two cuts of the revenue line matter for reading this business. The first is geographic, and it shows a group whose profits are spread very unevenly: Japan earned a 15.7 per cent adjusted operating margin in FY2025 on ¥1,265.9bn of revenue, while Europe, the Middle East and Africa earned 5.0 per cent on ¥852.9bn. The second is by product, and it shows where the restructuring is working: truck and bus tyres lifted their margin by three points in FY2025 and by a further 0.8 points over the first nine months of FY2026, while specialties remain by some distance the most profitable category in the group.
| Segment | FY2024 revenue | FY2025 revenue | FY2025 adjusted operating profit | FY2025 margin | 9M FY2026 revenue | 9M FY2026 margin |
|---|---|---|---|---|---|---|
| Japan | 1,226.1 | 1,265.9 | 198.1 | 15.7% | 965.5 | 17.8% |
| Americas | 2,180.0 | 2,130.5 | 201.5 | 9.5% | 1,753.4 | 9.0% |
| Europe, Middle East and Africa | 835.6 | 852.9 | 42.4 | 5.0% | 682.7 | 6.7% |
| Asia Pacific, India and China | 529.7 | 517.8 | 59.6 | 11.5% | 424.7 | 11.8% |
Segment revenue is reported before consolidation eliminations and includes sales between regions, so the four segments sum to more than consolidated revenue. The nine-month Americas margin carries a change in intercompany royalty rates, which raised operating expenses by about ¥8.6bn in the Americas and about ¥5.7bn in Europe, the Middle East and Africa, offset within corporate and eliminations.
| Product | FY2025 revenue | FY2025 adjusted operating profit | FY2025 margin | 9M FY2026 revenue | 9M FY2026 adjusted operating profit | 9M FY2026 margin |
|---|---|---|---|---|---|---|
| Passenger car and light truck tyres, including retail and the credit card business | 2,500.6 | 268.6 | 10.7% | 1,999.0 | 234.3 | 11.7% |
| Truck and bus tyres, including retread | 1,018.4 | 88.4 | 8.7% | 816.6 | 77.8 | 9.5% |
| Specialties: off-the-road, aircraft, agricultural and motorcycle tyres | 623.4 | 125.5 | 20.1% | 519.2 | 126.9 | 24.4% |
| Diversified products | 287.1 | 11.3 | 3.9% | 219.5 | 6.2 | 2.8% |
Profitability analysis
The nine-month bridge is the clearest single statement of how the group is currently making money. Starting from ¥368.4bn of adjusted operating profit in the nine months of FY2025, volume added ¥23.0bn, price added ¥12.0bn, mix added ¥5.0bn, conversion costs added ¥18.0bn and other items added ¥7.9bn, while operating expenses took out ¥33.0bn and raw material costs were flat on the year. Currency contributed a further ¥44.0bn. The result was ¥445.3bn. Within that, the company reported a U.S. tariff cost impact of ¥24.0bn for the nine months and a ¥1.0bn negative price effect from market-linked contracts.
Beneath the group margin the dispersion is wide. Specialties ran a 24.4 per cent adjusted operating margin over the first nine months of FY2026, with ultra-large mining tyres described as remaining strong. Japan ran 17.8 per cent, up 3.3 points, supported by yen depreciation, premium passenger tyre replacement sales and strong original-equipment demand. The Americas, the group’s largest region by revenue, ran 9.0 per cent, one point lower than a year earlier. Diversified products ran 2.8 per cent, with the air-spring business in the Americas its strongest part at 4.8 per cent and sports and cycle in loss.
|
FY2025 adjusted margin
11.1%
+0.2 pts on FY2024
|
Nine months FY2026 margin
12.5%
+1.1 pts on FY2025
|
ROIC, FY2025
8.3%
9.1% guided for FY2026
|
ROE, FY2025
8.6%
9.5% guided for FY2026
|
The gap between adjusted and reported profit is now almost entirely a restructuring charge. FY2025 carried ¥112.5bn of adjustment items, led by ¥38.3bn for truck and bus, retread, retail and agricultural tyre plant rebuilding in Europe and ¥26.6bn for truck and bus plant rebuilding in North America, leaving reported operating profit of ¥381.2bn. Those charges are the cost of the second-stage programme, which the company has said is nearly complete.
| Item | ¥bn |
|---|---|
| Europe truck and bus, retread, retail and agricultural tyre plant rebuilding | 38.3 |
| North America truck and bus tyre plant rebuilding | 26.6 |
| Latin America business rebuilding | 12.8 |
| Impairment of the air spring business in the Americas | 10.9 |
| North America agricultural tyre plant and business footprint optimisation | 5.5 |
| Other | 18.4 |
| Total adjustment items | 112.5 |
Balance sheet and cash flow
The balance sheet carries the restructuring comfortably. At 30 September 2026 total assets were ¥5,768.1bn against ¥5,747.7bn at the end of 2025, total equity was ¥3,732.8bn and the equity ratio was 63.8 per cent. Gross interest-bearing debt of ¥887.1bn against cash of ¥722.7bn implies a small net debt position. Free cash flow in the nine months was ¥309.7bn, ¥66.0bn more than a year earlier, after ¥213.9bn of capital expenditure and ¥277.4bn of depreciation and amortisation. Inventories rose ¥54.3bn to ¥939.8bn, of which finished products were ¥600.1bn, and the cash conversion cycle held at 171 days.
| Item | 31 Dec 2025 | 30 Sep 2026 | Change |
|---|---|---|---|
| Total assets | 5,747.7 | 5,768.1 | +20.4 |
| Cash and cash equivalents | 713.8 | 722.7 | +8.8 |
| Inventories | 885.5 | 939.8 | +54.3 |
| Total liabilities | 2,027.8 | 2,035.3 | +7.5 |
| Interest-bearing debt, gross | 827.0 | 887.1 | +60.0 |
| Total equity | 3,719.9 | 3,732.8 | +12.9 |
| Equity ratio | 63.7% | 63.8% | +0.0 pts |
| Cash conversion cycle | 171 days | 171 days | −1 day |
SWOT analysis
|
Strengths
|
Weaknesses
|
|
Opportunities
|
Threats
|
Recent developments
Strategic moves
| Date | Development |
|---|---|
| November 2024 | Announces closure of the Lanklaar retread plant in Belgium, part of the European retread consolidation. |
| January 2025 | Announces closure of the LaVergne truck and bus plant in the United States, capacity and workforce reductions at the Des Moines agricultural tyre plant, workforce reductions in corporate, sales and operations, and business rebuilding in Argentina and Brazil. |
| April 2025 | Announces capacity reductions at the Bilbao and PSM plants in Spain, including agricultural tyres. |
| June 2025 | Announces the stock transfer of Bridgestone Logistics Co., Ltd. |
| July 2025 | Announces transfer of the carbon black business in Thailand; the equivalent transfer in Mexico follows in August 2025. |
| January 2026 | Announces transfer of the steel cord businesses in Thailand and China, extending the withdrawal from internal materials manufacturing. |
| 24 March 2026 | New executive management structure takes effect, with a Global CEO, a Global CFO, an EAST CEO and a WEST CEO, functional chiefs for product, manufacturing, innovation and quality, and seven operating units with profit and loss responsibility. |
| 8–12 November 2026 | Fire at the Tosu plant in Japan damages part of the vulcanisation line; all processes are halted and partial production restarts on 11 November 2026. The cause investigation continues. |
Financial developments
| Date | Development |
|---|---|
| 16 February 2026 | Reports FY2025 revenue of ¥4,429.5bn, adjusted operating profit of ¥493.7bn and profit attributable to owners of parent of ¥327.3bn; sets FY2026 guidance of ¥4,500bn revenue, ¥515bn adjusted operating profit and ¥340bn profit. |
| 16 February 2026 | Announces a capital policy to widen the return on invested capital spread over the cost of capital while keeping an industry-leading credit rating: a buyback of up to ¥150bn and up to ¥150bn of straight corporate bonds. |
| During FY2025 | Completes the previous ¥300bn buyback and cancels all acquired shares, equal to 7.3 per cent of shares outstanding before cancellation; raises ¥200bn of debt through straight bonds and syndicated loans. |
| 12 November 2026 | Reports record nine-month revenue of ¥3,554.3bn (+9.9 per cent), adjusted operating profit of ¥445.3bn (+20.9 per cent) and profit attributable to owners of parent of ¥318.9bn (+57 per cent), with free cash flow of ¥309.7bn. |
| 12 November 2026 | Raises FY2026 revenue guidance to ¥4,700bn from ¥4,500bn on revised exchange-rate assumptions, the Middle East situation and the effect of business measures; holds adjusted operating profit at ¥515bn and profit at ¥340bn. |
| 12 November 2026 | Confirms the ¥150bn buyback is complete and the shares cancelled, equal to 3.5 per cent of shares outstanding before cancellation, and that ¥150bn of debt financing has been raised as planned. |
Business strategy
The stated objective is to “establish the foundation for growth and get back to the world’s number one position by 2031”, the group’s centenary year. The vehicle is the 2024–2026 mid-term plan, internally called 24MBP, whose second stage is the restructuring and rebuilding programme now drawing to a close. The company describes 2025 as a year of “emergency and crisis management” and 2026 as a move “toward growth with quality”.
| Pillar | What the company discloses | The number behind it |
|---|---|---|
| Attractive and competitive products and manufacturing | Product power and manufacturing excellence placed at the centre of growth, with ENLITEN and MASTERCORE moving to second generations and heavier research and capital allocation | More than 25 new passenger tyres in 2026; research spending of ¥130.0bn and capital expenditure of ¥410.0bn planned |
| Global portfolio and brand | Multi-brand strategy in North America, reinforcing Bridgestone and reviving Firestone, with a return to global motorsport as a brand platform | Sole tyre supplier to Formula E from the 2026–27 season; programmes in INDYCAR, SUPER GT and the FIM Endurance World Championship |
| Business quality and lean operation | Cost reduction run through what the company calls its own Deming plan, with shop-floor practice at the centre and global optimisation of the supply chain against tariffs | ¥72bn of business cost reduction in FY2025, ¥42bn above the February guidance; ¥147bn cumulative over 2024–2025 |
| Portfolio management | Tyre manufacture as the core, solutions and retail as the growth business, diversified products held to a profitability test, and non-core materials businesses transferred out | A 12.8 per cent margin in the tyre business and 7.9 per cent in solutions; a footprint reduced from about 160 sites in 2019 |
| Capital policy and returns | Improve profitability, fund growth investment and manage the balance sheet to widen the return on invested capital spread while defending the credit rating | FY2026 guidance of 9.1 per cent ROIC and 9.5 per cent ROE, against 8.3 per cent and 8.6 per cent in FY2025 |
Focus-market strategy
The regional plans are not variations on a single theme. Europe has been managed for quality rather than volume, with the company having said it targets a margin around 7 per cent for 2026, having recovered to 5.0 per cent in FY2025 from 3.6 per cent a year earlier. North America is run for quality plus volume, with the multi-brand strategy carrying passenger tyre sales and the rebuilt truck and bus footprint carrying profit. Asia Pacific, India and China is where the group expects volume growth, with India named explicitly. Japan is the profit anchor and the base for ultra-large mining tyre exports.
| Region | Revenue (¥bn) | Margin | Stated priority and driver |
|---|---|---|---|
| Japan | 965.5 | 17.8% | Premium passenger tyres in the replacement market, strong original-equipment sales and ultra-large mining tyres; an integrated and simplified East organisation |
| Americas | 1,753.4 | 9.0% | Quality plus volume in North America; multi-brand passenger strategy; truck and bus original-equipment recovery; Latin America held near break-even while Brazil is rebuilt |
| Europe, Middle East and Africa | 682.7 | 6.7% | Quality over volume; premium and high-rim-diameter tyre growth; truck and bus turnaround and retail improvement, with a margin around 7 per cent targeted for 2026 |
| Asia Pacific, India and China | 424.7 | 11.8% | India as a growth market and a leader of group growth; benefits from rebuilding the Thailand business; profitability measures in China after the 2024 withdrawal from truck and bus tyres there |
Where Pheonix models add a number the company does not disclose
Bridgestone does not publish a share of the global tyre market. Dividing its disclosed revenue by the market size in Pheonix’s own tyre model gives a sizing estimate, and it is a useful one because both the numerator and the denominator are built the same way for the two largest non-Chinese manufacturers.
| Step | Value |
|---|---|
| Bridgestone FY2025 revenue | ¥4,429.5bn |
| Average exchange rate reported by the company for FY2025 | ¥150 per US dollar |
| Bridgestone revenue in US dollars | US$29.5bn |
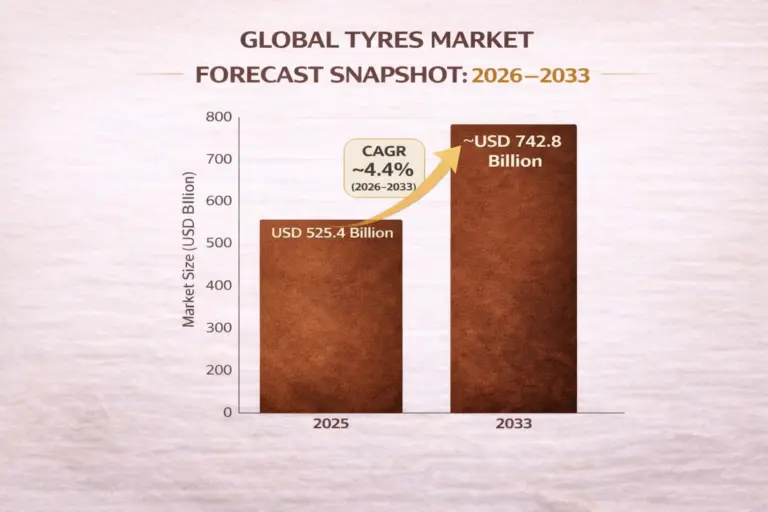
| Pheonix global tyre market base, 2025 | US$525.4bn |
| Bridgestone implied share | 5.62% |
| Michelin implied share, same method | 5.09% |
| The two together | 10.71% |
Comparability runs one way: the Pheonix pool covers the whole tyre value chain including distribution and retail layers, and Bridgestone consolidates a retail network of its own, so the ratio flatters the manufacturer slightly. Bridgestone’s revenue also carries ¥287.1bn of diversified products, which is not tyre revenue at all. The figure is a sizing device, not a market-share claim, and it is stated as such.
Data status
Basis of preparation. All figures are for continuing operations unless stated. The group classifies its anti-vibration rubber business as discontinued operations, and FY2024 comparatives are restated on the same basis, so FY2024 revenue and profit here differ from figures published before that reclassification.
Segment totals. Reporting-segment revenue is presented before consolidation eliminations and includes inter-regional sales; the four segments therefore sum to more than consolidated revenue. Segment margins are as reported by the company.
Per-share amounts. The FY2026 dividend plan is stated as ¥125 per share on the post-split basis, equivalent to ¥250 on the pre-split basis used for the FY2025 figure of ¥230.
Guidance and open items. Guidance is as revised on 12 November 2026. The financial effect of the 8 November 2026 Tosu plant fire is still under assessment; the company has said it expects the effect on full-year guidance to be limited.
Sources
- Bridgestone Corporation, Consolidated Financial Statements for the Fiscal Year Ended December 31, 2025 (IFRS), 16 February 2026 — e_r7_4_results.pdf
- Bridgestone Corporation, Financial Results for Fiscal 2025 (presentation), 16 February 2026 — e_r7_4_presentation.pdf
- Bridgestone Corporation, Financial Results for 3rd Quarter of Fiscal 2026 (presentation), 12 November 2026 — e_r8_3_presentation.pdf
- Bridgestone Corporation, Corporate Profile — bridgestone.com/corporate/profile
- Bridgestone Corporation, Locations, manufacturing plant summary as of end-December 2025 — bridgestone.com/corporate/locations
- Bridgestone Corporation, Notice regarding the fire at the Tosu plant and resumption of production (in Japanese), 12 November 2026 — 2026111201.pdf
- European Rubber Journal, Bridgestone raises sales forecast on ‘record results’, 12 November 2026.
- Pheonix Research, global tyre market model, 2025 base year — used only for the implied-share calculation in Table 14.
Provenance. This profile is bound to Wikidata item Q179433 and to Pheonix entity MIEN-node_ad0b9267, which is the identity the graph uses when a market report names Bridgestone Corporation. It was compiled from the company’s own results statements and presentations, its corporate profile and locations pages, and its notice on the Tosu plant fire; no third-party research was used for any figure. Last verified November 2026.
Market Presence
Bridgestone Corporation is mentioned across 34 market reports.
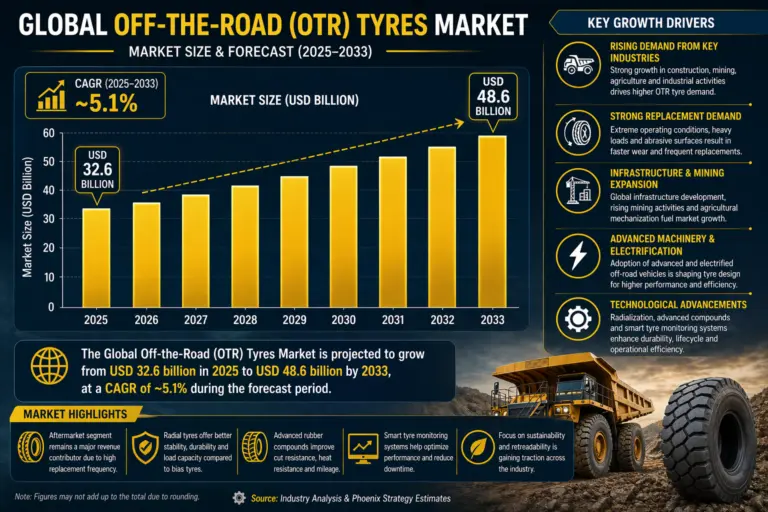
Global Off-the-Road (OTR) Tyres Market Report Size and Forecast 2026-2033
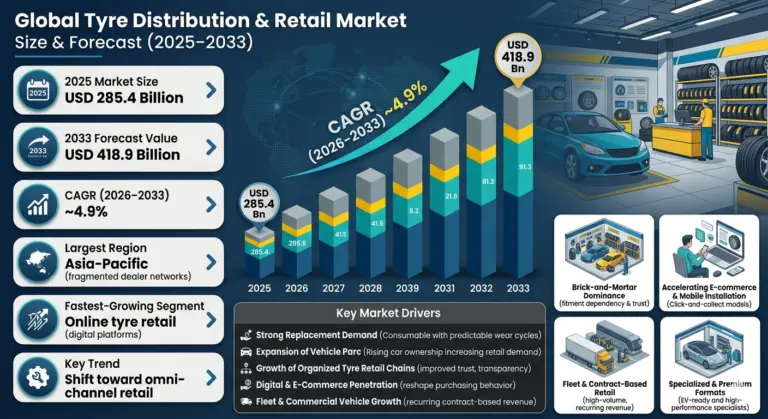
Global Tyre Distribution & Retail Market Size, Share & Forecast 2026-2033
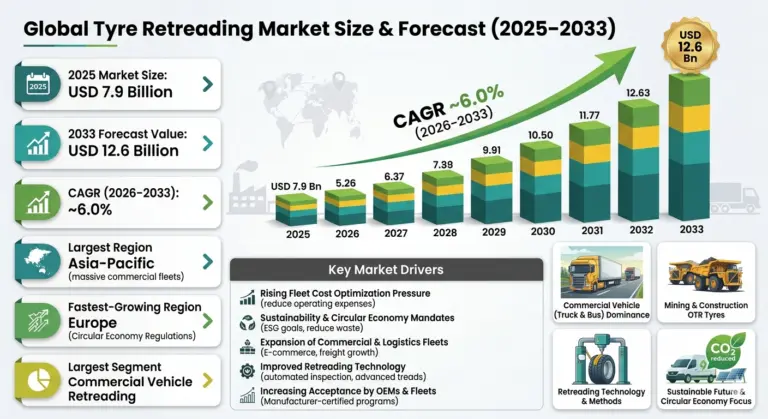
Global Tyre Retreading Market size , share & Forecast 2026-2033
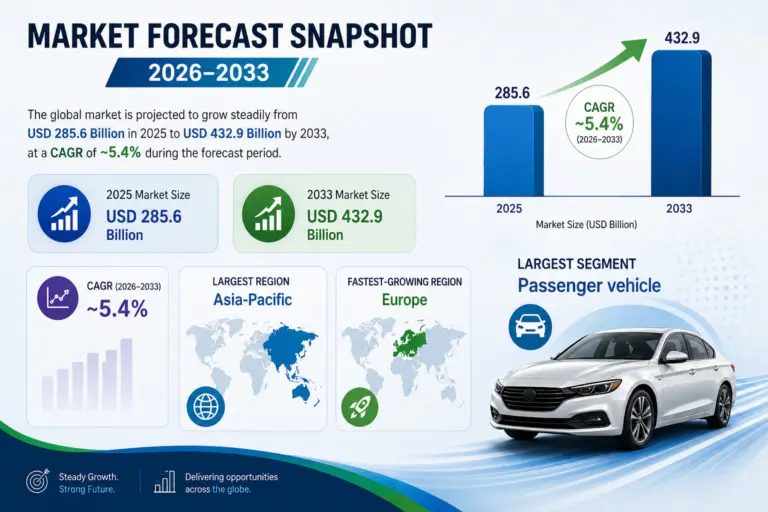
Global Tyre Replacement Market size, share & Forecast 2026-2033
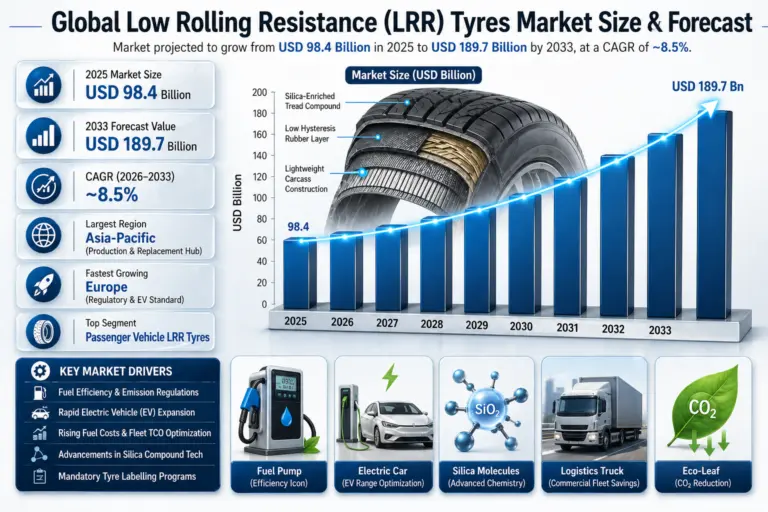
Global Low Rolling Resistance Tyres Market size, share & forecast 2026-2033
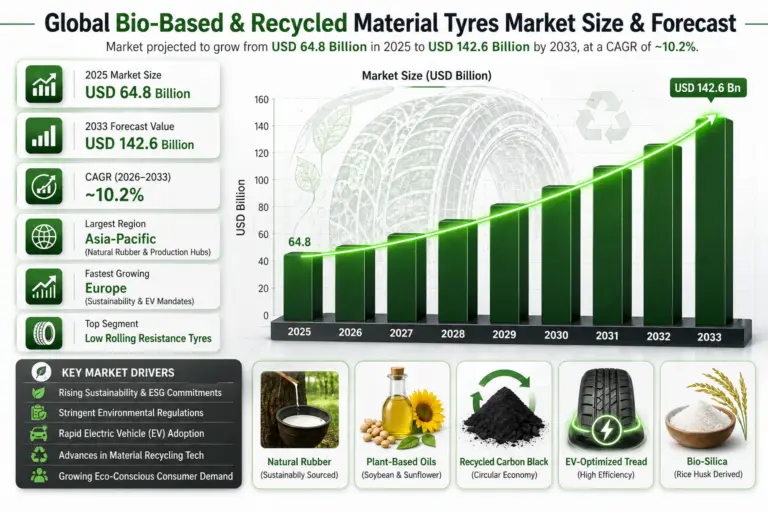
Global Bio-Based & Recycled Material Tyres Market size , share & forecast 2026-2033
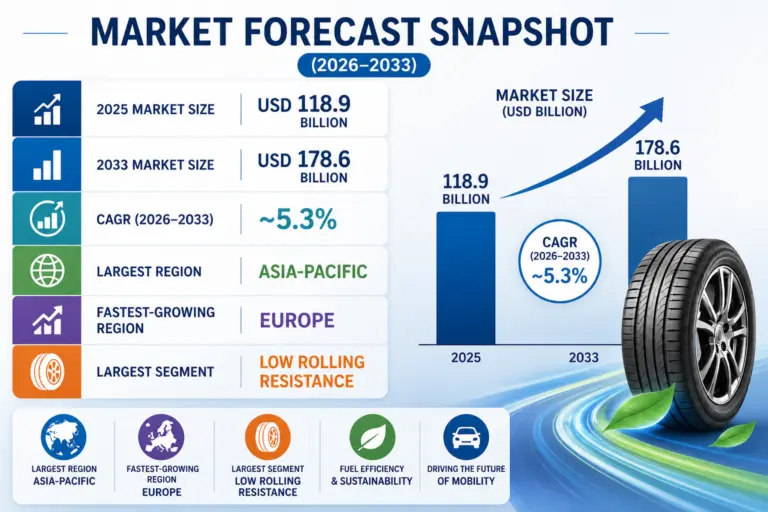
Global Sustainable & Green Tyres Market size, Share & Forecast 2026-2033
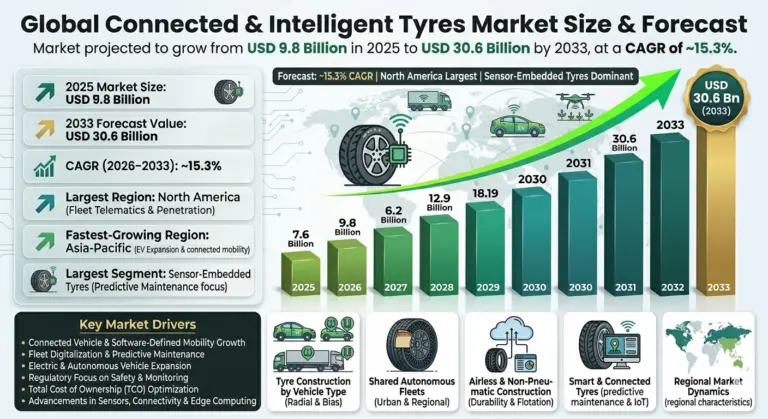
Global Connected & Intelligent Tyres Market size, share & forecast 2026-2033
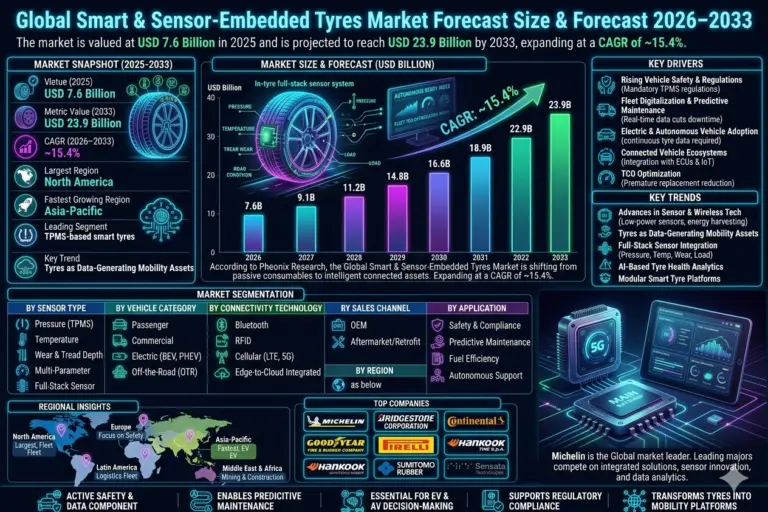
Global Smart & Sensor-Embedded Tyres size and share Analysis 2026-2033
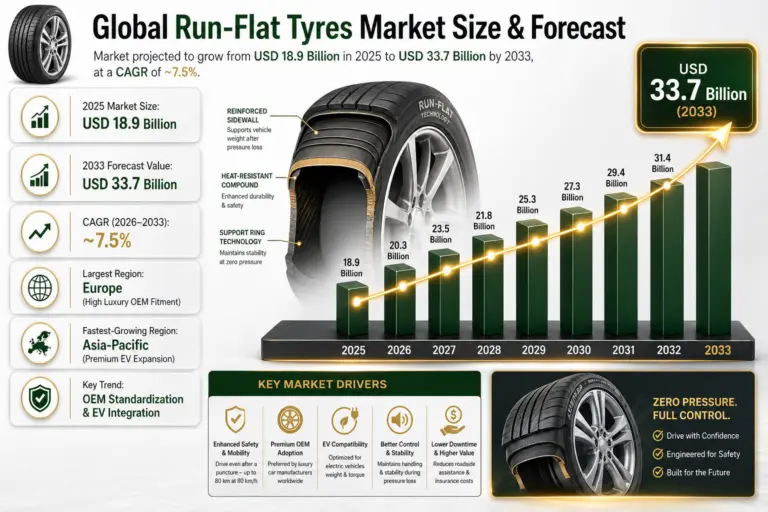
Global Run-Flat Tyres Market size , share & Analysis 2026-2033
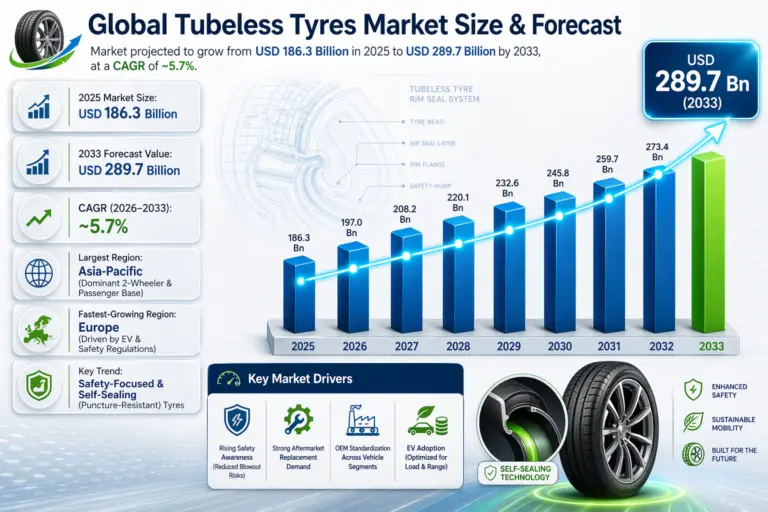
Global Tubeless Tyres Market size, share & forecast 2026-2033
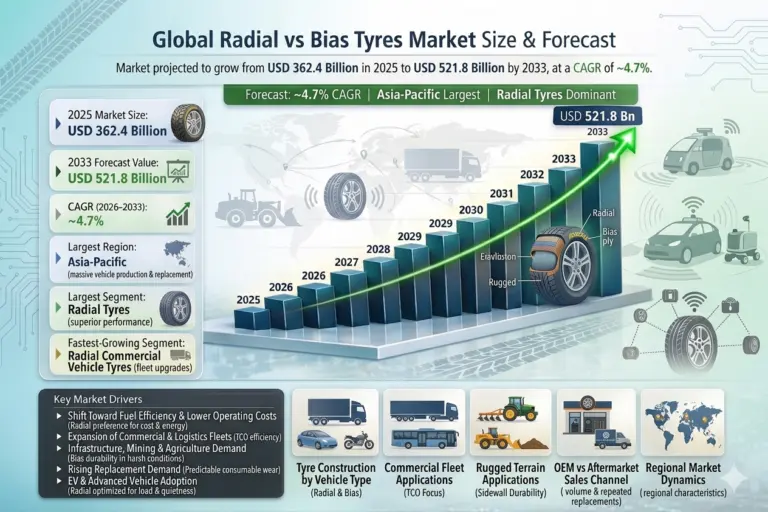
Global Radial vs Bias Tyres Market size , share & forecast 2026-2033
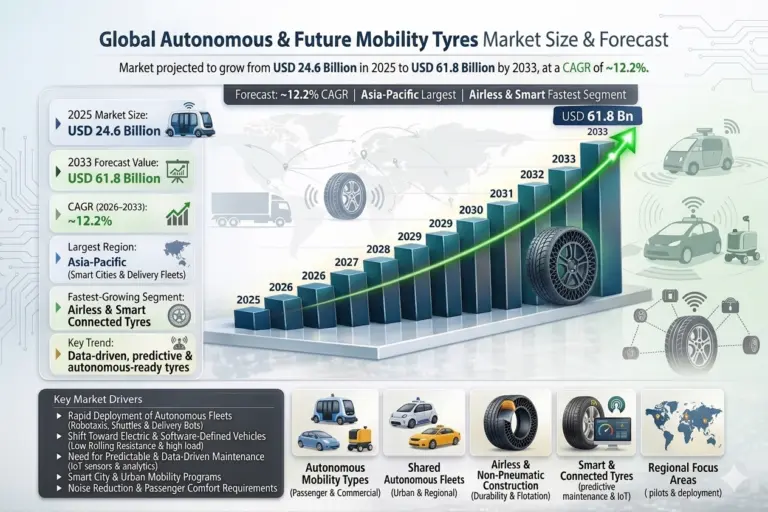
Global Autonomous & Future Mobility Tyres Market size,share & forecast 2026-2033
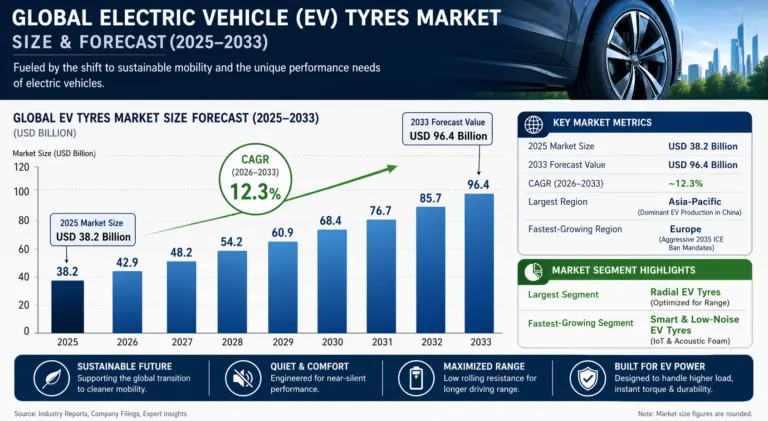
Global Electric Vehicle (EV) Tyres Market Size, share & forecast 2026-2033
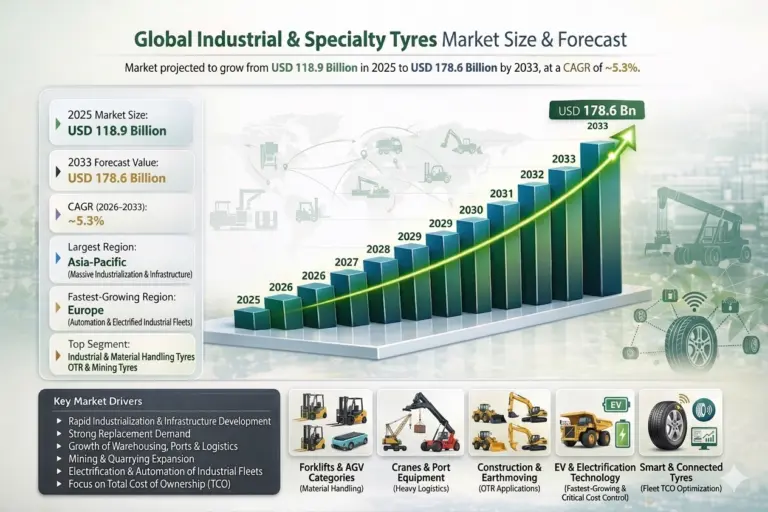
Global Industrial & Specialty Tyres Market size, share & forecast 2026-2033
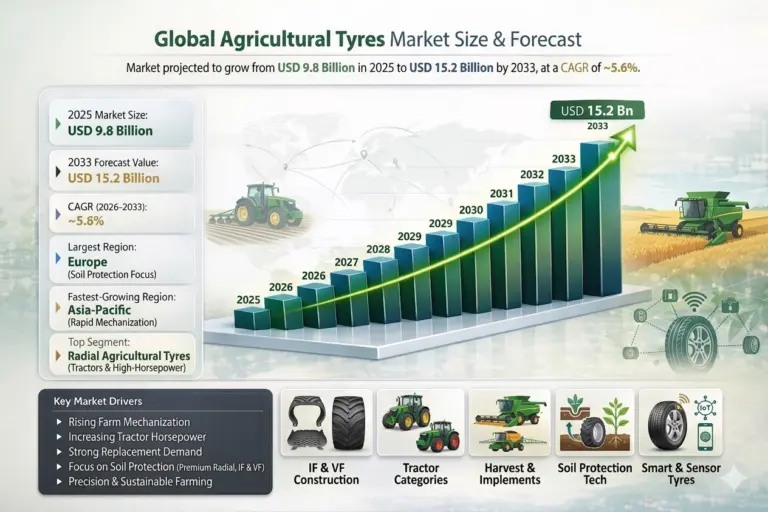
Global Agricultural Tyres Market size, share & forecast 2026-2033
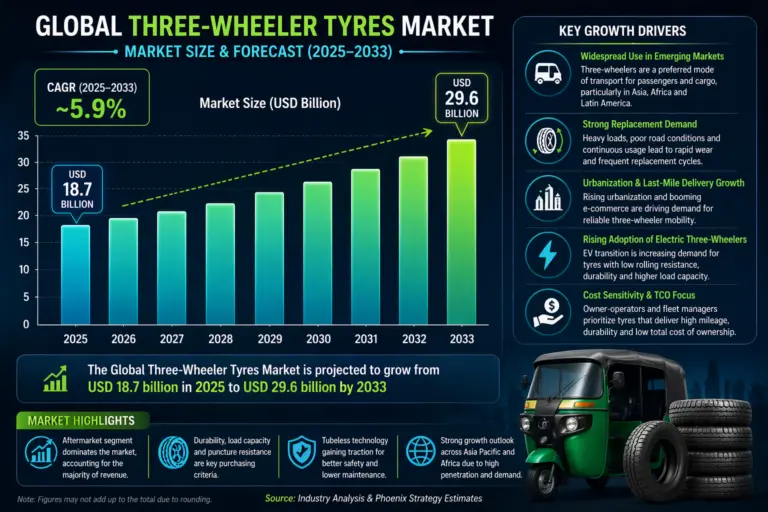
Global Three-Wheeler Tyres Market Report Size and Forecast 2026-2033
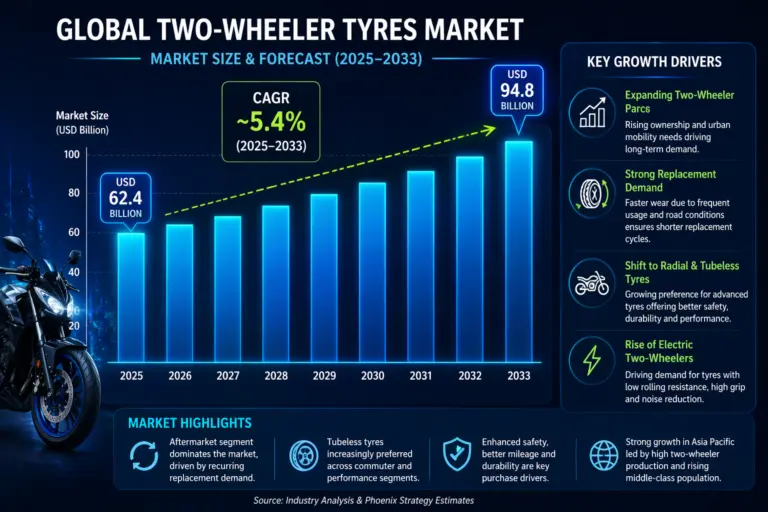
Global Two-Wheeler Tyres Market Report Size and Forecast 2026-2033
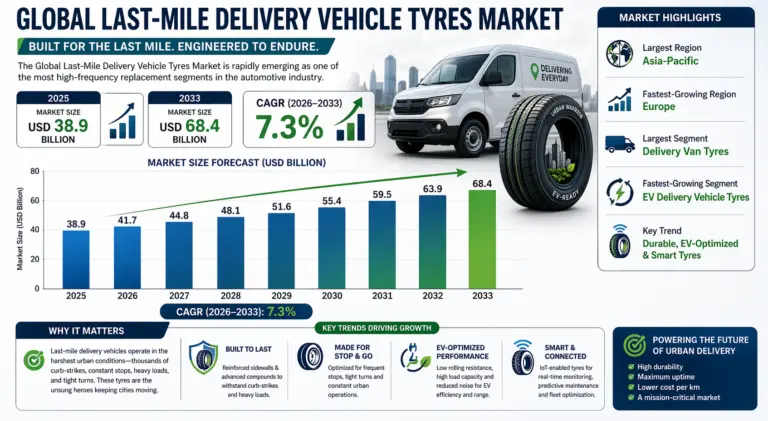
Global Last-Mile Delivery Vehicle Tyres Market Size, share & forecast 2026-2033
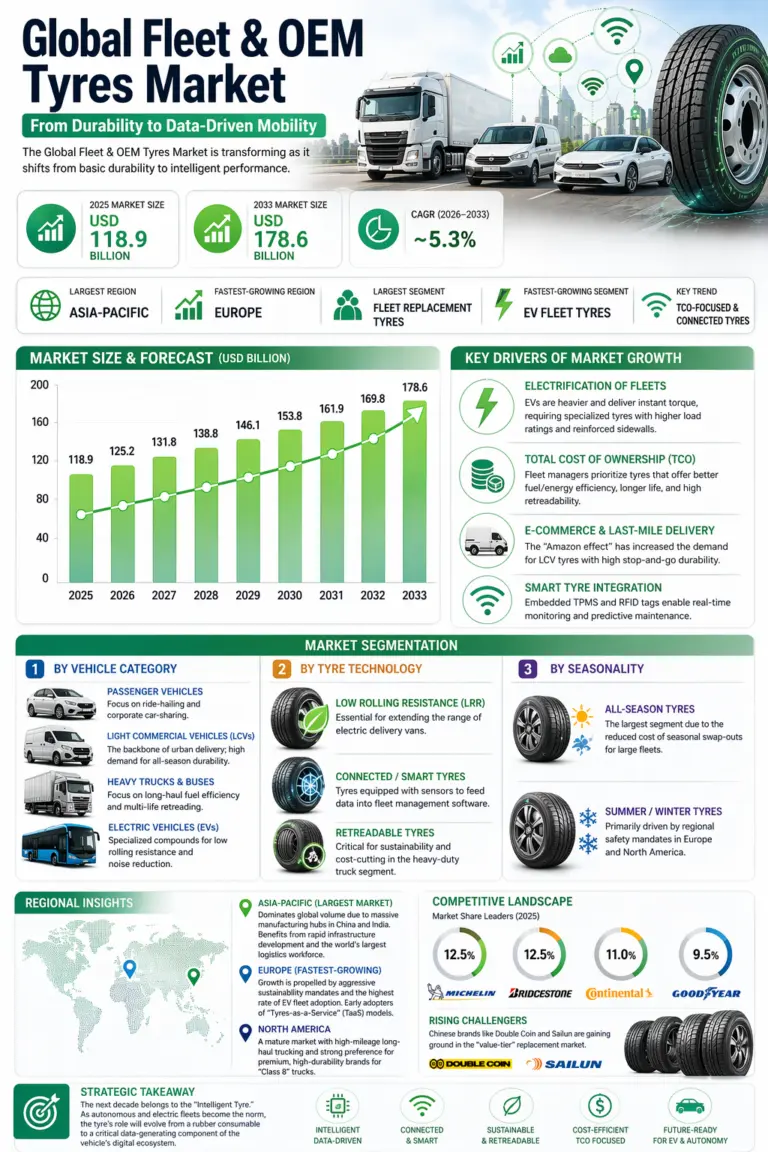
Global Fleet & OEM Tyres Market size, share & forecast 2026-2033
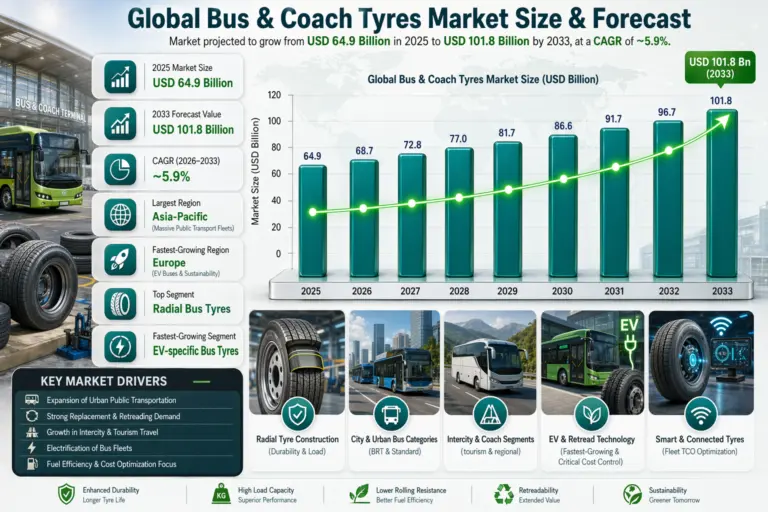
Global Bus & Coach Tyres Market size, share & forecast 2026-2033
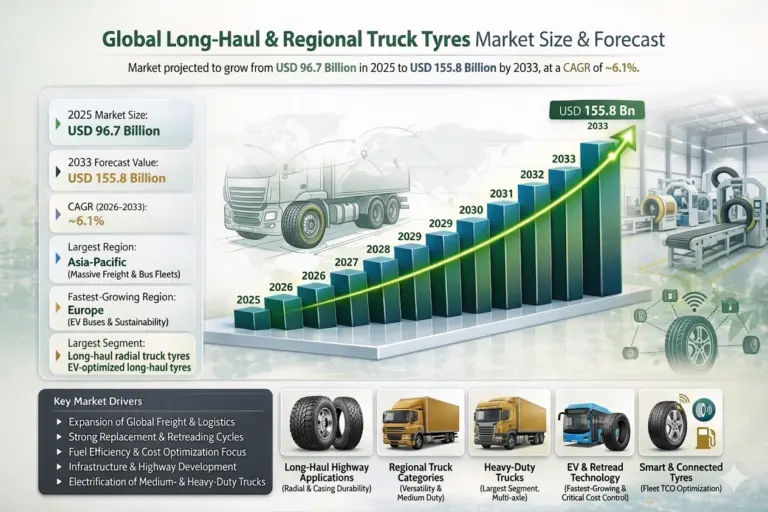
Global Long-Haul & Regional Truck Tyres Market size, share & forecast 2026-2033
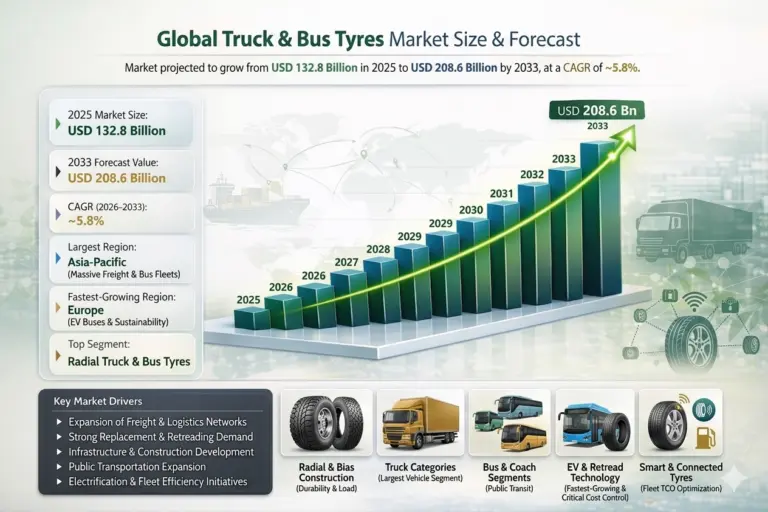
Global Truck & Bus Tyres Market size, share & forecast 2026-2033
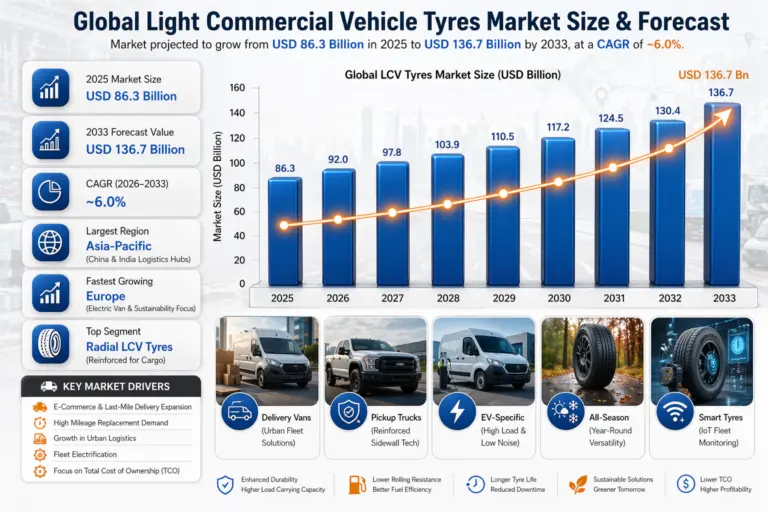
Global Light Commercial Vehicle Tyres Market size and share Analysis 2026-2033
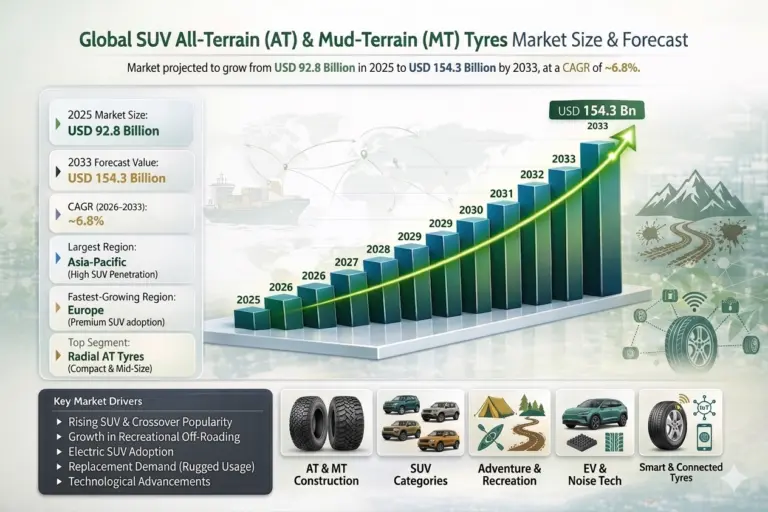
Global SUV All-Terrain (AT) & Mud-Terrain (MT) Tyres Market size and share Analysis 2026-2033
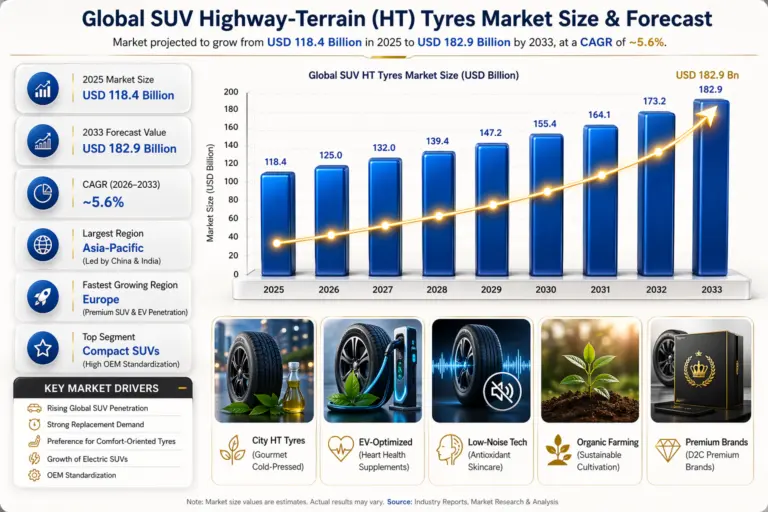
Global SUV Highway-Terrain (HT) Tyres Market size and share Analysis 2026-2033
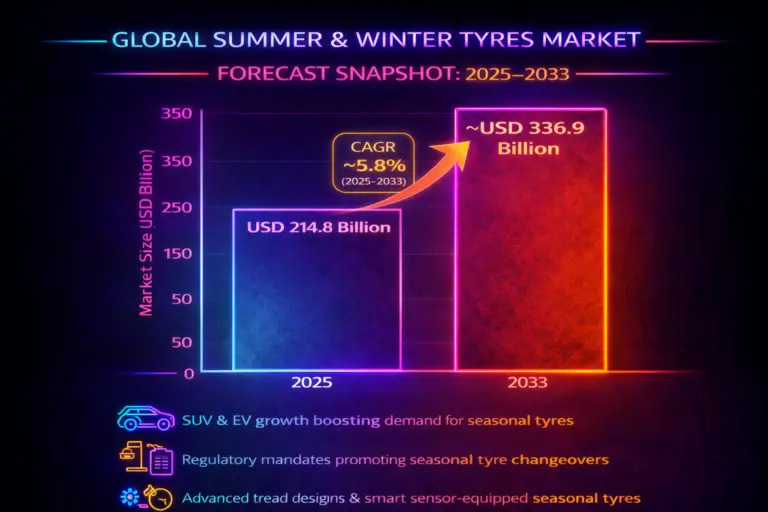
Global Summer & Winter Tyres Market Report, Size and Forecast 2026 -2033
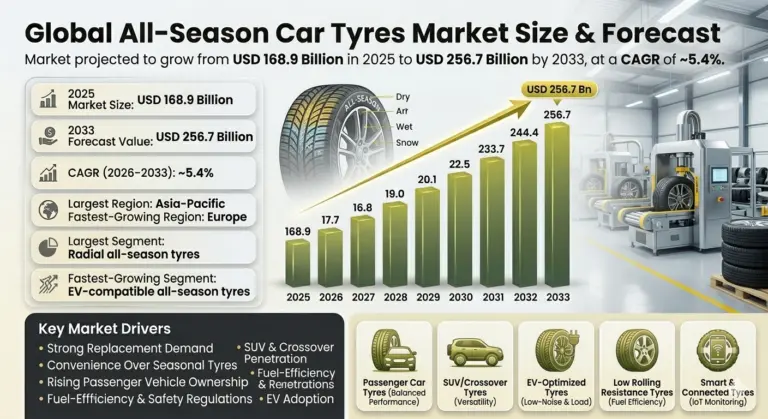
Global All-Season Car Tyres Market size and share Analysis 2026-2033
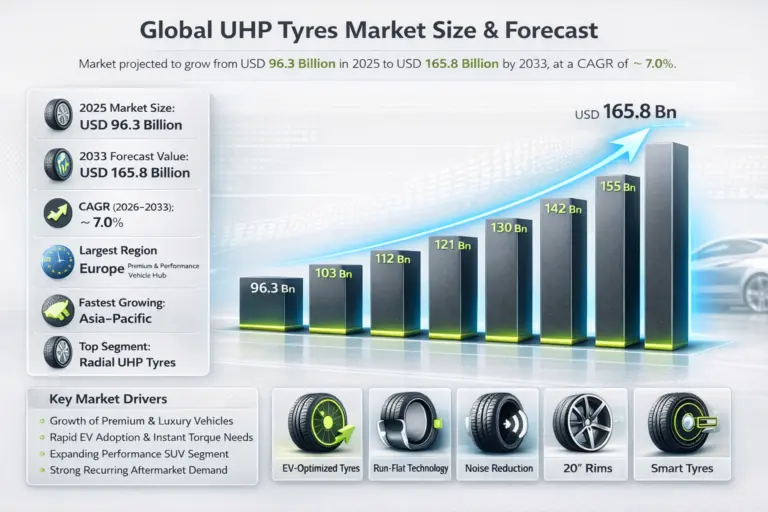
Global Ultra-High Performance (UHP) Tyres Market size and share Analysis 2026-2033
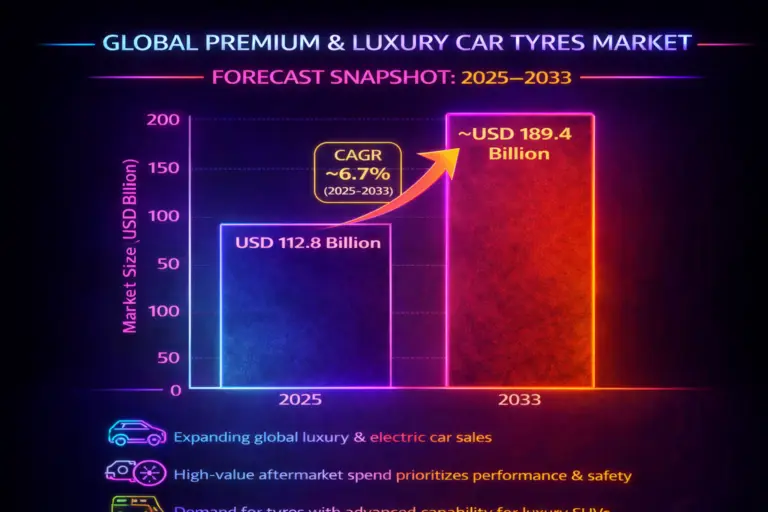
Global Premium & Luxury Car Tyres Market Report, Size and Forecast 2026 – 2033
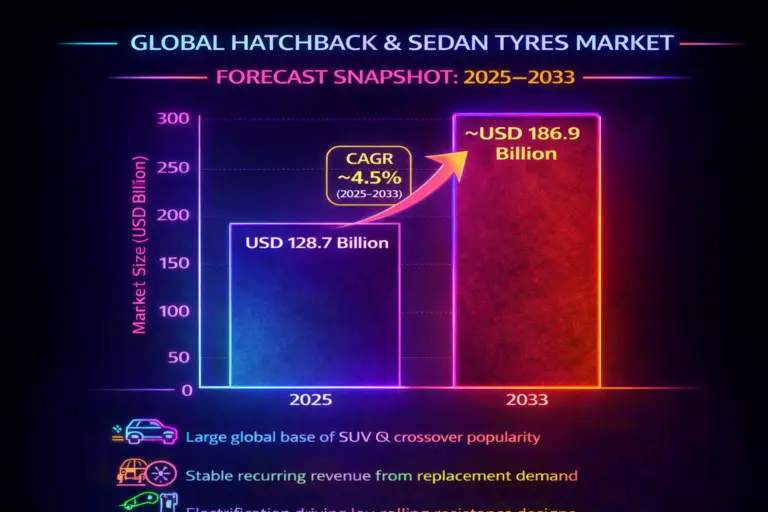
Global Hatchback & Sedan Tyres Market Report, Size and Forecast 2026 – 2033
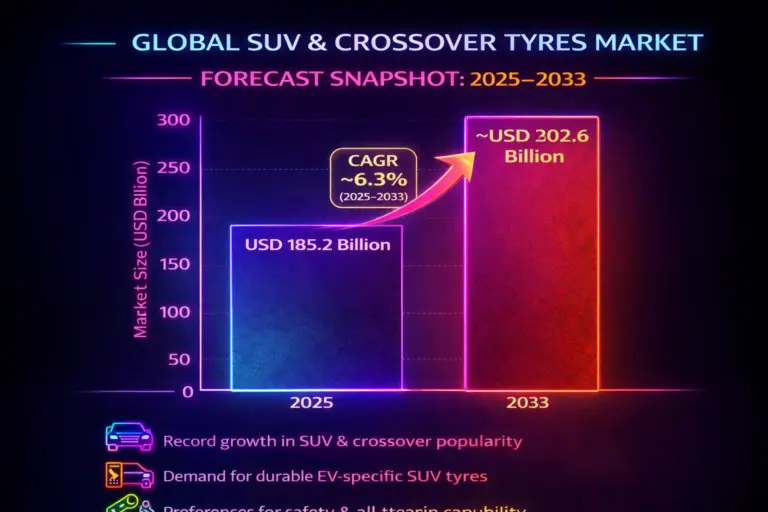
Global SUV & Crossover Tyres Market Report, Size and Forecast 2026- 2033
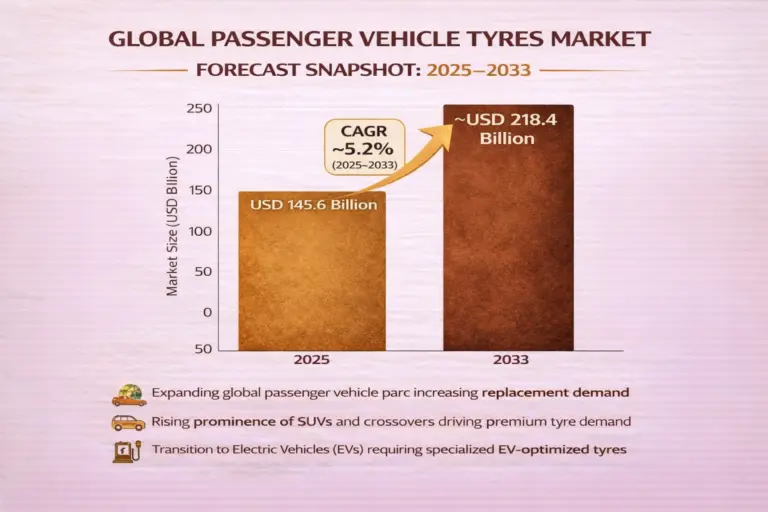
Global Passenger Vehicle Tyres Market Report, Size and Forecast 2026-2033