
Editorial Article
Shopify Grew GMV 29.48 Per Cent and Revenue 30.14 Per Cent. That 0.66 Points Is the Platform Market.
A marketplace can grow in exactly two ways: more volume, or more money per unit of volume. For a decade the first was doing the work. It is now the second, and a single company publishes enough detail to measure it to the basis point.
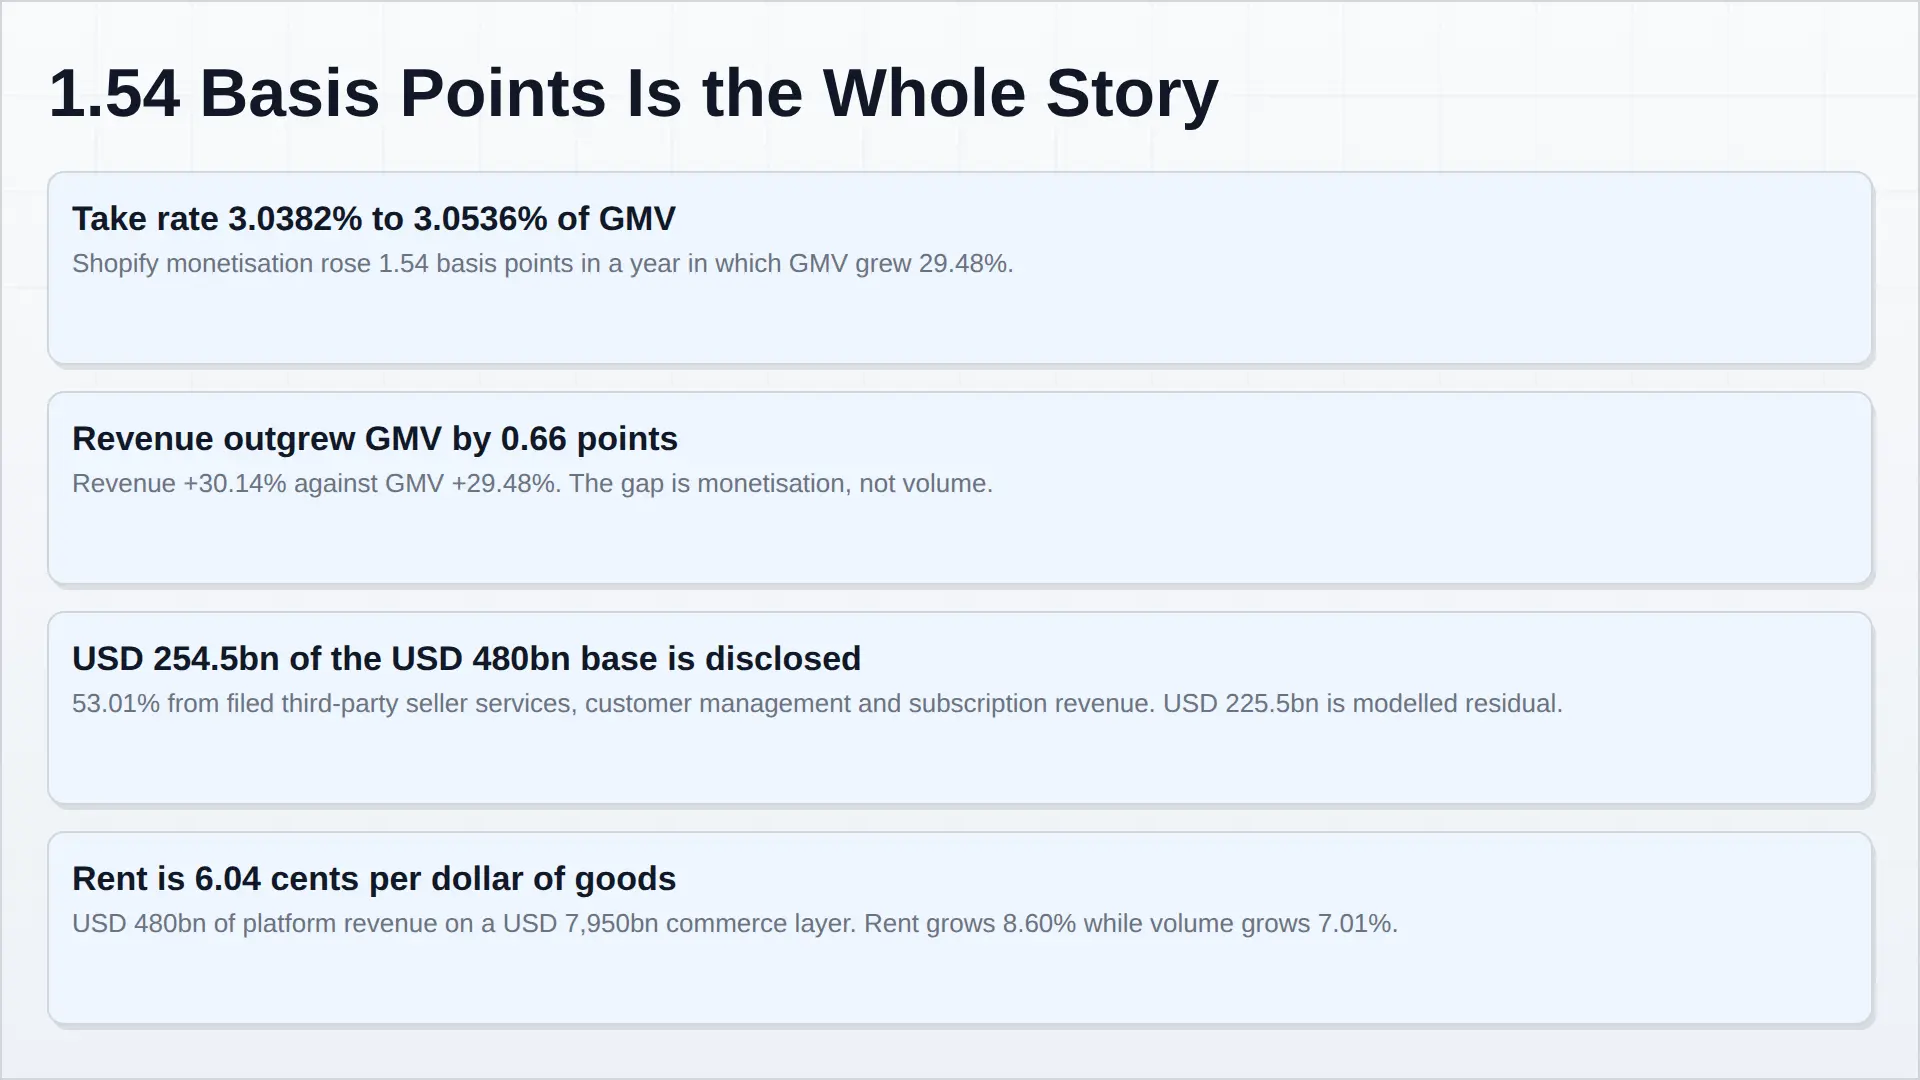
Shopify processed USD 378,441 million of merchant GMV in 2025, up 29.48 per cent, on revenue of USD 11,556 million, up 30.14 per cent. Revenue outgrew volume by 0.66 percentage points. In take-rate terms, monetisation moved from 3.0382 to 3.0536 per cent of GMV — a gain of 1.54 basis points. That is the mechanism that turns a commerce market growing 7.01 per cent into a platform layer growing 8.60 per cent, and it is worth understanding precisely, because 1.54 basis points is either a rounding error or the whole story depending on which side of the invoice you sit.
What the USD 480 billion actually is
The Global E-Commerce Platform Market Report 2026–2033 measures platform revenue as what a platform books for someone else’s transaction: commission, subscription and platform services on third-party and merchant commerce. It grows from USD 480.0 billion in 2025 to USD 928.7 billion in 2033 at 8.60 per cent, an increment of USD 448.7 billion. Set against the USD 7,950.0 billion the world spent online, it is 6.04 cents of rent on every dollar of merchandise.
The exclusion is what makes the number usable. Amazon booked USD 716.9 billion of net sales in 2025. Only USD 172.2 billion of that — 24.01 per cent — was seller-facing platform revenue. The rest was first-party inventory sold at Amazon’s own risk, advertising, and cloud infrastructure. Counting the whole USD 716.9 billion as “platform” would inflate the layer by an order of magnitude and describe a retailer as a marketplace.
Three companies disclose half the layer
| Disclosed seat | 2025 (USD m) | What it measures |
|---|---|---|
| Amazon third-party seller services | 172,162 | Commission and fulfilment fees on seller volume, up 10.26% |
| Alibaba customer management revenue | 49,850 | Merchant marketing and commission, RMB 343,867m, up 5% |
| Alibaba international commerce | 20,900 | Cross-border platform revenue, on RMB 144,170m, up 9% |
| Shopify | 11,556 | Subscription and merchant solutions, 3.05% of GMV |
| Total disclosed | 254,468 | 53.01% of the layer |
That leaves USD 225,532 million — 46.99 per cent — as a named but modelled residual: PDD Holdings, the JD.com marketplace, MercadoLibre, eBay, Sea Limited, Coupang, the Walmart marketplace, TikTok Shop, Etsy and the long tail of commerce software that never splits out a third-party line. It is the honest weak point of any sizing at this layer, and the report stress-tests it: a 25 per cent error in either direction puts the base at USD 423.6 billion or USD 536.4 billion.
Note what that means for the 1.54 basis points. The measured part of the market is precise enough to track monetisation to a hundredth of a per cent. The unmeasured part is nearly half the total. Anyone quoting a global platform take rate to two decimals is quoting an average of three filings and nine estimates.
Where 1.54 basis points comes from
Take the GMV and the revenue and divide, one year apart. Shopify’s monetisation rate rose 1.54 basis points while its merchants’ volume grew 29.48 per cent. Both halves of that sentence matter.
The volume half is the easy part: third-party commerce grows because retail keeps moving online. The monetisation half is the scarce part, because a platform cannot raise commission without a merchant comparing it to a competitor’s. What it can do is sell more things that are not commission.
The disclosed mix shows exactly that. Amazon’s third-party seller services grew 10.26 per cent while its own first-party online stores grew 9.01 per cent — the marketplace is compounding faster than the retailer inside it. Amazon’s advertising services reached USD 68,635 million, up 22.10 per cent, faster than any line except cloud. Shopify reported Gross Payments Volume up 37 per cent and Shop Pay GMV up 62 per cent, B2B GMV up 96 per cent off a small base, and offline revenue up 27 per cent because a point-of-sale terminal is a rent line on a physical transaction sharing a merchant record.
None of that is a commission increase. All of it raises revenue per transaction. That is the mechanism, and it is why the platform layer can outgrow the commerce beneath it without any merchant being charged a higher headline rate.
Alibaba’s version of the same move
Alibaba Group reported revenue of RMB 1,023,670 million in fiscal 2026, up 3 per cent, with customer management revenue up 5 per cent to RMB 343,867 million — and management attributed the gap to improvement in take rate. Same arithmetic, different currency, and a cleaner statement of intent than most platforms give.
Alibaba is also running the other strategy at the same time: quick commerce revenue rose 47 per cent to RMB 78,520 million, funded while the company was disposing of Sun Art and Intime. One hand raises the price of access to existing demand; the other buys frequency at a loss to raise future rent. Both are monetisation strategies. Only one of them shows up in a take rate this year.
What 1.54 basis points costs a merchant
On a merchant doing USD 50 million of GMV, 1.54 basis points is USD 7,700 a year. That is not a reason to renegotiate. It is a reason to read the invoice line by line, because the same 1.54 basis points, aggregated across USD 480 billion of rent, is the difference between a layer growing at the market’s rate and one growing 1.59 points faster than it.
The practical question for a merchant is therefore not “what is the commission” but “what am I paying for beyond commission, and could I buy it elsewhere”. A platform that answers that question badly is exposed; one that answers it with payment attach, fulfilment density and catalogue data is not, because those are services the merchant cannot reconstruct at the same cost.
Why the ceiling is switching, not demand
There is no evidence that consumer demand is the constraint on this layer’s growth. The constraint is that a merchant can leave. Commission is the most transparent price a platform charges and therefore the easiest to compare, which puts a hard ceiling on how far the headline rate can move. Services are where the ceiling is soft, because a seller comparing a fulfilment fee has no benchmark unless the platform gives it one.
Two risks follow, and neither is a demand risk. The first is regulatory: scrutiny of the services a platform sells to the sellers who depend on its ranking is rising, and the Digital Markets Act already constrains how designated gatekeepers may treat business users. The second is technological: if a model assembles the buyer’s shortlist, the platform’s search advertising inventory is worth less, and the defensible position shifts from being found on the platform to being readable by the machine. A platform whose take rate is carried by advertising is more exposed to that than one whose take rate is carried by payments and parcels.
Six cents above a quarter of a cent
Put the layers in order and the shape of a single consumer order appears. The platform takes 6.04 cents of the dollar. The payment gateway takes 26.71 basis points — under a third of a cent — and that rate is falling. In Japan, acceptance costs 61.4 basis points, about two thirds of a cent, set by the interchange regime rather than by any software decision.
So the rent is roughly twenty times the transaction fee, and the transaction fee is the part that regulators and engineers both keep trying to compress. That is the structural reason the commerce market grows 7.01 per cent while the layer above it grows 8.60: the small number at the bottom of the stack is competitive, and the large number at the top is not.
How this article and the report behind it were built
The research is roughly 70 per cent secondary and 30 per cent primary. The secondary layer is company filings and results releases for the disclosed seats, plus national retail statistics for the commerce layer beneath them. The primary layer is qualitative and carries no magnitude: merchant-side, platform-operator and payments-side conversations, conference and trade-show material, and open-ended interviews used to establish how a take rate is actually assembled — which lines a merchant sees, which it does not, and where switching friction really sits. No figure in this article comes from a primary conversation.
The disclosed-seat-plus-residual method, the named residual and the sensitivity around it are set out in chapters three and five of the underlying report. Where a number is model output rather than a filing — the 46.99 per cent residual above all — the report says so at the point of use.
Sources
Shopify Inc., full-year 2025 results: merchant GMV, revenue, Gross Payments Volume, Shop Pay GMV, B2B GMV and free cash flow. Amazon.com, Inc., 2025 annual report: net sales, third-party seller services, online stores and advertising services, via SEC EDGAR. Alibaba Group Holding Limited, fiscal 2026 results: group revenue, customer management revenue, international commerce and quick commerce. National retail statistics for the commerce layer beneath: US Census Bureau, Quarterly Retail E-Commerce Sales, and the National Bureau of Statistics of China.
Frequently Asked Questions
What is the size of the global e-commerce platform market?
USD 480.0 billion in 2025, rising to USD 928.7 billion in 2033 at an 8.60 per cent CAGR — an increment of USD 448.7 billion. That is 6.04 cents of platform rent on every dollar of the USD 7,950.0 billion spent online in 2025.
How much does a platform earn per dollar of merchandise sold?
6.04 cents across the whole layer. Individually: Shopify takes 3.05 per cent of its merchants' USD 378,441 million of GMV, and Amazon's USD 716.9 billion of 2025 net sales contained USD 172.2 billion of seller-facing platform revenue, or 24.01 per cent.
How much of the platform market is disclosed in company filings?
53.01 per cent, or USD 254,468 million, from Amazon third-party seller services, Alibaba customer management revenue and international commerce, and Shopify. The remaining 46.99 per cent, USD 225,532 million, is a named but modelled residual; a 25 per cent error either way puts the base at USD 423.6 billion or USD 536.4 billion.
Why is the platform layer growing faster than e-commerce itself?
Take-rate drift. Third-party GMV grows 7.01 per cent across the forecast while the platform layer grows 8.60. Shopify's monetisation rose 1.54 basis points in a year in which GMV grew 29.48 per cent, and Alibaba attributed customer management revenue growth of 5 per cent against group revenue of 3 per cent to take-rate improvement.