
Global Supplement & Nutraceutical Contract Manufacturing (CDMO) Market Report, Size, Share and Forecast 2026–2033
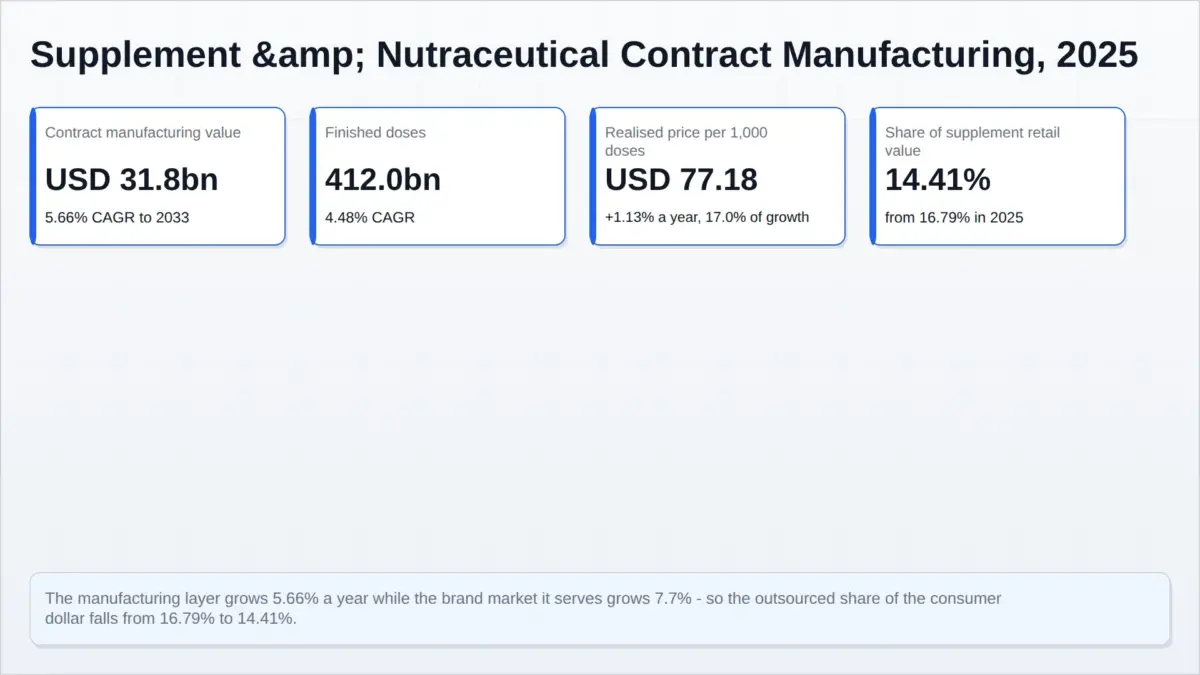
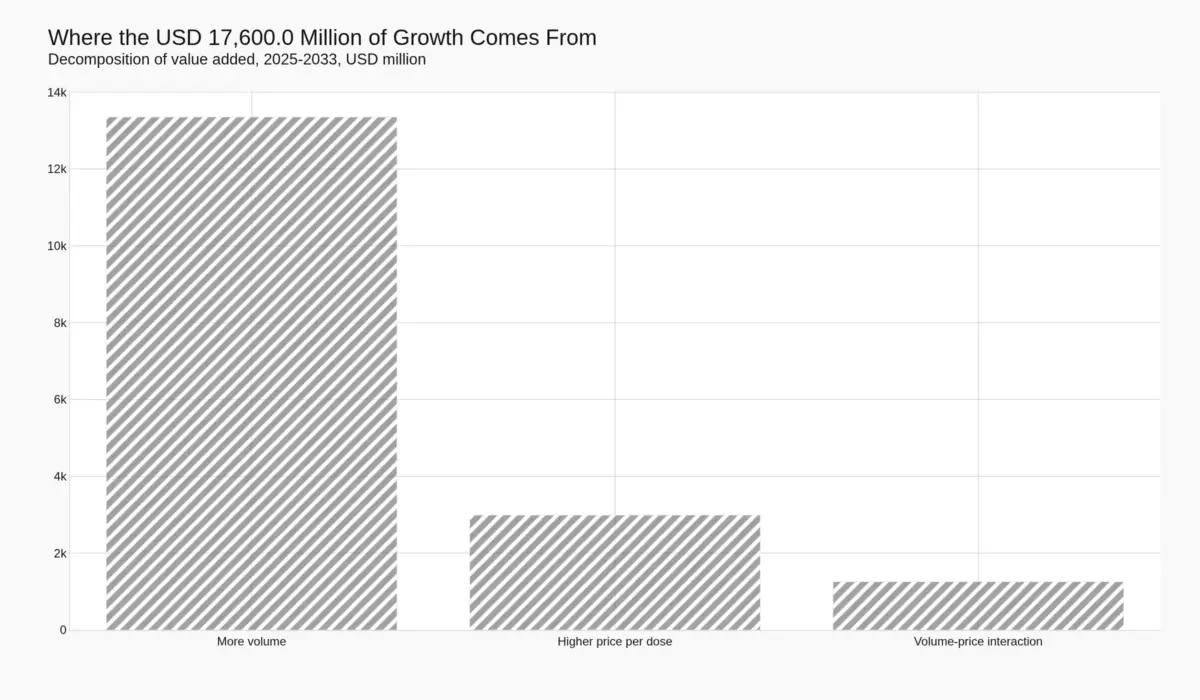
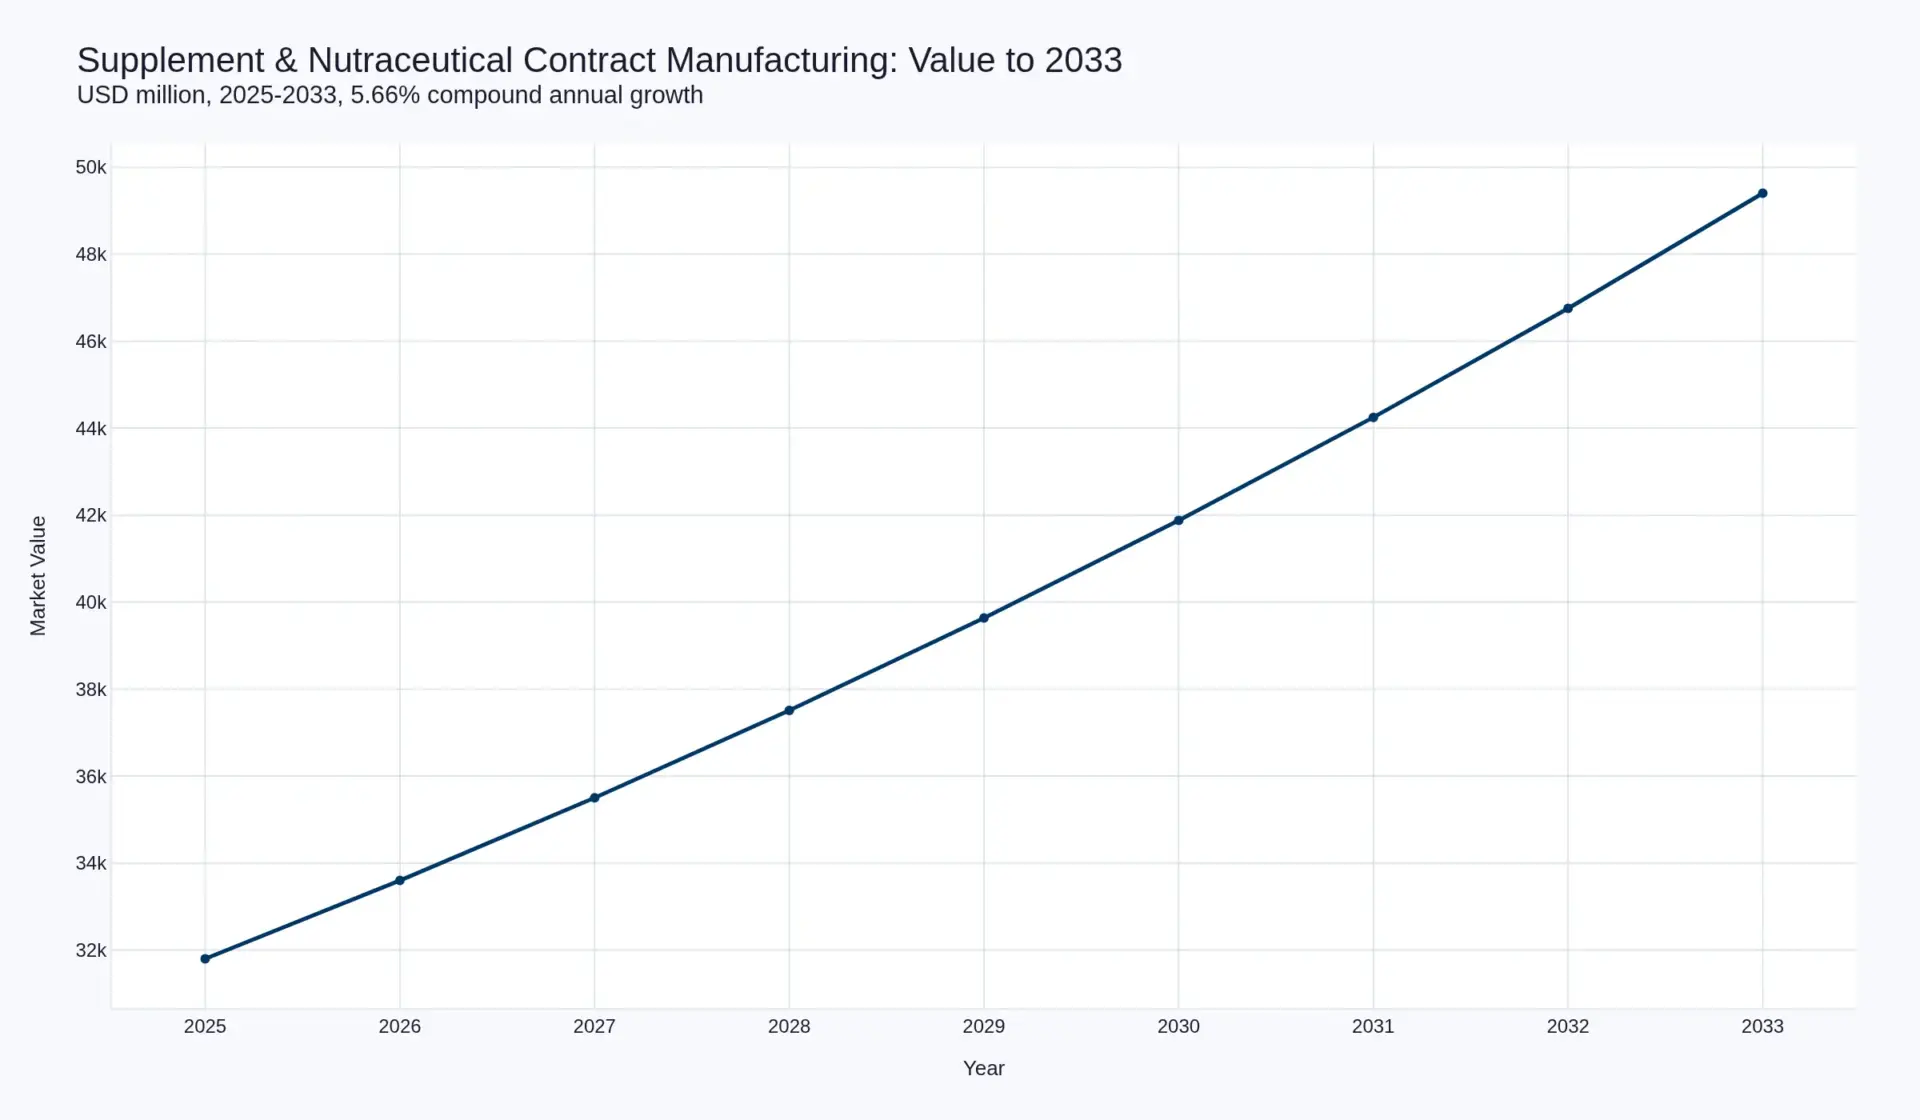
The contract manufacturing layer of the global supplement industry is valued at USD 31,800.0 million in 2025 and forecast at USD 49,400.0 million by 2033, a compound annual growth rate of 5.66 per cent. Finished dose volume rises from 412.0 billion to 585.0 billion units at 4.48 per cent, and realised revenue per thousand doses from USD 77.18 to USD 84.44 at 1.13 per cent. Of the USD 17,600.0 million added, 75.9 per cent is more volume, 17.0 per cent is a higher price and 7.1 per cent is interaction.
The finding is the gap to the customer. Pheonix Research models branded dietary supplement retail at USD 189.4 billion in 2025 reaching USD 342.7 billion in 2033 at 7.7 per cent. The manufacturing layer is therefore 16.79 per cent of the consumer dollar in 2025 and 14.41 per cent in 2033. It grows, and loses share of the value chain while doing so.
The cause is regulatory rather than commercial. Under 21 CFR 101.93 the statement on a supplement label is notified by "the manufacturer, packer, or distributor" and must name the brand; the notifying firm self-certifies its substantiation and no agency reviews it. Under Directive 2002/46/EC the EU harmonised the permitted vitamins, minerals and sources in 2002 and has never set maximum or minimum amounts, the Commission recording that no proposal has been presented because of divergent views. The manufacturer carries the cost of proof and owns neither the claim nor the dose, so the claim — and the retail premium attached to it — moves to another supplier with the artwork.
What the manufacturer does own is testing, and it is statistical by permission: 21 CFR 111.75(c) requires finished-batch verification for "a subset" identified through a sound statistical sampling plan. Identity testing of every incoming dietary ingredient lot under 111.75(a)(1)(i) is the irreducible cost, and it scales with SKUs rather than output.
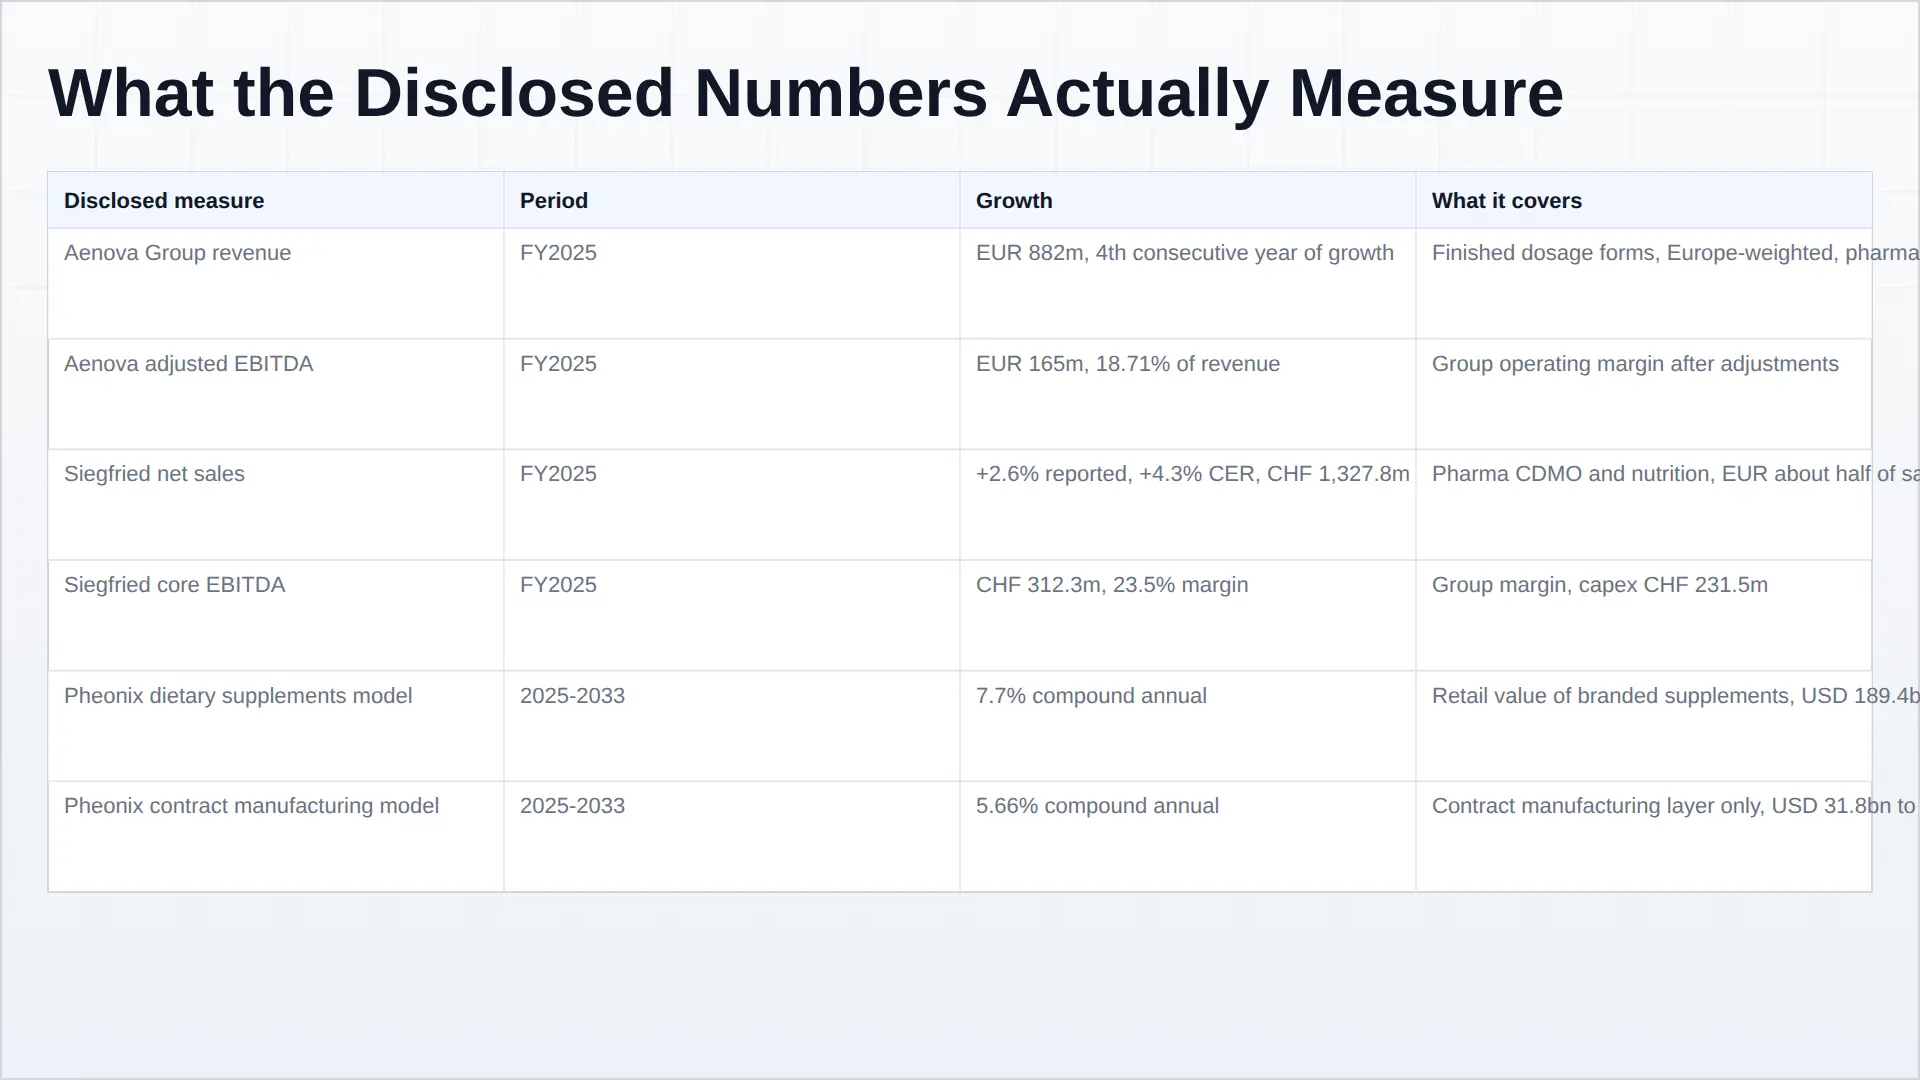
Disclosed anchors corroborate the shape of the market. Aenova Group reported EUR 882 million of revenue in 2025 with adjusted EBITDA of EUR 165 million, 18.71 per cent, its fourth consecutive year of growth. Siegfried Holding reported net sales of CHF 1,327.8 million, up 2.6 per cent and 4.3 per cent at constant currencies, with a 23.5 per cent core EBITDA margin.
The manufacturing layer grows slower than the market it serves, and that is the whole report
The global market for contract development and manufacturing of dietary supplements and nutraceuticals is valued at USD 31,800.0 million in 2025 and forecast to reach USD 49,400.0 million by 2033, a compound annual growth rate of 5.66 per cent. That single number is unremarkable until it is set beside the market it serves. Pheonix Research's own model of the branded supplements market puts retail value at USD 189.4 billion in 2025 rising to USD 342.7 billion in 2033 at 7.7 per cent. Divide one by the other and the contract manufacturing layer is 16.79 per cent of the consumer dollar in 2025 and 14.41 per cent in 2033.
An outsourcing market that grows two points slower than its customers is losing share of the value chain. That is what this report explains, and the explanation is not a story about capacity, steel or consolidation. It is a story about three regulatory facts that together decide who is allowed to price.
What the numbers look like
Finished dose volume rises from 412.0 billion units in 2025 to 585.0 billion in 2033, a compound rate of 4.48 per cent. Revenue per thousand doses rises from USD 77.18 to USD 84.44, a compound rate of 1.13 per cent — roughly a third of general inflation over the same window, so the realised price of a manufactured dose is falling in real terms. Of the USD 17,600.0 million of value added across the forecast:
- USD 13,352.1 million (75.9 per cent) is more volume
- USD 2,991.1 million (17.0 per cent) is a higher price per dose
- USD 1,256.0 million (7.1 per cent) is the volume-price interaction
Three quarters of the growth is the manufacturer being given more work. Less than a fifth is the manufacturer charging more for it. In a market where the customer's own retail price is rising at 7.7 per cent, that is the arithmetic of a supplier without pricing power.
Why: the claim is not the manufacturer's to own
In the United States a dietary supplement reaches market without pre-market approval. What it carries instead is a statement, and the rule governing that statement is explicit about who carries it. Under 21 CFR 101.93(a)(1), no later than 30 days after first marketing, "the manufacturer, packer, or distributor" must notify the FDA that the statement has been included, and the notification must name "the dietary supplement (including brand name)". The notifying firm certifies that it "has substantiation that the statement is truthful and not misleading". There is no agency review of the substance. There is a filing, a brand name and a signature.
A contract manufacturer can be the notifier. It almost never is, because the brand name on the label belongs to someone else. The asset that carries the retail premium — the claim — sits with the customer, and it moves to a different supplier with the label artwork. Nothing in the plant has to be re-registered for that to happen.
Europe splits the same outcome across two instruments. Directive 2002/46/EC harmonises which vitamins and minerals, and which of their sources, may be used: Annex I lists the nutrients, Annex II the permitted substances, and the Commission records that trade in vitamins and minerals not listed in Annex II "has been prohibited from the 1st of August 2005". That is a genuine gate, and it is why a formulator's source list is not a free choice. But the same Directive leaves the quantity untouched. On maximum and minimum amounts the Commission's own position is that although it has "consulted extensively with EU countries and interested stakeholders on the issue, no proposal has yet been presented due to the complex nature of the issue and the divergent views that were expressed." Twenty-four years after harmonisation, the dose — the thing a contract manufacturer is actually paid to hit — has never been harmonised. Monitoring notification is a Member State option under Article 10, and it attaches to the product placed on the market, not to the site that made it.
So in the two largest Western markets the manufacturer carries the cost of proof and owns neither the claim nor the dose. It competes on validated capacity, release testing and delivery reliability. That is a real business — the disclosed margins in this report run from 18.71 per cent at Aenova to 23.5 per cent core EBITDA at Siegfried — but it is a service business priced against a cost base, not a rights business priced against a moat.
The cost of proof is real, and it is statistical by permission
What the manufacturer does own is the testing obligation, and it is heavier than most buyers assume and lighter than most regulators would like. Under 21 CFR 111.75(a)(1)(i) a manufacturer must "conduct at least one appropriate test or examination to verify the identity of any component that is a dietary ingredient" before use — every incoming lot, with the exemption route itself benchmarked against "100 percent identity testing". Other components may be accepted on a supplier certificate of analysis, but only after the supplier is qualified and the certificate "periodically re-confirm[ed]". Identity testing therefore scales with the number of ingredient lots and SKUs, not with output. That is the arithmetic behind minimum order quantities and behind the small brand's cost disadvantage.
Finished-product verification is a different matter. 21 CFR 111.75(c) requires verification for "a subset of finished dietary supplement batches that you identify through a sound statistical sampling plan (or for every finished batch)", and 111.75(d) allows a product specification to be exempted where "there is no scientifically valid method for testing or examining such exempted product specification at the finished batch stage". The rule is written to be workable in a low-margin industry. It also means that the assurance a consumer reads off a label is, by design, not built on every batch being tested.
The rest of the growth, and the honest limits of this model
Where the layer does earn more per dose, it is in the dose form. Softgels and gummies carry formulation and stability difficulty that tablets and powders do not, and difficulty is the only thing here that behaves like a barrier. The technology chapter works through what each line can and cannot do, and why the gummy boom is a share shift inside supplements rather than a faster-growing market.
The value base is a construct. It is built from disclosed contract manufacturers' revenue — Aenova at EUR 882 million in 2025, Siegfried at CHF 1,327.8 million — plus a coverage ratio for the private and Asian capacity that does not disclose, and it is expressed as 16.79 per cent of the branded retail market rather than as an independent survey. The plausible band is USD 27.5–36.5 billion around USD 31,800.0 million. The model carries no geography, so this report publishes no regional split. It carries no vendor-level share data, so it publishes no market-share table beyond the disclosed anchors. Both refusals are stated rather than estimated, and every sensitivity is published: hold the realised price at USD 77.18 and 2033 is USD 45,150.3 million at 4.48 per cent; hold the dose count at 412.0 billion and 2033 is USD 34,789.3 million at 1.13 per cent.
Section guide
Use the contents list below to move through the report. The competitive landscape chapter examines ten manufacturers and the three disclosed anchors that can be checked against the model. The value chain chapter is about the cost of proof. The regulatory chapter is the spine. The technology chapter is about dose forms. The investment chapter explains why capital is leaving the dose and moving to the molecule. The risk chapter sets out the exposure that matters, including the one this model cannot hedge.
Table of Contents
- The manufacturing layer grows slower than the market it serves
- Value, dose volume and realised price, 2025–2033
- Decomposition of the USD 17,600.0 million of added value
- Why the claim is not the manufacturer’s to own
- The permitted-substance gate and the absent dose limit in Europe
- The cost of proof and the statistical sampling allowance
- Value base, sensitivities and stated refusals
- Structure of the contract manufacturing field
- Ten manufacturers and the three disclosed anchors
- Margins, service reliability and what is actually being sold
- The manufacturing value chain and where cost enters
- Dosage-form economics: tablet, capsule, softgel, gummy, powder
- Two regimes, one absence: the regulatory spine
- Technology, changeover cost and the gummy question
- Investment activity: why capital is leaving the dose
- Market risk and the exposure this model cannot hedge
Competitive Landscape
A fragmented field with a consolidated top
Ten manufacturers define the competitive perimeter of this report, and they are not the same kind of company. Four are diversified groups for whom supplement dose manufacture is one application of a much larger asset base: Catalent Pharma Solutions, Thermo Fisher Scientific, Lonza Group and dsm-firmenich. Two are European finished-dose specialists that disclose enough to be checked against a model: Aenova Group and Siegfried Holding AG. One is a French family-controlled consolidator, Fareva. Three are increasingly ingredient-led businesses that manufacture as an extension of what they sell: Glanbia, Kerry Group and dsm-firmenich. And one is the Chinese pure-play that has become the reference point on cost and on gummy capability: Sirio Pharma.
We classify the structure as fragmented, with a high intensity of competition, and we place four firms in a first tier. That is a judgement about capability breadth rather than about volume, because the honest answer to “who is the largest supplement CDMO” is that no one can say. Not one of these companies discloses a line that maps onto this market’s perimeter. That is why this report publishes no market-share table, and why the tier count should be read as structure rather than as rank.
The three disclosed anchors
Aenova Group is the cleanest read available on European finished-dose contract manufacturing. Its 2025 annual report states that revenues “increased to €882 million, while adjusted EBITDA rose to €165 million”, described as the “highest earnings in the company’s history” and the fourth consecutive year of revenue growth. That is an 18.71 per cent adjusted EBITDA margin, earned in a business the company itself describes as transforming into “Europe’s Go-to CDMO for finished dosage forms”. Two operating metrics in the same letter matter more than the margin. On-time delivery “increased significantly, with many sites now performing at or above 90%”, and Aenova recorded a customer Net Promoter Score of +30, which it describes as clearly above the industry benchmark. When a manufacturer advertises service reliability and a survey score rather than price, it is telling you what it competes on.
Siegfried Holding provides the second anchor and the more instructive one. Net sales reached CHF 1,327.8 million in 2025, up 2.6 per cent in Swiss francs and 4.3 per cent at constant exchange rates, with core gross profit margin of 26.7 per cent, core EBITDA of CHF 312.3 million (23.5 per cent) and core EBIT of CHF 217.5 million (16.4 per cent). Capital expenditure on property, plant, equipment and intangibles rose to CHF 231.5 million, up 28.0 per cent, against free cash flow of negative CHF 3.1 million. The company employs 3,891 full-time equivalents, essentially flat on the prior year, and notes that the euro accounts for approximately 50 per cent of net sales. Read together those four numbers describe a business growing revenue by four points at constant currency, adding capital at three times that rate, and holding headcount flat. That is a manufacturer buying capability rather than adding labour — and it is the pattern the investment chapter returns to.
Sirio Pharma is the third, and it is the one that shows the risks of the model rather than its strengths. Its 2025 annual report discloses a goodwill balance of RMB 427.11 million, equal to 14.49 per cent of equity attributable to shareholders, built from two acquisitions: Sirio Germany in December 2016 and a controlling interest in Best Formulations of the United States in January 2023. In the same year it impaired RMB 194.96 million against inventory, long-term deferred expenses, fixed assets, right-of-use assets and intangibles in its personal care business, and announced the disposal of that business to concentrate on nutritional health food solutions. A manufacturer that buys its way into three continents carries a goodwill asset that has to be defended by growth in the underlying operations, and the personal care exit is what happens when a diversification does not produce synergy.
What the ten actually compete on
Three competitive variables separate these firms, and none of them is price per tablet. The first is regulatory geography: a manufacturer with sites inside the United States, the European Union and China can serve a brand that wants local supply for tariff and lead-time reasons, and Sirio has built precisely that footprint. The second is dose-form depth: the ability to run softgel, gummy, two-piece capsule and tablet under one quality system is a genuine differentiator, and it is why the diversified groups keep supplement manufacturing at all. The third, and the least visible, is release testing capacity — the in-house laboratory that can perform identity, assay, dissolution and microbiological testing without sending samples out. A manufacturer with the laboratory captures the release margin and controls its own lead time. One without it buys both.
The absence of a disclosed supplement line across all ten is itself a finding. It means the market cannot be ranked by revenue, only by capability, and it means a brand choosing a partner is choosing on audit, reference and responsiveness rather than on a published league table. In a market growing at 5.66 per cent with 75.9 per cent of that growth coming from volume, the firms that win will be the ones that can absorb more volume without adding proportionate cost — which is a statement about line utilisation and testing throughput, not about sales reach.
The competitive risk sits at the small end. Below the ten names sits a long tail of regional manufacturers, many of them competent, some of them not, all of them cheaper. Their existence caps what the top tier can charge a small brand, and it is why the minimum order quantity is the industry’s real entry barrier: the top tier prices small volumes out of its own factory, and the tail takes them.
Value Chain
The chain, and the two places it costs money
A finished supplement reaches a shelf through six steps, and only one of them is contested. Ingredients are sourced and identified. A formulation is fixed, usually with the customer’s brand and the manufacturer’s process knowledge. A dose form is manufactured. A batch is released against specification. The product is packed and labelled. It is distributed, usually by the customer. Contract manufacturers compete fiercely at steps three and four, compete somewhat at steps one and two, and barely compete at all at steps five and six, which is why the packaging line is increasingly offered as a service rather than sold as a capability.
The first place cost enters is the ingredient, and the reason is a rule rather than a market. Under 21 CFR 111.75(a)(1)(i), before you use a component that is a dietary ingredient you must “conduct at least one appropriate test or examination to verify the identity” of it. The rule contemplates an exemption by petition, and sets the standard for granting one against “100 percent identity testing” — a useful piece of drafting, because it tells you what the agency regards as the default. Other components may be taken on a supplier’s certificate of analysis, but only once the supplier has been qualified and the certificate “periodically re-confirm[ed]”. Every one of those obligations is per lot. None of them scales with output.
The consequence is the single most under-appreciated number in this business: quality control cost per unit falls with volume and rises with the number of ingredient lots a facility handles. A brand with twelve SKUs and forty ingredients generates hundreds of identity tests a year regardless of how many capsules it sells. A brand with two SKUs and six ingredients generates dozens. This is the mechanical origin of the minimum order quantity, and it explains why the small-brand end of the supplement market is served, when it is served at all, by smaller and less validated facilities. The larger CDMOs are structurally reluctant to take that work, not because they dislike small customers but because the testing burden makes the unit economics unattractive at low volumes.
The second place cost enters is changeover. A tablet line running one product for six days is a different business from a line running nine products in a week, and the difference is not labour. It is cleaning validation, line clearance, reconciliation, and the documentation that has to be produced for each campaign regardless of its length. Softgel encapsulation is the least flexible of the mainstream dose forms: the fill has to be formulated, the shell has to be plasticised and dried under controlled temperature and humidity, and the drying tunnel is a bottleneck that does not speed up because the order is urgent. That is why softgel capacity, when it is scarce, is genuinely scarce, and why the dose form with the highest technical barrier is also the one where a manufacturer can occasionally hold a price.
What a thousand doses actually costs
Pheonix models realised revenue of USD 77.18 per thousand doses in 2025, rising to USD 84.44 by 2033. Work backwards from that figure and the shape of the industry becomes legible. A mass-market multivitamin tablet selling at retail for a few cents a dose contains perhaps a cent and a half of actives, a cent of excipients, a fraction of a cent of film coating and packaging, and the remainder is conversion, testing, release and overhead. The manufacturer’s revenue is a thin slice, and the components above it — capsule shells, film coatings, colours, functional excipients — are supplied by a small number of specialists whose pricing the manufacturer does not set.
That upstream position is worth stating plainly, because it constrains what a CDMO can do about its own margin. Capsule shells are a two-supplier world at the high end. Colours, coatings and binders are similarly concentrated. When a manufacturer negotiates with a brand owner, the brand knows what the tablet costs to press. When the same manufacturer negotiates with its excipient supplier, it has considerably less leverage than the brand has over it. The industry’s margins — 18.71 per cent adjusted EBITDA at Aenova in 2025 on EUR 882 million of revenue, 23.5 per cent core EBITDA at Siegfried on CHF 1,327.8 million — are respectable for a service business and thin for a business that carries this much validation cost.
Where the chain leaks, and who captures it
The value that escapes this layer does not vanish; it lands in two places. It lands with the brand, which owns the claim and the customer relationship and sets the retail price, and it lands with the ingredient suppliers who sell the differentiated actives — the branded botanical extracts, the patented mineral forms, the clinically studied strains — which are specified by the brand and merely handled by the manufacturer. A CDMO making a probiotic capsule is often making it around an ingredient whose supplier has already taken the margin that the ingredient’s evidence supports.
We treat this as the value chain’s defining asymmetry, and it is why the global dietary supplements market and this market must be read together rather than separately. The two models differ by five points of growth, and the difference is not a forecasting disagreement. It is the same dollars counted at two different points in the same chain, and the upper point is growing faster because that is where the claim is.
The dose form, in turn, moves the chain’s centre of gravity more than any other variable. A functional gummy is manufactured by a supplier that has to control water activity, gelatin or pectin set, and the stability of actives in a high-moisture matrix — and it is a product whose retail popularity has grown faster than the manufacturing capacity qualified to make it well. A collagen peptide powder, by contrast, is a blending and sachet-filling operation with a much lower barrier and correspondingly less pricing power for whoever fills it.
Delivery technology is the one place the chain rewards capital. Nanoencapsulation and bioavailability enhancement move an ingredient from commodity to specified, and the manufacturer that can run the encapsulation step owns a process the customer cannot trivially move. It is a narrow door, but it is the only door in this chain that opens onto price.
What this means for a buyer of manufacturing capacity
Three practical conclusions follow. First, the cheapest quote is usually quoting a smaller testing scope, and the way to test that is to ask which components are on certificate of analysis and how often the certificates are re-confirmed — a supplier that cannot answer precisely is answering. Second, the number of ingredient lots is the real driver of unit cost, so reformulating to fewer, multi-functional actives is a genuine lever rather than a marketing exercise. Third, a manufacturer with validation depth in softgel or gummy is worth a premium that a tablet manufacturer is not, because that is where the difficulty sits.
None of this changes the headline. The layer grows at 5.66 per cent while its customers grow at 7.7, and the chain explains why: the manufacturer is paid for conversion, and conversion is the part of the chain with the most substitutes.
Investment Activity
Capital is leaving the dose and going to the molecule
The most useful way to read investment in this market is to follow the capital rather than the press release, because the three European and Asian operators that disclose enough to be checked are all doing versions of the same thing: adding capability that is harder to substitute, and in two cases that means adding capability which is not nutritional at all.
Start with Aenova. Its 2025 annual report describes a strategic shift the company calls Strategy 2028 and lists its platforms as “sterile injectables, high potent and complex solids, large-volume oral solid dose and softgel formulations.” Three of those four are pharmaceutical. The report records as a milestone “the successful technology transfer and commercial start-up of our sterile fill and finish platform in Latina”, describing the position it creates as “a partner of choice for complex injectable therapies”. It also describes an early-stage development programme called Aenovation and the extension of “bioavailability-enhancing technologies, including spray drying and hot melt extrusion.” Revenue reached EUR 882 million with adjusted EBITDA of EUR 165 million — 18.71 per cent — described as the highest earnings in the company’s history, and the fourth consecutive year of revenue growth.
That is a coherent strategy and it is not a supplement strategy. Aenova is using the cash flow of finished-dose contract manufacturing to buy position in dose forms where the customer’s regulatory dossier does name the site. The logic is exactly the logic this report has set out: in supplements the customer can leave with a purchase order, and in sterile injectables the customer cannot leave without a regulatory filing. Capital that chases durability goes where the switching cost is.
Siegfried shows the same pattern in a different form. Net sales of CHF 1,327.8 million grew 2.6 per cent in Swiss francs and 4.3 per cent at constant exchange rates, while investment in property, plant, equipment and intangibles reached CHF 231.5 million, up 28.0 per cent, and free cash flow came in at negative CHF 3.1 million. Headcount was 3,891 full-time equivalents against 3,886 the year before — flat. A company that adds 28 per cent to its capital base while holding labour flat and growing revenue by four points at constant currency is buying capability, not capacity in the ordinary sense. It is a statement about what kind of work it wants to be doing in five years.
The acquisition route, and what it costs on the balance sheet
Sirio Pharma took the other road, and its 2025 annual report is the clearest available evidence of both the appeal and the cost. The company acquired Sirio Germany in December 2016 and a controlling interest in Best Formulations of the United States in January 2023, and the report states that it has “布局中国、欧洲、美国的本土生产基地,并进一步在东南亚布局本土生产基地” — sites in China, Europe and the United States, with a further site being developed in Southeast Asia — explicitly to move from “本地供应+异地出口” (local supply plus export from elsewhere) toward local production serving local demand, in response to tariff protection. That is the correct strategic answer to a tariff regime, and it is only available to a manufacturer that is willing to buy it.
The bill arrives as goodwill. The report discloses a goodwill balance of RMB 427.11 million, or 14.49 per cent of equity attributable to shareholders, arising from both transactions, and flags impairment risk against it. In the same year the company recognised RMB 194.96 million of asset impairment across inventory, long-term deferred expenses, fixed assets, right-of-use assets and intangibles in its personal care business, and announced its intention to dispose of that business in order to concentrate on nutritional health food solutions. A diversification that does not produce synergy is a write-down with a delay, and this one is now being unwound.
What the diversified groups tell us by omission
For the four largest participants — Catalent, Thermo Fisher, Lonza and dsm-firmenich — supplement dose manufacturing is one service inside an asset base measured in billions, and none of them reports it as a segment. We found no disclosed capacity programme from any of the four aimed specifically at supplement dose forms. That is an absence in our evidence rather than a proven fact about their intentions, and we state it that way. But it is consistent with the arithmetic: a market of USD 31,800.0 million growing at 5.66 per cent with 1.13 per cent realised price growth is not where a global group puts marginal capital when it also owns biological and pharmaceutical capacity.
The consequence is that this market’s capacity is being built by specialists and by Asian manufacturers, and that the specialists are steering their own new capacity toward pharmaceutical work. Both directions point the same way. The supplement layer gets the capacity it needs, eventually, from the part of the industry with the least choice about where to deploy.
Deal logic, and the multiple we will not publish
We classify recent M&A activity as present and the investment trend as rising, and the deal logic in this market reduces to three motives. Geography is the first and currently the strongest: tariff exposure and customer pressure for local supply make a site in the customer’s jurisdiction worth more than its output. Dose-form capability is the second: buying a qualified gummy or softgel operation is faster and cheaper than qualifying one, and the qualification is the hard part. Scale in release testing is the third and least discussed: an in-house laboratory is a fixed cost that becomes an advantage as volume rises and a burden when it does not, which makes laboratory-equipped sites the natural consolidation targets.
We do not publish a transaction multiple. No supplement CDMO target in our evidence set discloses revenue for its supplement business separately, and the deal values that are public attach to whole enterprises with pharmaceutical or ingredient revenue included. A multiple computed on those numbers would be precise and wrong. The growth discipline applied throughout this report applies here too: where the data cannot carry the number, the number is not published.
One thing would change the investment case materially and it has not happened yet. If a contract manufacturer became the applicant on a novel food authorisation or the holder of a proprietary health claim with data protection attached, it would own a regulatory asset that does not move with the label artwork. That is the only route by which capital deployed in this layer could earn a return that behaves like the returns available one step up the chain. Nothing in the disclosed record suggests anyone in this market is trying it at scale.
Technology & Innovation
The dose form is the only technical variable that prices
Six dose forms account for almost all of this market: two-piece capsules, tablets, softgels, gummies and chews, powders and sachets, and liquids. They are not equally difficult and they are not equally profitable, and the ranking of difficulty is the closest thing this industry has to a pricing model.
Tablets are the entry level. Direct compression is a blending and pressing operation, roller compaction and wet granulation add capability at a cost, and the process is well understood across hundreds of facilities worldwide. A tablet line is therefore easy to qualify and easy to replace, which is why tablet work is priced against a benchmark rather than a relationship. Two-piece capsules sit slightly above tablets: filling is simple, but shell supply is concentrated and the vegetarian HPMC transition added a qualification step for every product that made it.
Softgels are where the technical barrier becomes commercially meaningful. The fill has to be formulated for compatibility with the shell, the shell has to be plasticised and formed to a precise seam, and the wet gel has to be dried under controlled temperature and humidity for days before it can be packed. Drying capacity is a fixed asset that cannot be expanded by hiring, and a softgel line is not quickly repurposed between products of different fill viscosity. All of that makes softgel the least flexible mainstream dose form and, not coincidentally, the one where an established manufacturer can occasionally hold a price.
Gummies are the newest and the most misunderstood. A gummy is a high-moisture, high-water-activity matrix, and many actives are less stable in it than in a dry dose. Pectin and gelatin systems set differently, and the depositing equipment, the curing rooms and the assay methods all have to be qualified around the specific formulation. A manufacturer that can run a gummy with a sensitive active at a declared potency through shelf life owns something real.
The gummy narrative, checked against the number
The received wisdom is that gummies are the fastest-growing dose form and therefore the strategic prize. The number is more interesting than that. Pheonix Research’s own model of the global functional gummies and jellies market puts it at USD 6.85 billion in 2025 rising to USD 11.23 billion by 2033, a compound rate of about 6.1 per cent. That is slower than the 7.7 per cent at which the total dietary supplement market is modelled.
So the gummy boom is not a faster-growing market. It is a share shift inside supplements, from tablets and capsules toward a form consumers prefer, and the shift is real and visible in the dose mix a contract manufacturer sees. But a share shift inside a market does not create a growth premium at the manufacturing layer; it creates a capability premium for the manufacturers that can make the form, and a stranded-asset problem for the ones that cannot. That distinction matters for anyone valuing capacity, because it means gummy lines are worth what they are worth only while the shift continues, and the shift is bounded by the size of the category it is taking share from.
What innovation in this layer actually looks like
Patent activity in supplement contract manufacturing is low, and the reason is structural rather than a lack of effort. A tableting or encapsulation process is difficult to protect because the equipment is bought rather than invented and the methods are published in pharmacopoeial and industry compendia. The patents in this chain sit upstream, with ingredient suppliers protecting a form or a strain, and downstream, with brand owners protecting a formulation or a delivery claim. The manufacturer sits between two patent estates and owns neither.
What innovation the manufacturer does control is process innovation with a commercial payoff that is easy to miss: yield, throughput, changeover time, and the ability to run a difficult formulation at commercial scale without rework. Aenova’s 2025 annual report describes exactly this, framing its strategic platforms around “sterile injectables, high potent and complex solids, large-volume oral solid dose and softgel formulations” and citing the extension of bioavailability-enhancing technologies including “spray drying and hot melt extrusion”. Note what that list is: it is a portfolio migrating toward difficulty, and most of that difficulty is pharmaceutical rather than nutritional.
The one genuinely transformative technical direction inside supplements is delivery science. Nanoencapsulation and bioavailability enhancement change what an ingredient is rather than how it is filled, and a manufacturer that can run the encapsulation step holds a process the customer cannot move without reformulating. It is the only place in this value chain where a manufacturing capability behaves like an asset rather than a cost centre. It is also, for that reason, the place where contract manufacturers and ingredient suppliers compete most directly, and the ingredient suppliers are winning.
Technology maturity and the practical answer
We classify technology maturity in this market as mature, innovation intensity as moderate and patent activity as low. That combination is not a criticism of the operators; it describes a layer whose process is regulated into stability. The cGMP regime rewards consistency over novelty, inspection history is the asset that matters, and a plant that changes its process carries validation risk for no pricing reward. The incentive structure is therefore to be excellent at the known process and to add capability by acquisition or by building a new suite, which is precisely the pattern the investment chapter documents.
The practical answer for a buyer is that dose-form depth is the only technical variable worth paying for, and that within dose-form depth the sub-variable that matters is the ability to handle difficult actives — sensitive to moisture, sensitive to heat, low dose requiring content uniformity, or poorly bioavailable. A manufacturer that can do those four things is not interchangeable. A manufacturer that can do tablets and capsules at scale is.
Market Risk
The risk that matters is structural, not cyclical
Six exposures attach to this market and they are not of equal weight. The first is the one the report has already established and the rest are secondary to it.
Share-of-retail compression. The manufacturing layer is 16.79 per cent of the consumer dollar in 2025 and 14.41 per cent in 2033 on Pheonix’s model — a loss of 2.4 percentage points while growing at 5.66 per cent. This is not a forecast of decline; it is a forecast of relative erosion, and its mechanism is that the brand layer is repricing faster than the manufacturing layer can. The exposure for anyone lending to, buying or building capacity in this sector is that a business can grow its revenue while its strategic position weakens, and the accounts will not show it.
Price. Realised revenue per thousand doses rises from USD 77.18 to USD 84.44, a compound rate of 1.13 per cent. If general inflation runs above that — as it has across the forecast window’s opening years — the manufacturer is absorbing a real price cut every year and must recover it through yield and throughput. The sensitivity is published rather than buried: hold the realised price at USD 77.18 and the 2033 market is USD 45,150.3 million at 4.48 per cent; hold the dose count at 412.0 billion and it is USD 34,789.3 million at 1.13 per cent. The first number is the price risk case and the second is the volume risk case, and the fact that the price risk case costs more says everything about where the leverage sits.
Quality and inspection exposure
The testing regime discussed in the value chain and regulatory chapters creates an asymmetric risk that deserves its own heading. Because finished-batch verification may be performed on “a subset” of batches under 21 CFR 111.75(c), and because identity testing is per lot rather than per unit of output, the assurance in this system is statistical by design. That is a reasonable way to regulate a low-margin industry and it concentrates risk: a single serious failure — an undeclared allergen, a potency failure, an adulterated botanical — becomes a facility event, then a customer event, and then a category event. The manufacturer’s insurance does not cover the second and third of those.
The reputational half-life of a quality failure is longer than the financial one. Supplement brands source from multiple manufacturers precisely to limit it, which is rational for the brand and corrosive for the manufacturer: dual-sourcing is exactly the behaviour that prevents a manufacturer from ever earning a relationship premium. The testing regime and the sourcing behaviour reinforce each other.
Ingredient, geography and currency
Ingredient adulteration is the most under-priced input risk in this report. The manufacturer’s identity test is the last control before a dose is made, and the evidence assembled in Pheonix Research’s food authenticity analysis shows that the party with an interest in defeating that control can be a supplier rather than a competitor. Botanical ingredients carry the highest exposure because their value is defined by species and origin, and the ashwagandha and adaptogen categories are the volume end of that trade.
Geography and tariffs have moved from a procurement question to a capital question. Sirio Pharma’s disclosed rationale for building in China, Europe, the United States and Southeast Asia is explicitly the avoidance of tariff protection, and the cost of that answer is a goodwill balance equal to 14.49 per cent of equity. Manufacturers that cannot afford the answer serve their home market and export at a disadvantage.
Currency is a live exposure for the European operators. Siegfried reports that the euro accounts for approximately 50 per cent of net sales, which means a franc-reporting business earning half its revenue in a second currency carries a translation exposure it does not control and cannot hedge indefinitely. Aenova’s European weighting carries the mirror image for a euro-reporting business selling into dollar-denominated markets.
Concentration, insourcing and the capacity cycle
Customer concentration is a structural feature rather than an accident. The top tier of this market serves a relatively small number of large brands plus a long tail, and the large brands have the negotiating power to compress margin while the tail generates the testing burden that makes margin hard to earn. The growth of private label and of marketplace-own brands has increased the number of customers without increasing their individual value, which raises the cost to serve.
Insourcing is the substitution risk with the highest consequence and the lowest probability. A brand large enough to justify its own plant will build one, and the manufacturing layer would lose that volume permanently. What prevents it is the capital intensity and the regulatory burden relative to a contract price of a few cents a dose — Modest, not large. For that reason we classify substitution risk as moderate rather than high.
The capacity cycle in gummies and softgels is the classic exposure of a fragmented manufacturing market: a fast-growing dose form attracts capacity, capacity arrives in tranches because a line is a lumpy investment, and the arrival of two or three new suites at once converts a capability premium into a price war. The trigger to watch is not demand, which is measurable, but announced capacity, which is not.
What we cannot see, and what that means
Two limits on this risk assessment should be stated rather than implied. The model carries no geography, so this report publishes no regional split and cannot quantify tariff exposure by region; the qualitative discussion above is a judgement, not a modelled output. The model also carries no vendor-level share data, because none of the ten manufacturers discloses a supplement-specific revenue line, so no market-share table is published and no concentration index is computed.
We classify overall market risk as moderate, geopolitical exposure as moderate and substitution risk as moderate, against high regulatory complexity and high supply-chain complexity. The asymmetry that justifies the moderate overall rating is that this is a business with contractual revenue, real assets and a mandatory compliance service at its core. The asymmetry that argues against a lower rating is that the layer does not control the price of what it makes, and no amount of operational excellence changes that.
Regulatory Landscape
Two regimes, one absence, and the price structure that follows
The regulatory architecture of this market is unusual among regulated products in that it places the manufacturer under a detailed process obligation while leaving the meaning of the product to someone else. That division is the origin of everything this report argues about pricing, so it is worth setting out precisely.
The United States: process without approval
A dietary supplement is not approved before it is sold. It is manufactured under a current good manufacturing practice regime, 21 CFR Part 111, and it carries statements whose governance is set out in 21 CFR 101.93. Those two instruments do different jobs. Part 111 tells a manufacturer how to make the product and how to prove it was made. Section 101.93 tells the market who answers for what the label says.
On the second, the text is unambiguous about the notifying party and about what the notification contains. Under 101.93(a)(1) the notice is due no later than 30 days after first marketing, by “the manufacturer, packer, or distributor”. Under (a)(2) it must contain the name and address of that party, the text of the statement, the dietary ingredient or supplement that is its subject, and “the name of the dietary supplement (including brand name)”. Under (a)(3) it must be signed by a responsible individual who certifies that the information is complete and accurate and that “the notifying firm has substantiation that the statement is truthful and not misleading.”
Nothing in that sequence involves an assessment of the claim. The agency receives a filing; the firm self-certifies. This is the legislative bargain of the 1994 Act and it is not a criticism to describe it. What matters for this report is its commercial consequence: the entity that owns the claim is the entity that signs for it, and the signing entity must be able to name the brand. A contract manufacturer can sign. A contract manufacturer rarely does, because the brand is not its own. So the manufacturer’s regulatory identity is entirely procedural — it is the party that must demonstrate the process — while the party that owns the retail premium is the party that owns a sentence.
The process obligation, by contrast, is demanding and personal to the plant. Under 21 CFR 111.75(a)(1)(i) the manufacturer must verify the identity of any component that is a dietary ingredient before use; under (a)(2)(ii) other components may rely on a supplier certificate only after supplier qualification and periodic re-confirmation of that certificate; under (c) finished-batch verification may be performed on “a subset” selected through a sound statistical sampling plan; and under (d) a product specification may be exempted where no scientifically valid finished-batch method exists. Enforcement is by inspection rather than by dossier, and an inspection finding attaches to the facility, its customers and its reputation simultaneously.
Europe: a positive list, and a limit that was never set
The European instrument, Directive 2002/46/EC, does the opposite of what most people assume. It harmonises the inputs and leaves the quantity alone. Annex I sets out the vitamins and minerals that may be used for nutritional purposes in food supplements; Annex II sets out the permitted sources from which those vitamins and minerals may be manufactured; and the Commission records that trade in products containing vitamins and minerals “not listed in Annex II has been prohibited from the 1st of August 2005”. That is a hard gate, and it is why formulators work from a fixed menu rather than a free one.
It is also a gate that moves slowly and only by amendment. The Commission’s own page lists the instruments that have added substances to Annex II: Commission Directive 2006/37/EC, Commission Regulation (EC) No 1170/2009, No 1161/2011, No 119/2014, Regulation (EU) 2015/414 and Regulation (EU) 2017/1203. Six amendments in two decades is the cadence of permitted innovation at the ingredient level, and it is the reason a novel mineral form is a regulatory project before it is a commercial one.
The dose is a different story. Directive 2002/46/EC contemplates maximum and minimum amounts of vitamins and minerals being set through the Standing Committee on Plants, Animals, Food and Feed. Twenty-four years after adoption they have not been set, and the Commission says why in its own words: it has “consulted extensively with EU countries and interested stakeholders on the issue,” but “no proposal has yet been presented due to the complex nature of the issue and the divergent views that were expressed.” A discussion paper was issued; responses were collected; the file has not closed.
For a manufacturer, the practical result is proliferation. The same product, sold into several member states, sits under different national ceilings and different national notification expectations, and national monitoring notification is a Member State option under Article 10 that attaches to the product placed on the market rather than to the facility that made it. One brand becomes several SKUs; several SKUs become several ingredient lots; several lots become several hundred identity tests. The absence of a harmonised dose is therefore not an abstraction — it is a cost line in a plant, and it lands on the party that has to run the extra campaigns.
What the two regimes have in common
Both make the manufacturer responsible for process and the brand responsible for meaning. Neither requires a site to be named in a product authorisation before the product can be sold, which is the crucial difference from pharmaceuticals and the reason the switching cost here is administrative rather than regulatory. In a pharmaceutical CDMO relationship, changing site is a regulatory event. In a supplement relationship, it is a purchase order.
This has an implication that cuts against the industry’s own marketing. Manufacturers describe their facilities as the barrier to entry, and they are — for a new entrant. But they are not a barrier to a customer leaving, because the customer’s regulatory asset does not live in the building. That asymmetry is why the realised price per thousand doses rises at 1.13 per cent while the retail price of the finished product rises at 7.7.
Where the regulatory risk actually sits
Three exposures matter and they are not equally likely. The first is adulteration at ingredient level, the subject of Pheonix Research’s food authenticity and adulteration testing analysis, where the offender is often a supplier rather than a brand and where the manufacturer’s identity test is the last control before the dose is made. The second is claim substantiation, where the liability sits with the brand but the discovery process runs through the manufacturer’s records. The third is a permitted-substance or dose change in a major market, which would re-specify products across the industry at once and force reformulation campaigns that are paid for by customers but scheduled by manufacturers.
The regulatory chapter’s conclusion is therefore uncomfortable for the sector’s growth story. Regulation here does two things at once: it guarantees demand for validated manufacturing, because somebody has to do the testing, and it caps what that manufacturing can earn, because it declines to give the manufacturer anything to own. The compliance burden is real, mandatory and permanent. The moat it creates is not.
Frequently Asked Questions
What is the size of the global supplement and nutraceutical contract manufacturing market?
Pheonix Research values the market at USD 31,800.0 million in 2025, reaching USD 49,400.0 million by 2033 at a compound annual growth rate of 5.66 per cent. That covers contract development and manufacturing of finished dietary supplement dose forms — tablets, two-piece capsules, softgels, gummies, powders and sachets — plus associated formulation and packaging services. It excludes in-house manufacturing by brand owners and excludes pharmaceutical CDMO revenue. The value base is a construct with a stated band of USD 27.5–36.5 billion, built from disclosed manufacturers' revenue plus a coverage ratio for non-disclosing capacity.
Why does contract manufacturing grow more slowly than the supplement market itself?
Because the manufacturer does not own the two things that carry the retail premium. Under 21 CFR 101.93 the label statement is notified by the manufacturer, packer or distributor and must name the brand, with the notifying firm self-certifying its substantiation; under Directive 2002/46/EC the EU harmonised permitted vitamins, minerals and sources but has never set maximum or minimum amounts. The claim and the dose belong to the customer. Pheonix models branded retail at 7.7 per cent compound growth to 2033 against 5.66 per cent for the manufacturing layer, so the outsourced share of the consumer dollar falls from 16.79 per cent to 14.41 per cent.
What share of growth comes from price rather than volume?
Seventeen per cent. Of the USD 17,600.0 million added between 2025 and 2033, USD 13,352.1 million (75.9 per cent) is more dose volume, USD 2,991.1 million (17.0 per cent) is a higher realised price per thousand doses and USD 1,256.0 million (7.1 per cent) is the interaction of the two. Realised price rises from USD 77.18 to USD 84.44 per thousand doses, a compound rate of 1.13 per cent, which is a decline in real terms.
Is every batch of a dietary supplement tested before release?
Not necessarily, and the rule says so. 21 CFR 111.75(c) requires finished-batch verification for "a subset of finished dietary supplement batches that you identify through a sound statistical sampling plan (or for every finished batch)", and 111.75(d) permits a product specification to be exempted where no scientifically valid finished-batch test exists. What is not dispensable is identity testing: 111.75(a)(1)(i) requires at least one appropriate test to verify the identity of any component that is a dietary ingredient before use, with the exemption petition itself benchmarked against 100 per cent identity testing.