
Global Food Traceability & Recall Management Market Report, Size, Share and Forecast 2026–2033: USD 9.85 Billion to USD 19.42 Billion at 8.86 Per Cent — the Regulator Priced Its Own Rule at USD 726 a Site and the Market Sells Everything Else
The global food traceability and recall management market is USD 9,850.0 million in 2025 and USD 19,420.0 million in 2033, a compound growth rate of 8.86 per cent. Volume rises from 3,420.0 million traceable consignments to 6,150.0 million at 7.61 per cent; realised spend per consignment rises from USD 2.8801 to USD 3.1577, or 1.16 per cent a year. Of the USD 9,570.0 million added over the window, USD 7,862.7 million (82.2 per cent) is more consignments recorded, USD 949.4 million (9.9 per cent) is a dearer record and USD 757.8 million (7.9 per cent) is the interaction of the two.
The reason growth is volume-led and price-starved is that nothing in this market can be certified. The US Food Traceability Rule requires records containing Key Data Elements at seven named Critical Tracking Events and their production to FDA within 24 hours; it does not approve, licence or list a single technology. GS1's own mapping guidance for the rule states that the standard it maps to is voluntary. A buyer therefore cannot purchase compliance, only speed — and speed is capped by where the record is created, which is usually a scanner, a printer or a label applied by the party closest to the physical event.
The number that frames the whole report is the regulator's own. FDA's Preliminary Regulatory Impact Analysis for the rule covers approximately 422,144 firms operating 566,448 establishments and puts annualised compliance cost at a primary estimate of USD 411 million a year, on a range running from USD 34 million to USD 2.4 billion. That is USD 725.57 per covered establishment per year and 4.17 per cent of the global spend modelled here. The market is roughly twenty-four times the cost of the obligation most often credited with creating it.
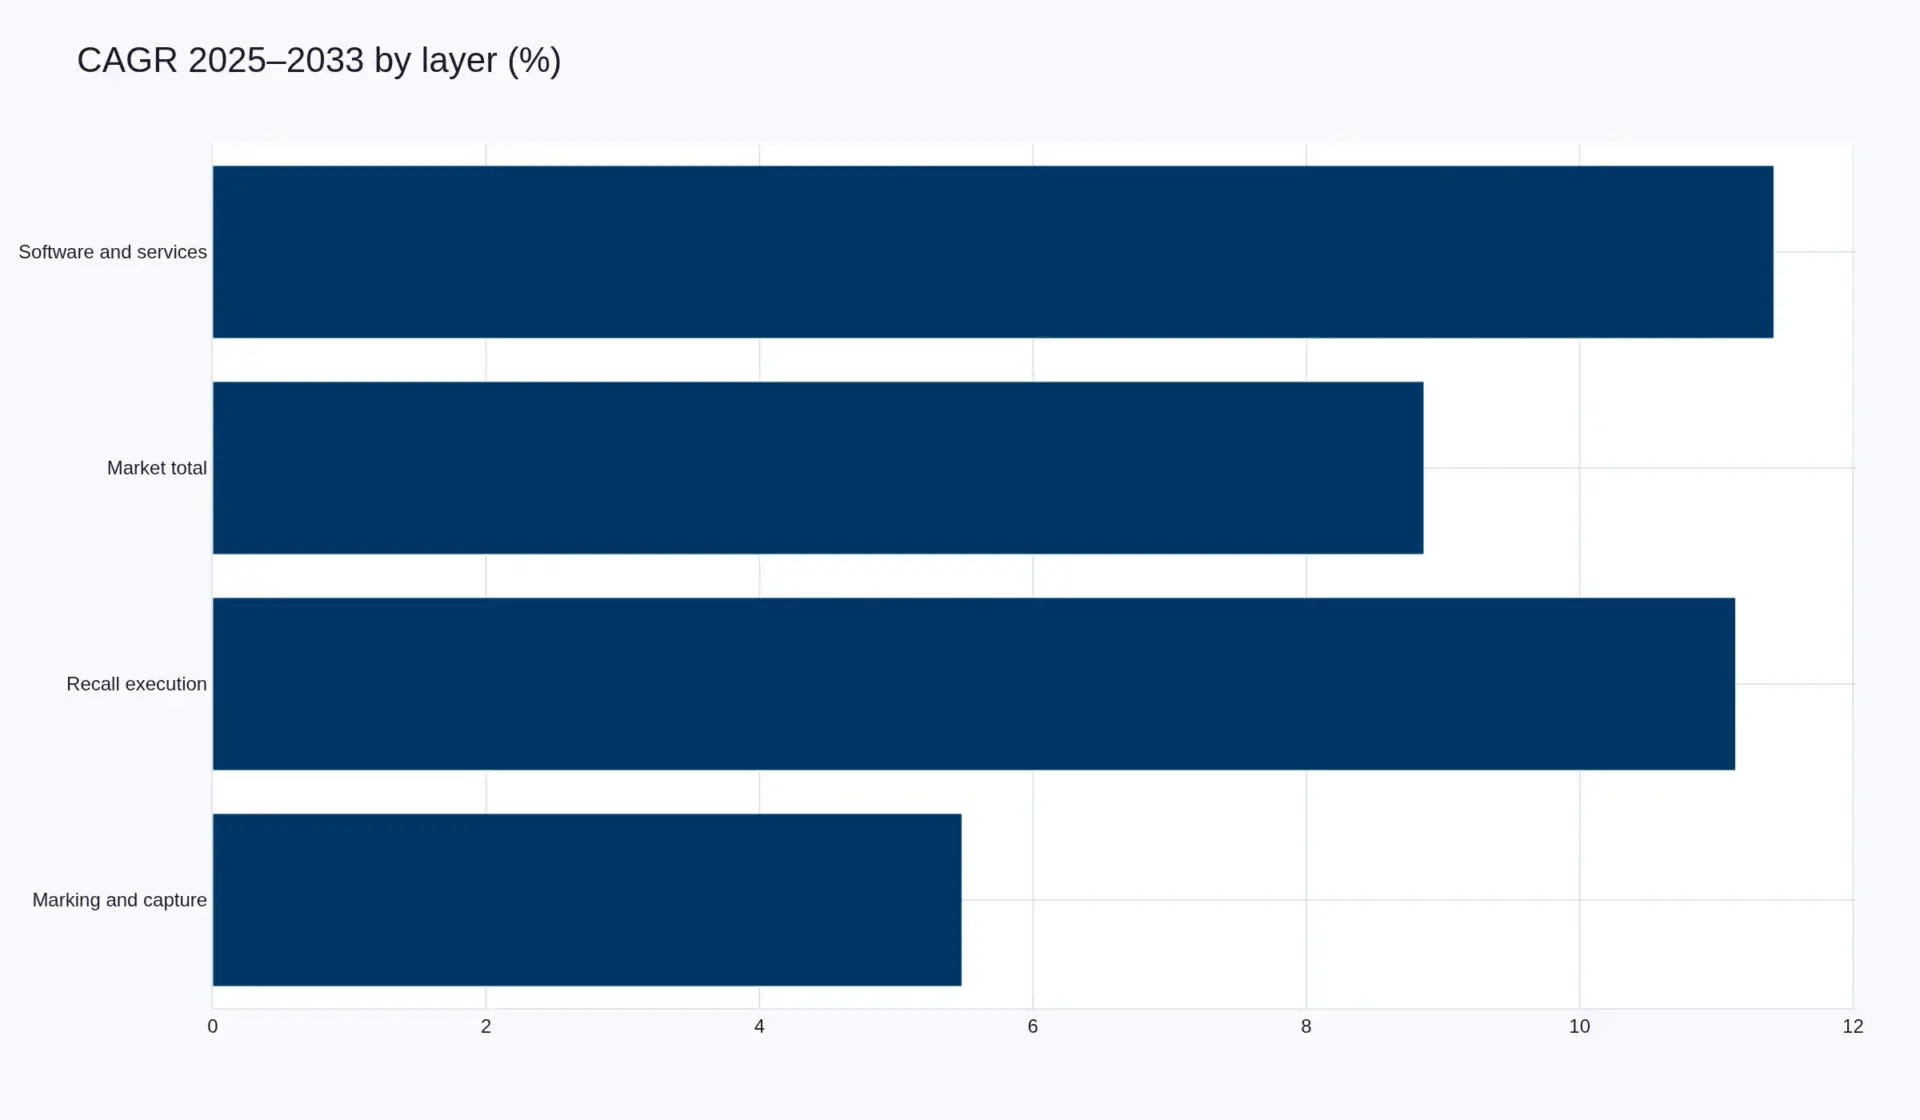
The three layers move differently. Marking, capture and labelling is USD 4,600.0 million in 2025 and USD 7,050.0 million in 2033 at 5.48 per cent: 46.7 per cent of the base, 25.6 per cent of the growth. Traceability software, data exchange and managed services is USD 3,150.0 million to USD 7,480.0 million at 11.42 per cent: 32.0 per cent of the base, 45.2 per cent of the growth. Recall execution and management services is USD 2,100.0 million to USD 4,890.0 million at 11.14 per cent: 21.3 per cent of the base, 29.2 per cent of the growth.
Two jurisdictions set the perimeter and pull opposite ways. The United States prescribes the data and not the system, over a narrow list: the Food Traceability List was built from 47 commodity categories. The European Union prescribes neither data nor deadline, over everything: Article 18 of Regulation (EC) No 178/2002 requires one step back and one step forward of every food business operator, and Article 19 requires immediate withdrawal and recall. Universal scope with soft specification, or narrow scope with hard specification — the spend concentrates where a firm must satisfy both, which is the exporter and the multi-country brand, not the domestic mid-market.
Executive summary — the rule costs USD 411 million a year; the market is twenty-four times that
The global food traceability and recall management market is USD 9,850.0 million in 2025 and USD 19,420.0 million in 2033, growing at 8.86 per cent a year. Volume rises from 3,420.0 million traceable consignments to 6,150.0 million, at 7.61 per cent. Realised spend per consignment rises from USD 2.8801 to USD 3.1577 — 1.16 per cent a year, below inflation in every market where this product is sold. Of the USD 9,570.0 million added across the window, 82.2 per cent is more consignments recorded, 9.9 per cent is a dearer record, and 7.9 per cent is the interaction of the two.
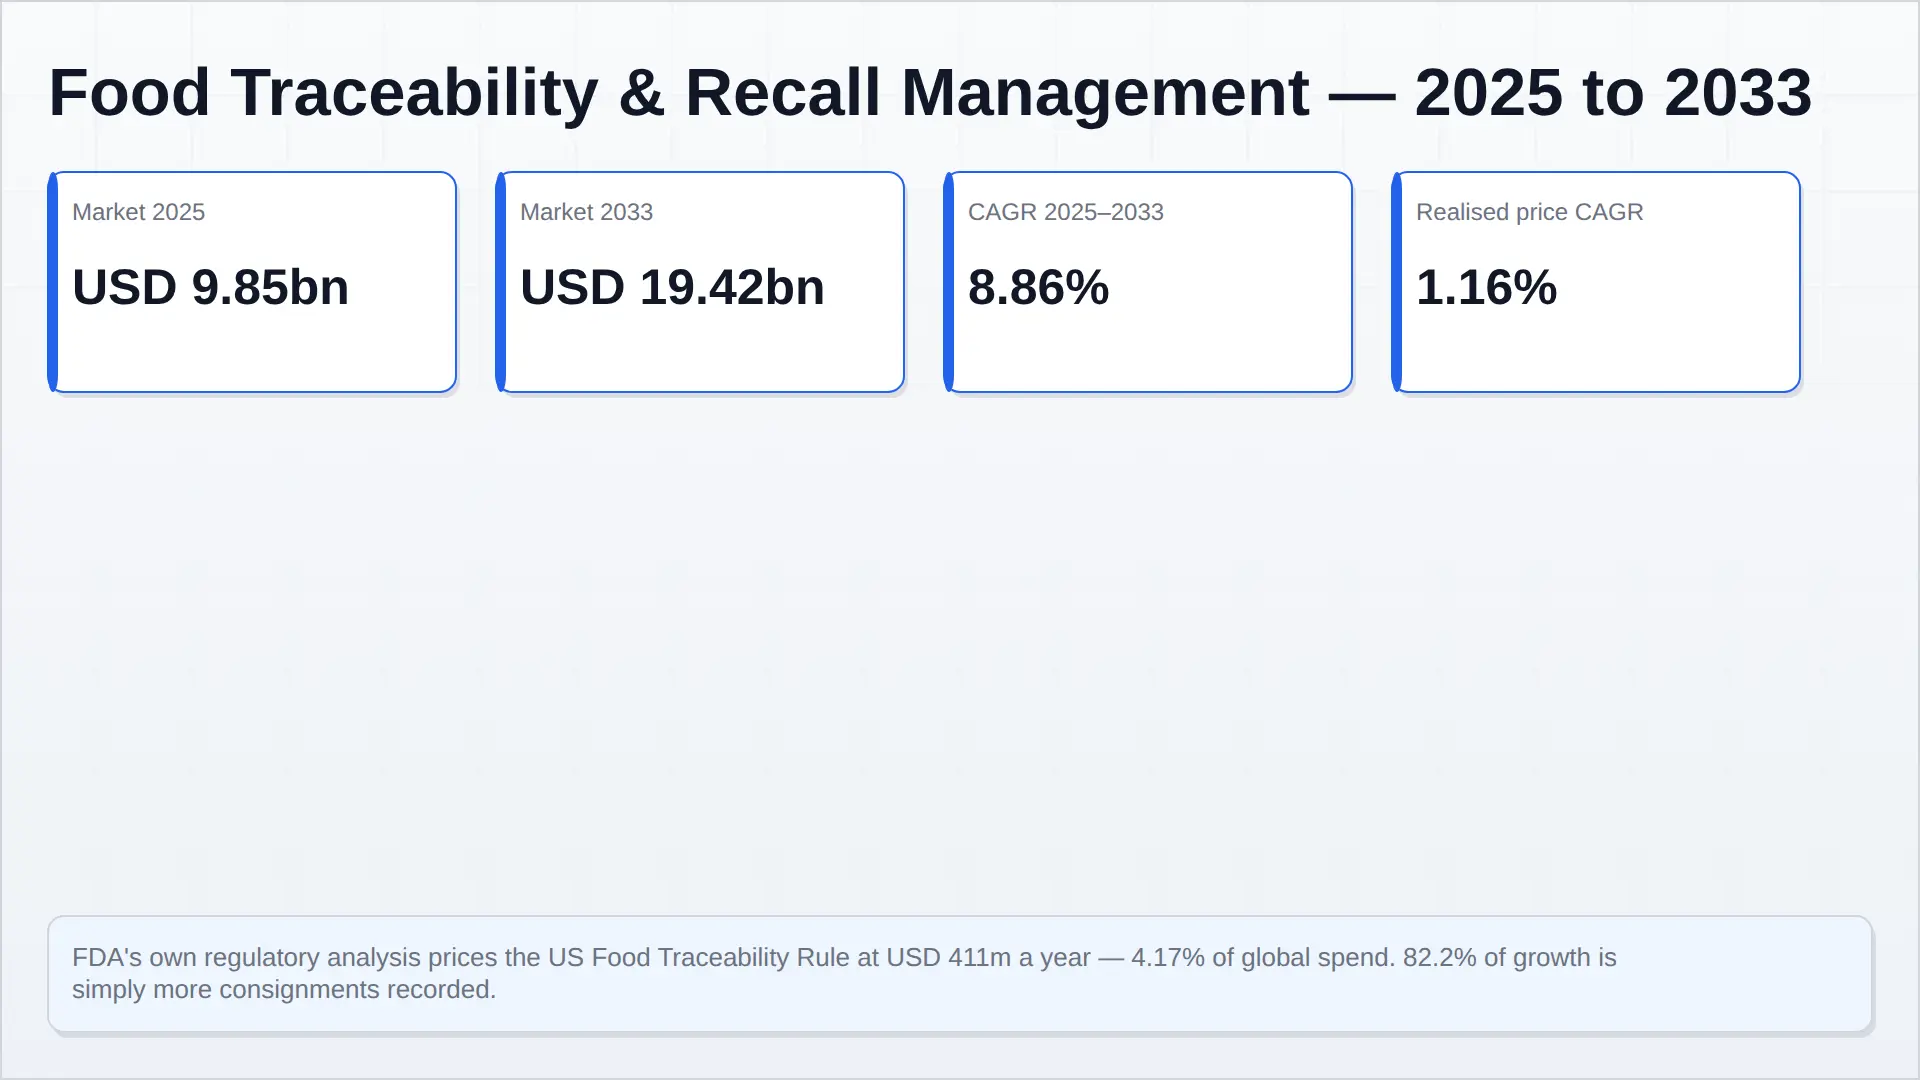
Most treatments of this market begin with the regulation and work outward. This one begins with what the regulator thinks its own regulation costs, because that number is published and it is decisive. The US Food Traceability Rule — FSMA 204 — covers approximately 422,144 firms operating 566,448 establishments, and FDA's Preliminary Regulatory Impact Analysis puts the annualised cost of complying at a primary estimate of USD 411 million a year. Divide one by the other and the obligation costs USD 725.57 per covered establishment per year. Set that against the global market modelled here and the rule accounts for 4.17 per cent of it. The market is twenty-four times the cost of the obligation most often credited with creating it.
That ratio is the report's argument, and it survives the obvious objection. FDA's own range on the estimate runs from USD 34 million to USD 2.4 billion a year, which is to say the agency cannot place its own rule within two orders of magnitude — at the high end, compliance would be roughly a quarter of the global market. But even the high end does not change the direction of travel: most of what this market sells is bought for reasons that have nothing to do with a compliance deadline. It is bought because a retailer's supplier-approval team requires a lot code on a pallet, because a cold-chain excursion needs a temperature history that will survive a courtroom, because a brand wants to answer in hours a question that used to take a week, and because the printer at the end of the line was due for replacement anyway.
The deadline has also moved. FDA proposed a thirty-month extension of the compliance date from 20 January 2026 to 20 July 2028, and the Continuing Appropriations, Agriculture, Legislative Branch, Military Construction and Veterans Affairs, and Extensions Act of 2026 then directed the agency not to enforce the rule before that date; FDA has said it intends to comply. A compliance market that has already slipped once loses the premium it charges for urgency, and re-prices into the next systems refresh rather than the next quarter. The 2028 date falls inside this forecast window, which is why the model back-loads rather than front-loads the software layer.
What the rule does not do is approve anything. It requires records containing Key Data Elements at seven Critical Tracking Events — harvest, cooling, initial packing, transformation, shipping, receiving and first land-based receiver — and their production to FDA within 24 hours. There is no approved-product list, no certification body and no interoperability test. GS1 publishes detailed mapping guidance against those events and opens it by stating that, as with all GS1 standards, the guideline "is voluntary, not mandatory." A buyer cannot purchase compliance, because there is nothing to be certified against. A buyer can only purchase speed — and speed is capped by where the record is created, which is usually a scanner, a printer or a label applied by whoever is closest to the physical event.
| Layer | 2025 (USD m) | 2033 (USD m) | CAGR | Share of 2025 base | Share of growth |
|---|---|---|---|---|---|
| Marking, capture and labelling | 4,600.0 | 7,050.0 | 5.48% | 46.7% | 25.6% |
| Traceability software, data exchange and managed services | 3,150.0 | 7,480.0 | 11.42% | 32.0% | 45.2% |
| Recall execution and management services | 2,100.0 | 4,890.0 | 11.14% | 21.3% | 29.2% |
| Total | 9,850.0 | 19,420.0 | 8.86% | 100.0% | 100.0% |
That constraint explains the shape of the model. Marking, capture and labelling is the largest layer at USD 4,600.0 million and the slowest at 5.48 per cent, because it is physical and because label volumes track food volumes. Software, data exchange and managed services grows at 11.42 per cent and recall execution at 11.14 per cent, together contributing 74.4 per cent of absolute growth from 53.3 per cent of the base. The mix turns: the physical layer is 46.7 per cent of 2025 and 36.3 per cent of 2033, while the two recurring layers rise from 53.3 to 63.7 per cent.
The perimeter is set by two jurisdictions pulling opposite ways. The United States prescribes the data and not the system, over a narrow list — the Food Traceability List was built from 47 commodity categories, concentrated in fresh produce, soft and unpasteurised cheese, shell eggs, nut butters and seafood. The European Union prescribes neither format nor deadline, over everything: Article 18 of Regulation (EC) No 178/2002 requires every food business operator to identify the supplier and the recipient one step either side, and Article 19 requires immediate withdrawal and recall, with consumer information where the food reached consumers. Narrow scope with hard specification, or universal scope with soft specification — the spend concentrates in the firm that must satisfy both, which is the exporter and the multi-country brand, not the domestic mid-market.
Three findings carry the rest of the report. First, the recall half is where the money per event sits and the traceability half is where the recurring money sits, and the two are bought by different people out of different budgets — operations buys capture, while legal and quality buy response. Second, the loss this market insures cannot be measured: a joint Food Marketing Institute and Grocery Manufacturers Association study puts the average recall at USD 10 million in direct cost, and the commercial lead of a recall-services provider describes that direct cost as "typically" the smallest cost of all. A product that prevents an unquantifiable loss has no value-based price, which is why realisation is 1.16 per cent. Third, the pure-play platforms are not growing at the rate the model says the layer grows — Antares Vision's revenue fell 3.0 per cent in 2024 — and the difference is going to the capture layer and to the enterprise software the buyer already owns.
How the value base was built. The base is a construct, and the band is USD 8.2–11.6 billion around USD 9,850.0 million. It is built bottom-up from consignment volumes in the formalised food chain — not from a census of establishments — multiplied by observed spend per consignment across capture, aggregation and response, with a coverage ratio for the spend embedded in enterprise systems and in packaging print that cannot be separated from a general labelling budget. It includes only the share of marking and coding attributable to traceability-grade identification, and it excludes food-safety laboratory testing, which is modelled separately in the sibling reports linked from this one.
Method. The report is a 70:30 secondary-to-primary construction. The secondary layer is the regulatory and financial record: FDA's rule page, Food Traceability List and regulatory impact analysis; Regulation (EC) No 178/2002; the Commission's 2024 Alert and Cooperation Network report; GS1's EPCIS mapping; the agencies' recall datasets; and results releases from Avery Dennison, Zebra Technologies and Antares Vision. The primary layer is ours: the value model and its three-layer decomposition, the volume-price-interaction split, a boundary analysis of which buying decisions are regulatory, an interview programme with quality and technical managers at manufacturers, importer and retailer supplier-approval staff, and labelling and coding vendors, conference-floor discussion at food-safety and standards events, and a structured survey of mid-market manufacturers on traceability budgets. No interview count and no named interviewee is published. No competitor research is cited anywhere in this report.
Sources and identifiers. Company names in this report are linked to the Wikidata identity record that the report's entity resolution binds to, because Pheonix company profile pages do not yet exist for these firms; each mention mints an entity node that such a page would later attach to. Primary documents: FDA, FSMA Final Rule on Requirements for Additional Traceability Records for Certain Foods and Food Traceability List; FDA, Requirements for Additional Traceability Records for Certain Foods — Preliminary Regulatory Impact Analysis; Regulation (EC) No 178/2002 (consolidated); European Commission, 2024 Annual Report — Alert and Cooperation Network; GS1 US, EPCIS Recommendations for FSMA 204 Critical Tracking Events, Release 2.0, 15 May 2025. Sector context sits in the Food Safety & Quality Testing segment.
Table of Contents
Table of contents
- Executive summary — the rule costs USD 411 million a year and the market is twenty-four times that
- How the value base was built, and what it excludes
- Volume, price and interaction: the three-way decomposition
- The three layers and why the physical one is losing share
- The value chain: from the event to the record to the answer
- Where the margin sits — capture, aggregation, response
- Who actually pays for a traceability record
- Competitive landscape: the capture layer, and what its growth rate admits
- Competitive landscape: the platform layer, and the pure-play that shrank
- Why no vendor can sell compliance
- Ownership and deal activity: capital is consolidating capture, not software
- Technology: EPCIS 2.0, the scan that creates the event, and the paper problem
- Three things that could compress the standalone platform
- Market risk: the deferral, the rising recall count, and a loss nobody can measure
- Regulation: FSMA 204 on 20 July 2028, Article 18 today, and the asymmetry between them
Competitive Landscape
Competitive landscape: three layers that do not compete with each other
The most common mistake made about this market is to treat it as one competitive set. It is three, and the participants in one rarely meet the participants in another. What follows sets out each layer with the disclosed numbers that exist, and states plainly where the disclosed numbers contradict the model.
The capture layer: industrial, disclosed, and growing like GDP
Avery Dennison is the clearest read available on the physical layer. Full-year 2025 net sales were USD 8,855.5 million, up 1.1 per cent reported and 0.2 per cent organic. Within that, the Solutions Group — intelligent labels, Vestcom, Embelex and the base solutions business — delivered USD 2,762.2 million, up 2.2 per cent organic, with high-value categories up high single digits, intelligent labels up low single digits and base solutions down mid-single digits. Adjusted operating margin in the Group was 10.4 per cent. A company that sells the substrate on which almost every traceability record in the world is printed grew its relevant segment by about two per cent in a year when the regulatory deadline was eighteen months away.
Zebra Technologies gives the complementary read on capture hardware. Fourth-quarter 2025 net sales were USD 1,475 million, up 10.6 per cent reported and 2.5 per cent organically, with Connected Frontline at USD 854 million and Asset Visibility & Automation at USD 621 million; gross margin was 47.3 per cent, and the quarter carried USD 76 million of exit and restructuring charges including the previously announced exit from its robotics business. Reported growth of 10.6 per cent against organic growth of 2.5 per cent is the signature of an acquisition — the release attributes part of the cost increase to the addition of Elo Touch — plus currency. The organic number is the one that matters, and it is a low-single-digit number.
Beneath those two sit the components. Impinj supplies the RAIN RFID chips that make a label an event generator rather than a printed rectangle; Veralto holds Videojet, whose date-coding and marking equipment puts the lot code on the pack, and Esko, whose packaging workflow decides where on the pack it sits; and Markem-Imaje, inside Dover, competes with Videojet for the same line-end position. None of these companies describes itself as a food traceability company. All of them are indispensable to it.
That is the layer’s strategic problem in one sentence: it is a set of industrial businesses whose products happen to be the load-bearing element of a compliance regime they do not sell against. The growth rate in the model — 5.48 per cent — is above what Avery Dennison’s organic growth would imply and below what a compliance-driven narrative would imply, and the reason is mix: radio-frequency inlays and vision-enabled capture are growing faster than printed label stock, which is why the layer outgrows its largest constituent without anywhere approaching the software layer’s rate.
The platform layer: a growing category with a shrinking pure-play
The model says the software, data-exchange and managed-services layer grows at 11.42 per cent. The best-disclosed pure-play in the category does not. Antares Vision — Italian, listed, and the closest thing to a dedicated track-and-trace company of scale — reported 2024 revenue of EUR 207.5 million, down 3.0 per cent, adjusted EBITDA of EUR 31.7 million (15.3 per cent margin), adjusted EBIT of EUR 10.6 million (5.1 per cent), and a net loss of EUR 18.8 million. Its reported EBIT was negative EUR 11.8 million before adjustments of EUR 22.4 million.
The gap between an 11.42 per cent model and a minus 3.0 per cent pure-play is not a modelling error; it is the finding. The layer is growing, but the growth is not accruing to the standalone platform vendors. It is accruing to two places the model counts inside the same layer: the enterprise software the buyer already owns — SAP and Oracle already hold the batch master data, the production order and the goods movement, and a traceability module is an extension rather than a platform purchase — and the managed-service businesses that do the unglamorous work of onboarding suppliers and cleaning records. Emerson Electric occupies the same position from the automation side, and Carrier Global holds the condition-data flank through Sensitech, where the record being sold is not the lot’s location but its temperature history.
There are credible independents in the layer, and four of them carry no link in this report because there is no verifiable entity to link to: Trustwell, which absorbed FoodLogiQ; Trace One, which is strongest in private-label and retailer specification; OPTEL, which bridges serialisation and food; and Controlant, which sells cold-chain visibility as a service. Named with their positioning and not with invented identifiers.
Why no vendor in any layer can sell compliance
The rule requires records, not systems. There is no approved-product list, no certification body, no interoperability test and no mandatory data standard; GS1’s own mapping guidance for the rule’s Critical Tracking Events says in terms that the standard “is voluntary, not mandatory.” The commercial consequence is severe and it applies to all three layers: a procurement team cannot write a specification that says “certified compliant”, because no certificate exists. It can only write a specification for features and price. That is why the capture layer competes on cents per label, why the platform layer is vulnerable to bundling by an incumbent ERP, and why the only genuinely defensible positions in the market are three: owning the printer estate and the consumables annuity, owning the retailer’s supplier portal so that the specification is written in your data model, and owning the reference data that makes a record interpretable.
Refused rather than estimated. This report publishes no market-share table. Not one of the ten companies named here discloses a food-traceability-specific revenue line, and three of the most relevant — Trustwell, Trace One and Controlant — disclose no revenue at all. Constructing shares from total company revenue would produce a table that looks authoritative and means nothing, so the layer-level model and the disclosed anchors stand in its place.
Value Chain
The value chain: from the event to the record to the answer
A traceability record is not created when a company decides to buy traceability. It is created when a pallet is scanned onto a trailer at four in the afternoon by someone who has eleven more to do before the shift ends. Everything commercially interesting about this market follows from that fact: the record is produced by the party furthest from the money, at the moment of least attention, and every layer above it is compensation for how unreliable that moment is.
The chain therefore sells three different products at three different points, to three different buyers with three different budgets. Capture is sold at the event — labels, printers, scanners, inlays, vision systems, date coding — and it is bought by operations out of capital and consumables budgets. Aggregation is sold between firms — the exchange layer that turns one company’s outbound record into another company’s inbound record — and it is bought by quality and IT, often at the insistence of a retailer. Response is sold after the event — notification, retrieval, disposition, regulatory liaison, documentation — and it is bought by legal, quality and risk out of an episodic budget that only exists once something has gone wrong. The three are not stages of one purchase. They are three purchases, and the market’s growth rate is the weighted average of three different dynamics.
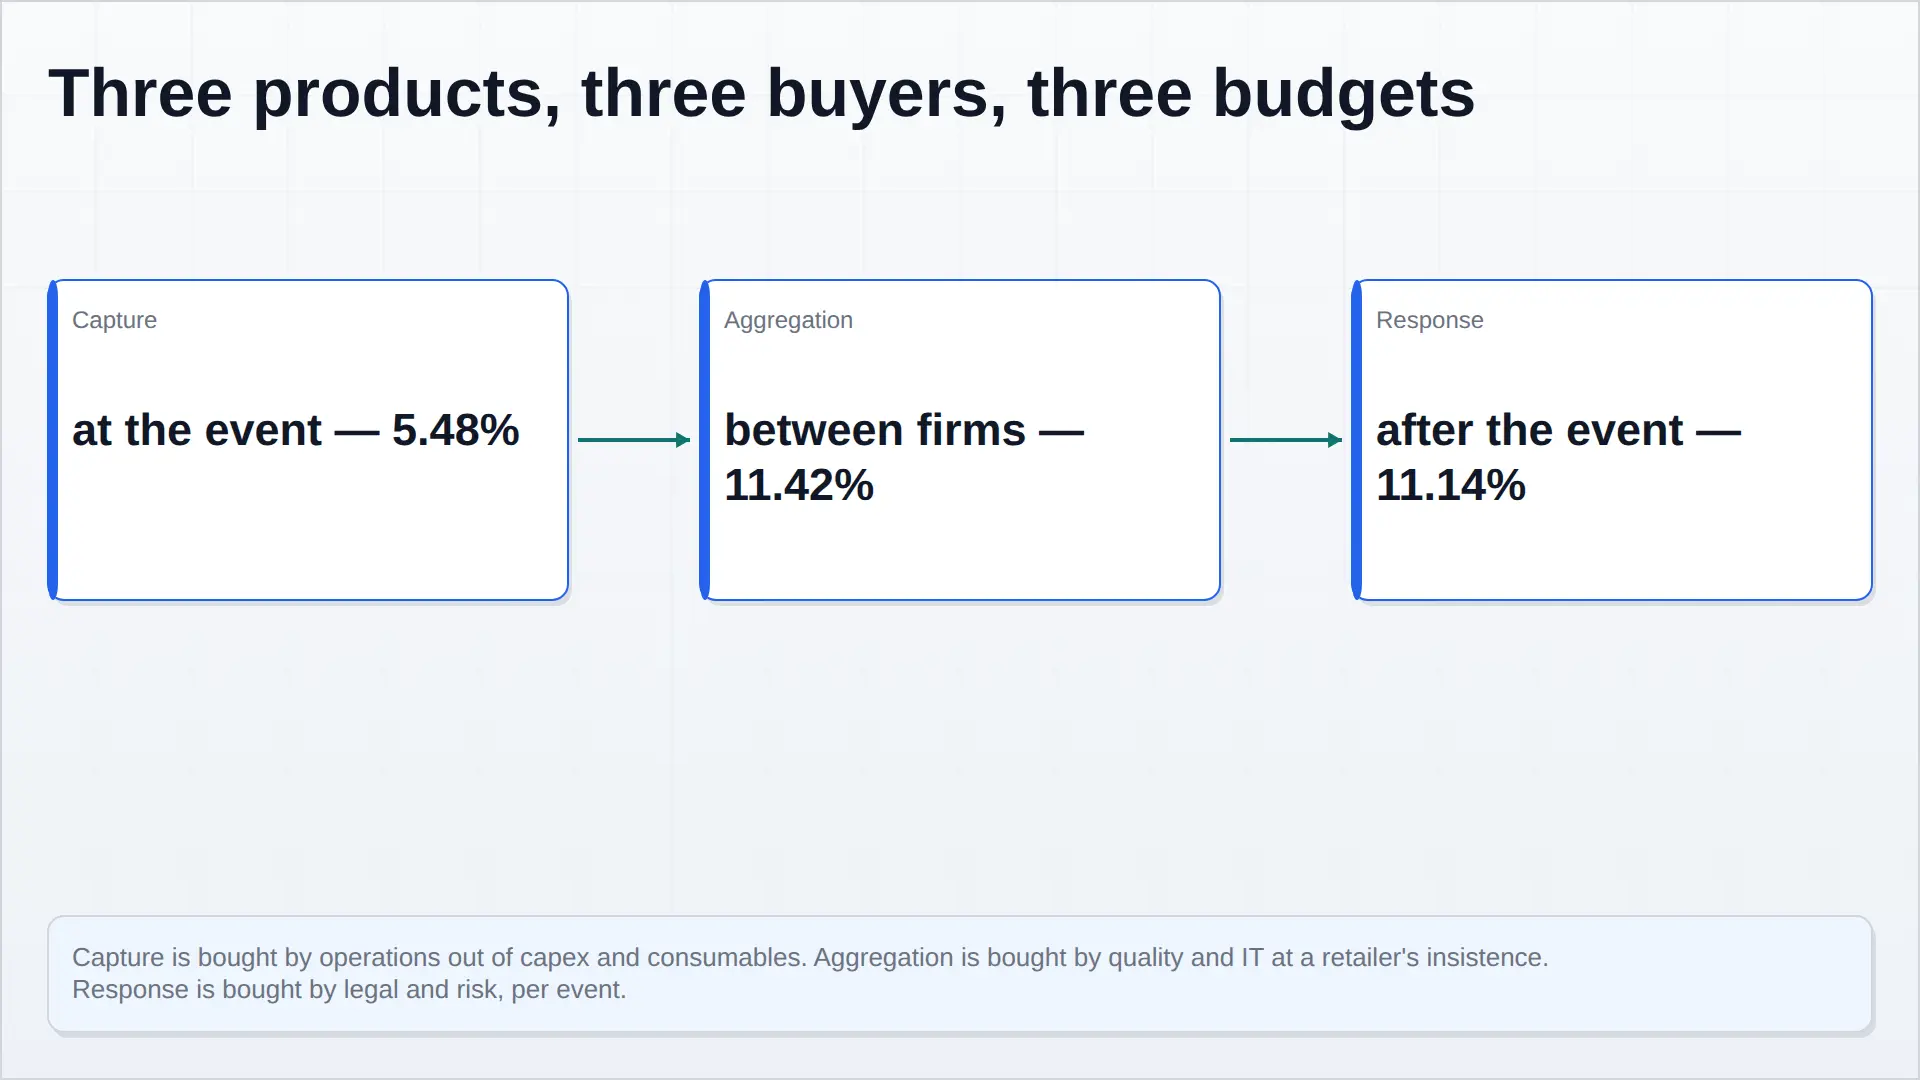
The legal architecture explains why aggregation can be sold at all. Article 18 of Regulation (EC) No 178/2002 requires one step back and one step forward. FSMA 204 requires each covered entity to keep its own records at its own Critical Tracking Events and produce them within 24 hours. In neither case is any single participant required to hold the whole chain. No regulator has ever demanded a complete graph from any one firm, which means the complete graph is not a compliance product — it is a commercial one, sold to firms that want to answer a question faster than their competitors, or that have been told by a customer to answer it faster. That distinction is the difference between a licence priced against a fine and a licence priced against a service level, and it is worth roughly the gap between the capture layer’s 5.48 per cent and the aggregation layer’s 11.42 per cent.
The asymmetry of who creates the record is the structural weakness of the whole chain. In a co-packing arrangement, the brand owner holds the specification, the co-packer holds the batch record, and the third-party logistics provider holds the outbound scan. Three companies, three systems, three data dictionaries, and the party with the least commercial interest in the outcome — the one paid per case — is the one whose scan decides whether the answer arrives in four hours or four days. Our interviews with quality managers returned the same complaint in different words across markets: the traceability system is only as good as the least invested partner in the chain, and the least invested partner is usually the one with the smallest margin. This is why managed services and “supplier onboarding” appear in vendor propositions that have nothing else in common, and why the aggregation layer grows faster than the software it runs on.
The price ladder is unusually legible for a market this fragmented, because most of the components are quoted publicly. A traceability-grade label costs a fraction of a cent to a few cents depending on substrate and whether it carries a radio-frequency inlay. A thermal-transfer printer at a line end is a capital item in the low thousands of dollars, amortised over five to seven years. A site licence for a compliance module sits in the low tens of thousands a year. A per-consignment exchange fee is a fraction of a cent to a few cents. A recall execution engagement is quoted per event, and is the only line in the ladder where the price is negotiated against a loss rather than against a cost. That ladder is why the physical layer holds 46.7 per cent of the 2025 base while contributing 25.6 per cent of growth: it is priced against manufacturing input costs and it tracks food volumes, not information volumes.
Margin behaves the opposite way to revenue. Avery Dennison‘s Solutions Group — the part of the business that carries intelligent labels, Vestcom and Embelex — reported a 10.4 per cent adjusted operating margin in 2025 on USD 2,762.2 million of sales. That is a good industrial margin and a thin software margin. Meanwhile Zebra Technologies reported a 47.3 per cent gross margin in the fourth quarter of 2025 on USD 1,475 million of net sales, with organic growth of 2.5 per cent — hardware economics with a services tail attached. The aggregation layer’s margin is higher and less visible, because the largest participants are enterprise software companies that do not disclose a traceability line, and the pure-plays are private. The response layer’s margin is highest per engagement and least predictable, because it is priced against a loss.
Follow one failure through the chain and the economics become concrete. A finished feed consignment fails a mycotoxin test — the category modelled in our mycotoxin testing and feed binder report, where the test is priced like a commodity and the binder is priced like insurance. The test result is one data point. The commercial event is the retrieval: which lots, which customers, which vessels, which warehouses, in what order. The binder sale is priced against the risk; the traceability system is priced against the width of that retrieval. Firms that have never run a recall believe the cost is the destroyed product. Firms that have run one know the cost is the labour of finding it, and that the finding is limited by the worst record in the chain.
Who actually pays is the least understood part of the value chain, and the answer differs by jurisdiction. In the United States, the buyer is frequently the manufacturer, prompted by a customer specification or by the rule. In the European Union, where the legal obligation has existed since 2002 and imposes no format, the buyer is usually the retailer’s supplier-approval function — a technical team that decides whether a supplier’s data is good enough to be listed. Our interviews with supplier-approval staff put the threshold not at legal compliance, which is assumed, but at the speed of response to a speculative query. That is a service-level purchase dressed as a compliance purchase, and it is priced accordingly, which is why the aggregation layer can charge more in Europe than the law there would ever require.
Two consequences follow for the model. First, the layer mix turns because the recurring layers are attached to consignments rather than to sites: a manufacturer buys one printer per line but pays per consignment, and consignment counts grow faster than line counts. Second, the capture layer cannot be disintermediated by software, because no software can create a record that nobody scanned. That is the floor under the physical layer — and, as the next chapter shows, the ceiling over the platform layer that sits above it.
What this chapter does not do. It does not split the market by region, because the model carries no geography: the European reading above is a judgement drawn from the legal asymmetry and the interview programme, not a modelled regional share, and it is labelled as such. It also does not split by channel, because the same capture hardware is sold direct, through integrators and through label converters, and no participant discloses the mix in a way that would survive scrutiny.
Investment Activity
Ownership and deal activity: capital is consolidating capture, not software
Follow the acquisitions in this market and you learn where the defensible position is, faster than any vendor presentation will tell you. Almost every disclosed transaction in the last three years sits in the physical layer. Almost none sits in the platform layer, and the one platform roll-up of scale in the category has spent the period since its acquisitions writing them down.
Zebra Technologies‘ fourth quarter of 2025 contains both halves of the thesis in one release. Reported net sales rose 10.6 per cent to USD 1,475 million while organic growth was 2.5 per cent — a roughly eight-point gap attributable to currency and to an acquisition, which the release identifies in its operating-expense discussion as Elo Touch. In the same quarter the company booked USD 76 million of exit and restructuring charges, including the previously announced exit from its robotics business. Buy the thing that puts a device in a worker’s hand; leave the thing that moves a pallet without one. That is a considered statement about where the annuity is.
It is the right call on the numbers. Capture is defended by estate and consumables: once a site standardises on a printer family, the label stock and the service contract follow for a decade, and the switching cost is a re-validation of every label template. That is a real moat and it is why Avery Dennison‘s Solutions Group can carry a 10.4 per cent adjusted operating margin on 2.2 per cent organic growth in a flat year — modest growth, durable position, and capital returned rather than redeployed. The same logic explains why Veralto holds Videojet and Esko at all: a coding device at the end of a packaging line is the single highest-leverage piece of hardware in the chain, because if the lot code is not on the pack there is no record to trace. It is worth noting what the entity registry makes of that company: Wikidata’s one-line description of Veralto is “American water company”, which is a fair summary of its revenue mix and a poor summary of its importance to food traceability.
The platform layer tells the opposite story, and it is the most instructive fact in this report after the regulator’s own cost estimate. Antares Vision built itself into the category’s only listed pure-play of scale through acquisition, and in 2024 it reported revenue of EUR 207.5 million, down 3.0 per cent; adjusted EBITDA of EUR 31.7 million at a 15.3 per cent margin; adjusted EBIT of EUR 10.6 million at 5.1 per cent; and a net loss of EUR 18.8 million. The gap between reported and adjusted operating profit — negative EUR 11.8 million against positive EUR 10.6 million — is EUR 22.4 million of adjustments in a single year. Whatever the merits of those adjustments individually, the aggregate is the answer to a question every strategist in this category asks: what does it cost to assemble a traceability platform by buying the pieces? Roughly a fifth of revenue, annually, for a company that then shrank.
That is not an argument that the platform layer is worthless. It is an argument that the layer’s value accrues to whoever already owns the data model, and that buying installed bases does not create a graph. Two installed bases joined by an acquisition remain two installed bases until every customer re-onboards, and re-onboarding a supplier network is the least attractive project in food manufacturing. The platform layer’s 11.42 per cent growth in this model therefore runs mostly to SAP and Oracle, which sell the module to a customer that has already bought the batch master data, and to the managed-service providers that do the onboarding work the software cannot do for itself.
Private capital has read the same signal and acted on it differently. The most interesting assets in the category are not for sale and are not consolidated: Trustwell, which absorbed FoodLogiQ and now holds a large share of the US supplier-documentation market; Trace One, which sits inside retailer private-label specification; OPTEL, which came to food from pharmaceutical serialisation; and Controlant, which sells cold-chain visibility as a service rather than a licence. Each is a different bet on the same insight — that the money is in the workflow, not the database — and none discloses enough to price. A fifth, less visible pool of capital sits in the logistics and insurance industries, where the buyer of traceability is the party that carries the recall risk rather than the party that creates it. That capital is the most likely source of the next significant transaction in the category, and it is invisible in any vendor-disclosed figure.
Why the direction is rising rather than consolidating. There are three reasons to expect more capital to enter rather than less. The first is the 2028 compliance date: a deadline inside the forecast window creates a buying window, and buying windows attract roll-ups. The second is the printer estate: an installed base of line-end coders and thermal printers is one of the few assets in food manufacturing with a genuine consumables annuity, which is precisely the profile private equity has been buying in adjacent industrial markets. The third is data ownership — several large food manufacturers have concluded in the last two years that their traceability data is a commercial asset rather than a compliance cost, and a manufacturer that believes that will eventually buy the layer that holds it.
Refused rather than estimated. No transaction multiple is published for any deal discussed here. Elo Touch is not a food-traceability business and no separable consideration was disclosed; Antares Vision’s acquisitions are reported in aggregate with no food-specific revenue attribution; and the private assets named above have no disclosed financials at all. A multiple computed from a total-company enterprise value divided by a total-company revenue line would be a number with no referent, and this report does not publish one.
Technology & Innovation
Technology: EPCIS 2.0, the scan that creates the event, and the paper problem
The technical standard that governs this market is not new and is not proprietary. EPCIS — Electronic Product Code Information Services — models a supply chain as a sequence of events, each answering what objects were involved, where and when it happened, and why it happened, with the business process and transaction documents attached. GS1 US published its recommendations for mapping the US rule’s Critical Tracking Events onto EPCIS at Release 2.0 on 15 May 2025, with JSON event examples and field-level mapping tables for all seven events. On the evidence of that document, the technical problem of traceability has been solved for a decade. What has not been solved is the reason almost none of it is captured.
Read the guidance’s own caveats and the commercial structure of the market becomes visible. It states that, as with all GS1 standards, the guideline is voluntary and not mandatory, and that the words “must” and “require” throughout “relate exclusively to technical recommendations for the proper application of the standards to support the integrity of their implementation.” A standard whose imperative verbs are defined as advisory is a standard that will be implemented to the level the buyer specifies, and no higher. That is why the same EPCIS event model produces a fully automated pallet-level record in one facility and a lever-arch file in another, twelve miles apart, in the same company.
The binding constraint is upstream of the software: an event is only as good as the scan that created it. A receiving record exists in useful form only if someone read the incoming lot identity at the moment of receipt. Where that read is a paper manifest signed at the gate, a 24-hour obligation is not a technology requirement — it is a filing exercise whose clock starts when somebody finds the file. Our interviews returned this consistently: firms that describe themselves as fully traceable usually mean their dispatch data is digital, and firms that have tested themselves usually discover that inbound data is the weak link, because the supplier with the weakest system sets the accuracy of the buyer’s record.
That is why the capture layer’s technology road map matters more than the platform layer’s. Three developments are doing real work. Radio-frequency identification has become economic for case and pallet level, where the value is reading forty items in a doorway without line of sight; Impinj supplies the chip layer that decides the inlay price, and the inlay price decides whether a tag goes on a case or only on a pallet. Vision and optical character recognition at goods-in attack the paper problem directly, because a date code printed for a human eye is a computer-vision problem: variable fonts, curved surfaces, low contrast and a printer that has been running for six hours. Every accuracy point gained there converts a manual data-entry cost into an automated event. GS1 Digital Link moves the same identifier from a closed supply-chain data pool to a consumer-scannable URL, which is how a batch identity reaches a shopper instead of a compliance file — the mechanism behind the claim-labelling shift examined in our article on honey labels asserting percentages from 14 June 2026, where a label can make a claim no published method can verify because nothing in the chain carries a batch-level evidence record.
Blockchain occupies a disproportionate share of the conversation and a negligible share of the spend, for a reason that is conceptual rather than commercial: an immutable ledger preserves whatever was written to it, including a wrong lot number, and it prices the wrongness at the cost of a distributed network rather than the cost of an edit. The interesting implementations of the last three years have quietly abandoned the ledger and kept the event repository — the same architecture EPCIS specified, with a permissioned database doing the work. That is not a failure of ambition. It is the market discovering that the traceability problem is a data-capture problem and not a trust problem, because the parties exchanging records are already in a contract.
Master data, not connectivity, is the technical bottleneck that decides which vendors survive. A lot code is meaningless unless the item it belongs to is the same item on both sides of the exchange — same GTIN, same pack configuration, same unit of measure, same treatment of a repack. Our interviews with retailer supplier-approval teams put item-data quality at the top of their rejection reasons, ahead of any functional gap in the software. Vendors that sell item-data cleansing and supplier onboarding at scale are therefore selling the least glamorous and most defensible product in the category, and it is why the managed-services component of the middle layer grows faster than the licence component.
Three things that could compress the standalone platform
Enterprise software bundling. Batch master data, production orders and goods movements already live in SAP and Oracle. A traceability module priced as an extension is worth less per seat than a platform, and the buyer’s procurement process treats it as an extension. This is the single largest threat to the layer’s 11.42 per cent.
Retailer-mandated data models. When a large grocer specifies its supplier portal, it effectively standardises the middle. Standardisation is good for the market’s volume and bad for the middle layer’s pricing power, because it converts a differentiated graph into a required format. The market’s growth would continue; the margin would migrate to whoever operates the portal.
Event automation at the edge. If computer vision and cheap sensing make the event capture automatic, value moves back toward the capture layer and toward whoever owns the device — the opposite of the mix shift this report models. It is a genuine two-sided exposure, and the reason the capture layer is modelled at 5.48 per cent rather than at its historical flat-to-low-single-digit rate.
Adjacent technology is already in the plant, and it is where the next integration battle will be fought. Hygiene verification and ATP monitoring, modelled in our food plant hygiene monitoring report, already generates timestamped, location-stamped quality events. laboratory results, modelled in food safety testing, already attach a verdict to a lot. A traceability record that cannot see either is a logistics record wearing a quality badge, and the firms that connect the three will be selling something no ERP module and no label printer can replicate.
Market Risk
Market risk: the deferral, the rising recall count, and a loss nobody can measure
The central risk to this forecast is not technological and it is not competitive. It is that the buyer’s reason for acting disappears, and the reason most often given is a date that has already moved once.
Risk one: the deadline slips again. The compliance date for the US rule moved from 20 January 2026 to 20 July 2028 — a thirty-month extension, proposed by FDA and then reinforced by a Congressional directive that the agency not enforce before that date. A market that has been sold a cliff has now been sold a cliff that receded. If it recedes again past 2030, the compliance-driven portion of demand does not vanish, but it defers into a period where a board can reasonably decide to wait, and the software layer’s 11.42 per cent becomes something closer to the capture layer’s rate. This is the scenario our model is most exposed to, and the reason the software layer is back-loaded rather than front-loaded.
Here the honest accounting matters more than the scenario. The rule’s compliance cost is USD 411 million a year against a market of USD 9,850.0 million — 4.17 per cent. Removing every dollar of rule-driven spend would barely move the total. What the rule actually contributes is not money but attention: it is the reason a capital request reaches a steering committee rather than dying in a plant budget. The risk, in other words, is not the 4.17 per cent. It is the narrative premium, which is unquantifiable and larger than the line item.
Risk two: recall incidence is doing the opposite of what the compliance story predicts. Food recall events counted from the agencies’ own datasets fell 9 per cent in 2024 to 516 — 461 FDA food enforcement events and 55 USDA-FSIS actions — and then rose to 641 in 2025, with 574 FDA events and 67 FSIS actions, and stood at 483 by late November 2026. Two things follow. The first is that recall incidence is not a function of the traceability rule; it moved up by 24 per cent in the year the rule was deferred. The second is that rising incidence is good for the response layer and bad for its customers, which is an uncomfortable thing for a market to depend on. Response revenue grows when its buyers have a worse year, and a forecast that leans on that is leaning on other people’s failures.
The European numbers point the same way and are stronger. The Alert and Cooperation Network recorded 9,460 notifications in 2024, up 8 per cent, of which RASFF accounted for 5,250, up 12 per cent. Around a third of RASFF notifications were border rejections, dominated by pesticide residues in fruit and vegetable consignments. Agri-food fraud notifications fell by one third to 546 — consistent with the finding in our food authenticity and adulteration testing report, where the demand case had to be built on claim density and surveillance sampling rather than on fraud incidence. The operational load in Europe is rising on safety and border control, not on fraud, and safety notifications are precisely what a recall-response provider is paid to handle.
Risk three: the loss cannot be measured, so the price cannot hold. The best-known industry figure puts the average food recall at USD 10 million in direct cost, from a joint Food Marketing Institute and Grocery Manufacturers Association study. Against the 516 events recorded in 2024, that implies about USD 5.16 billion of direct recall cost in a single market in a single year — a little over half the annual value of the global market modelled here, which would make prevention-and-response spend across the entire world roughly 1.9 times one country’s annual direct recall losses. That ratio is plausible and it is also unfalsifiable, because the direct cost is only the measurable part. The commercial lead of a recall-services provider has said the direct cost is “typically” the smallest of the costs involved, with lost sales and brand equity larger and unmeasurable. A vendor selling against an unmeasurable loss cannot price on value, which is the mechanical explanation for the 1.16 per cent realisation in this model. It is also the reason the response layer is priced per event rather than as a subscription.
Risk four: substitution by the software the buyer already owns. This is the highest-probability compression in the report and the one most visible in the disclosed numbers. The pure-play platform of scale shrank 3.0 per cent in 2024 while the layer it sits in is modelled at 11.42 per cent. The growth is going to enterprise suites that already hold the batch master data and to managed services that do the onboarding. A second bundling wave — quality management suites absorbing traceability as a module, or cold-chain platforms absorbing lot identity — would compress the middle layer without reducing the volume of records. The market would keep growing and the standalone platform would keep losing position, which is exactly what the Antares Vision result already shows.
Risk five: concentration and buyer power. Spend in this market is concentrated in the largest manufacturers and retailers, and the mid-market is where adoption is thinnest. Our structured survey of mid-market manufacturers found budgets staged rather than committed — specification written, capital deferred — and repeated in almost every response the expectation that the deadline would move before it applied to them. They were right. Once it moves, the mid-market’s willingness to pay a premium for urgency goes with it, and the pricing conversation reverts to the terms of the buyer’s existing enterprise agreement.
The counter-thesis, stated because it is live. If retailer specifications rather than regulators do the work, then the US rule is nearly irrelevant and this model’s back-loading is wrong: demand would be smoother and slightly stronger early, because a retailer’s supplier-approval cycle does not wait for a Federal Register notice. There is evidence for it. In Europe the law has required one-step traceability since 2002 and prescribes no format at all; the spend there is nonetheless real and is driven by supplier approval, not by Article 18. It is entirely possible that the American market will behave the same way and that the 2028 date is a coincidence rather than a cause. The model’s mid-case hedges between the two; a reader who believes the retailer is the true regulator should read the software layer’s 11.42 per cent as too cyclical and the capture layer’s 5.48 per cent as too low.
Regulatory Landscape
Regulation: FSMA 204 on 20 July 2028, Article 18 today, and the asymmetry between them
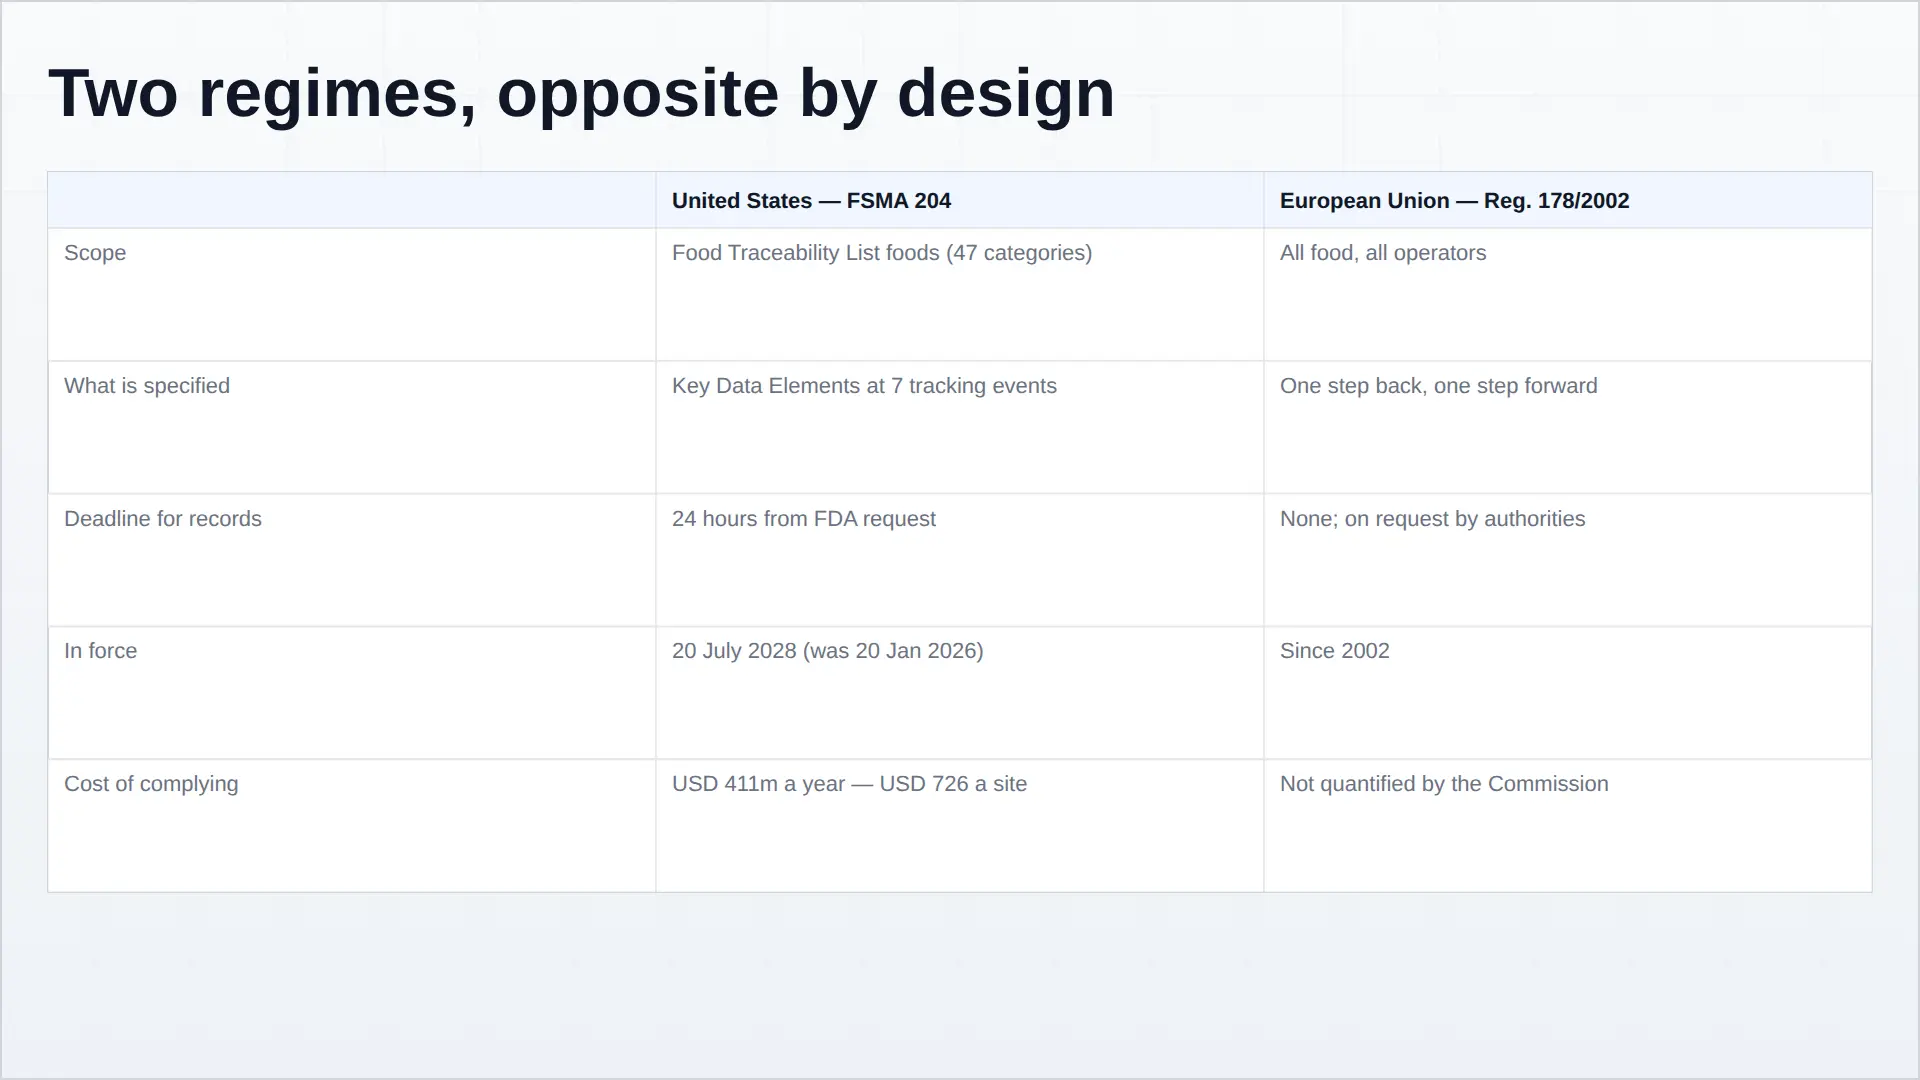
Two regimes govern this market and they are almost exact opposites. One prescribes the data and not the system, over a short list, with a deadline. The other prescribes nothing but the duty, over everything, with no deadline at all. Almost every commercial feature of the market follows from that opposition.
The United States: a specified dataset with a moving date
The Food Traceability Rule — Requirements for Additional Traceability Records for Certain Foods — was published on 21 November 2022 and implements section 204(d) of the Food Safety Modernization Act. It applies to persons who manufacture, process, pack or hold foods on the Food Traceability List, and to foods containing a listed food as an ingredient where that ingredient remains in the same form. For those foods it requires records containing Key Data Elements at specific Critical Tracking Events, and their production to FDA within 24 hours, or a reasonable time the agency agrees. The seven events are harvest, cooling, initial packing, transformation, shipping, receiving and first land-based receiver. The list itself was constructed from 47 commodity categories, drawing on the Reportable Food Registry and on industry codes in FDA’s facility-registration programme, and its centre of gravity is fresh produce, soft and unpasteurised cheese, shell eggs, nut butters and seafood.
The timing has been the market’s most volatile variable. The original compliance date for all persons subject to the recordkeeping requirements was 20 January 2026. FDA proposed a 30-month extension to 20 July 2028, reasoning that because the rule requires entities to share information with other entities in their supply chains, the only effective implementation is one in which everyone comes into compliance together. The Continuing Appropriations, Agriculture, Legislative Branch, Military Construction and Veterans Affairs, and Extensions Act of 2026 then directed FDA not to enforce the rule prior to that same date, and the agency has stated that it intends to comply with the directive.
The rule’s own cost estimate is the most useful document in this market and almost nobody quotes it. FDA’s Preliminary Regulatory Impact Analysis assumes the rule would cover approximately 422,144 firms operating 566,448 establishments, and puts ten-year annualised compliance cost at a primary estimate of USD 411 million per year at a 7 per cent discount rate, on a range from approximately USD 34 million to USD 2.4 billion; the alternative option in the co-proposal, exempting small retail establishments from the electronic sortable spreadsheet requirement, carries a primary estimate of USD 535 million. Expressed per covered establishment, the primary estimate is USD 725.57 a year. That is the price at which the United States Government believes a food business can keep the records required of it — less than the cost of a single handheld scanner, and about 4.17 per cent of what this report models as global spend.
Two conclusions follow that vendors rarely volunteer. First, the range from USD 34 million to USD 2.4 billion is not a rounding interval; it is an admission that the cost depends almost entirely on how much of an existing system can be reused, which is a property of the firm rather than of the rule. Second, enforcement against 566,448 establishments cannot be inspection-led. It will be document-request-led — which means the operative question for a buyer is not whether the record exists but whether it can be assembled inside 24 hours of a request that arrives without warning. That is a systems question, and it is the only part of the rule that reliably generates a purchase order.
The European Union: a universal duty with no specification
Regulation (EC) No 178/2002 takes the opposite approach and has done since 2002. Article 3(15) defines traceability as the ability to trace and follow a food, feed, food-producing animal or substance through all stages of production, processing and distribution. Article 18 requires every food business operator to be able to identify any person from whom they have been supplied a food and to whom they have supplied it — one step back, one step forward — and to make that information available to competent authorities on demand. Article 19 requires a business that considers a food it has placed on the market to be unsafe to initiate withdrawal procedures and, where the food has reached consumers, to recall it and inform consumers effectively. Article 50 provides the legal basis for RASFF.
What the Regulation does not do is prescribe a format, a data set, a deadline or a technology. There is no European equivalent of the Key Data Element, no 24-hour clock, and no electronic sortable spreadsheet. The obligation is universal in scope and minimal in specification, which places the operational definition of “adequate” in the hands of the retailer, the certification body and the courts. That is a very different market: the buyer’s specification does the work a regulator does in the United States, and the specification is set by a supplier-approval function that is judged on response time rather than on legal exposure.
The enforcement data show where the pressure actually is. The Alert and Cooperation Network recorded 9,460 notifications in 2024, an 8 per cent increase, with RASFF at 5,250 notifications, up 12 per cent. Around a third of RASFF notifications were border rejections, mainly pesticide residues in fruit and vegetable consignments. Germany, the Netherlands and Italy were the top notifying countries. Of the notifications generated, 1,959 RASFF and 1,335 administrative-assistance notifications were identified as possibly resulting from an intention to deceive — a screening function that matters commercially because an intentional-adulteration case is the one type of event where a forward trace becomes a criminal-evidence exercise, and evidence standards are higher than compliance standards.
What the asymmetry means commercially
A firm selling into both markets has to hold the more demanding dataset across the wider perimeter. The American rule defines what the record must contain; the European duty defines how far back and forward it must reach. Neither jurisdiction requires the firm to hold the whole chain, and neither certifies the system that holds it — GS1’s mapping guidance for the American rule is explicit that its standards are voluntary. The result is a market in which the legal minimum is cheap and universally satisfiable, and in which almost all the spend is therefore voluntary: retailer specification, brand protection, insurance condition, litigation readiness and the ordinary replacement cycle of coding and labelling equipment.
That is also the regulatory outlook’s main uncertainty. An implementing act in Brussels prescribing a format, or an American decision to extend the Food Traceability List beyond its current perimeter, would each convert voluntary spend into required spend and would move the software layer’s growth rate upward. Neither is in force, and this report does not model either. What is in force is a specified dataset with a date in 2028, and a universal duty with no date at all.