
Global Paper Cups & Lids Market Report, Size, Share and Forecast 2026–2033: The Substitution Reached the Cup and Stopped at the Lid
The largest packaging product in the world that no company reports
Not one listed converter breaks out paper cup revenue. Graphic Packaging folds cups, lids and food containers into Americas Paperboard Packaging, alongside the folding cartons it sells to cereal brands. Huhtamaki folds them into a Foodservice Packaging segment that also contains bowls, trays and cutlery. Novolex and Dart Container are private. There is no line item anywhere in the public record called “cups”.
What exists instead is a physical fact that can be counted. Somewhere between five and six thousand cup-forming lines, running at roughly 160 cups a minute and 6,000 hours a year, produce the world’s supply. That is the market. This report sizes it at 470.0 billion units and USD 15,340 million of converter realisation in 2025, reaching 647.5 billion units and USD 19,588 million by 2033.
Read those two growth rates together, because they are the report: units grow 4.09 per cent a year and value grows 3.10 per cent. Realisation per unit falls from 3.26 US cents to 3.03. Every strategic question in this industry follows from that one-point gap — what a converter does when the volume arrives and the price does not.
| Headline | 2025 | 2033 | CAGR |
|---|---|---|---|
| Market value, converter realisation | USD 15,340 m | USD 19,588 m | 3.10% |
| Volume | 470.0 bn units | 647.5 bn units | 4.09% |
| Realisation per unit | 3.26 US cents | 3.03 US cents | −0.94% |
| Value multiple over the forecast | 1.28× | ||
| Of which cups | USD 12,628 m / 313.3 bn | USD 16,180 m / 409.8 bn | 3.15% value / 3.41% units |
| Of which lids | USD 2,712 m / 156.7 bn | USD 3,408 m / 237.7 bn | 2.90% value / 5.35% units |
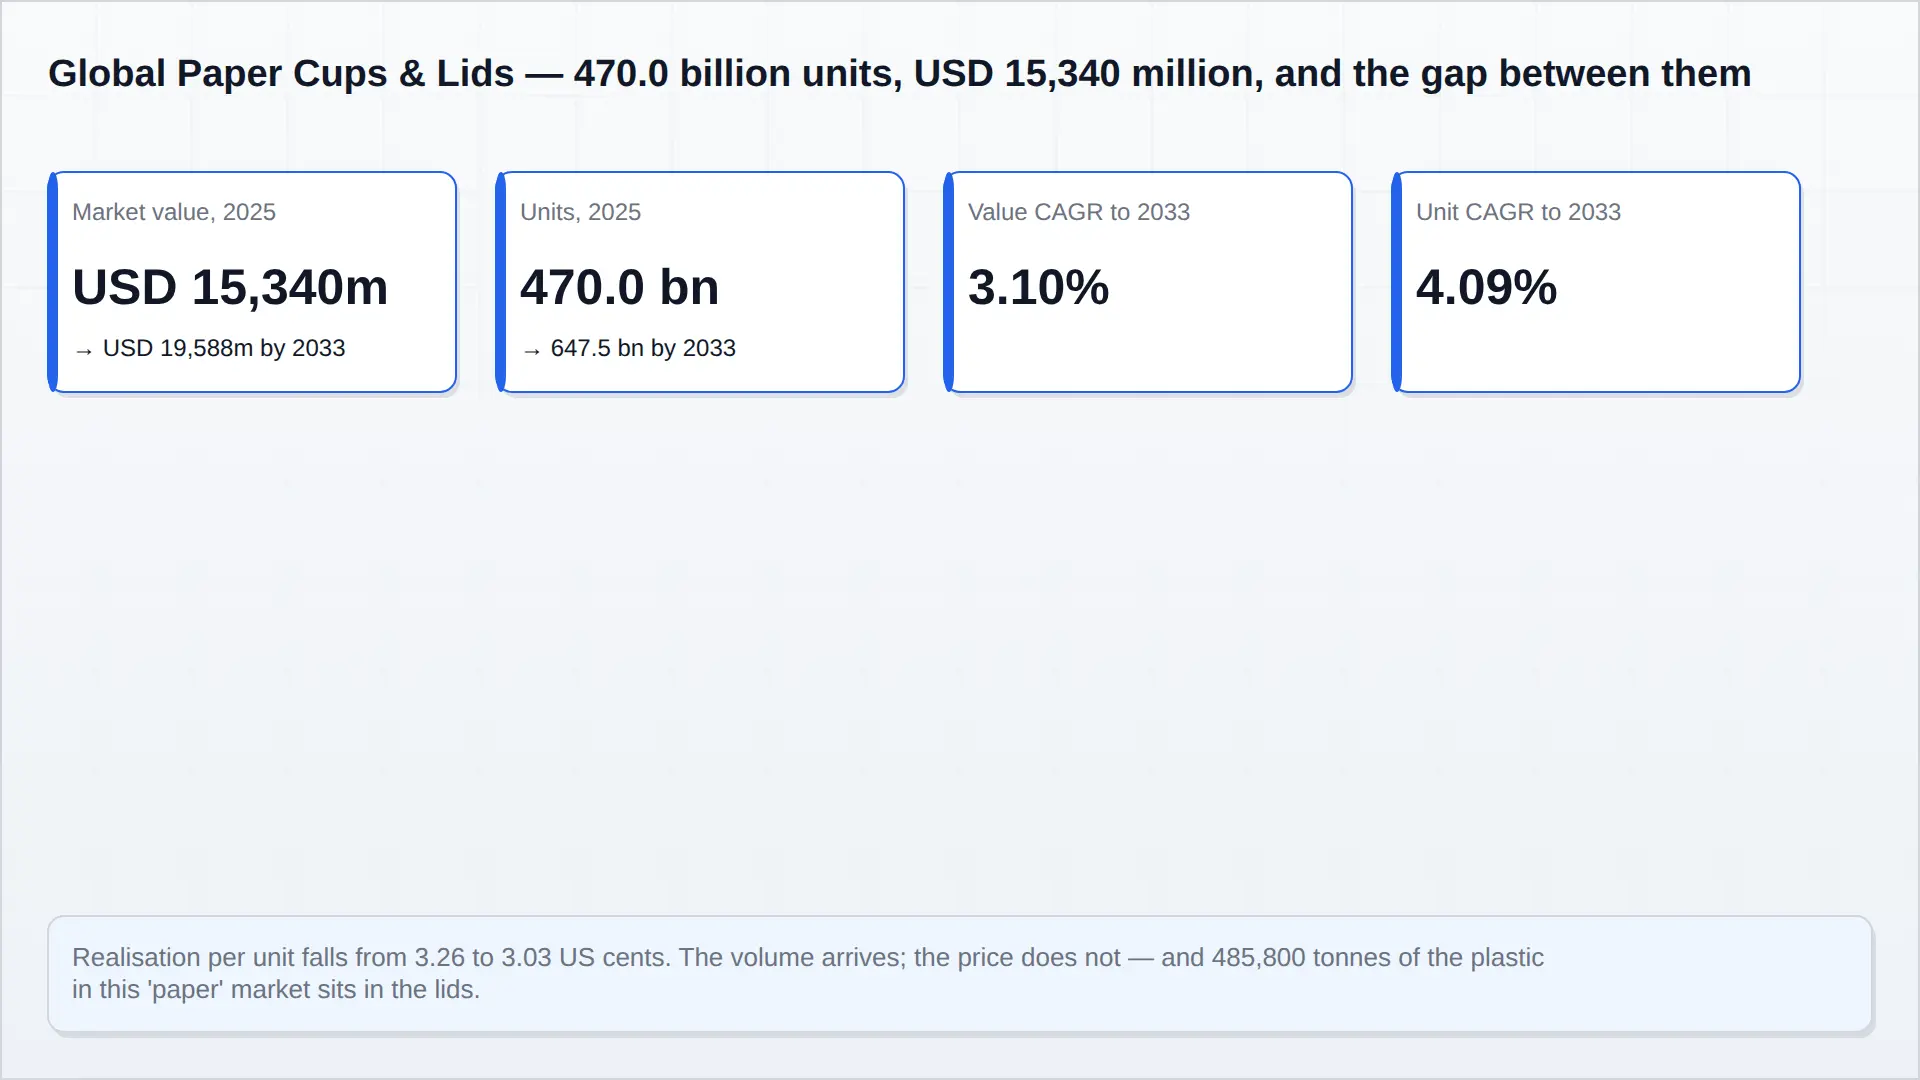
The base is a Pheonix model, and it has to be. Section five sets out the band; it is about plus or minus fifteen per cent on the level, and narrower than that on the direction, because the direction is visible in three sets of published accounts.
Articles on this market
- A Paper Cup Line Costs USD 2 Million and Repays in 8.4 Years at 4.60 Cents. At 1.70 Cents It Takes 22.7
- The Lid Is a Third of the Units, a Sixth of the Value and Four-Fifths of the Plastic
The substitution reached the cup and stopped at the lid
Something real happened to the paper cup between 2016 and 2026, and it is the most under-reported good news in packaging. In 2015–16 a study commissioned by the Sustainable Packaging Coalition and the Foodservice Packaging Institute, and carried out by Resource Recycling Systems, found that 5 per cent of the US population had residential recycling access that accepted paper cups. In May 2026 the same body put that figure at 20 per cent — four times in a decade. The number of North American mills accepting cups went from four in 2017 to 35 today, which the FPI describes as 75 per cent of North American mixed-paper demand. The polycoat lining was the objection; the mills re-engineered around it.
The barrier chemistry moved at the same time. Polyethylene extrusion coating — the layer that made a cup waterproof and unrecyclable in the same breath — is being replaced by aqueous dispersion coatings that repulp in the existing stream. And the US grease-proofing chemistry that made fibre foodservice possible at all was withdrawn outright: the FDA confirmed in February 2024 that PFAS-containing grease-proofing agents were no longer being sold into the US market, and in January 2025 published notice that 35 food-contact notifications were no longer effective. A converter formulating a barrier in 2026 has no PFAS option and, increasingly, no polyethylene option either.
Then the transition stops.
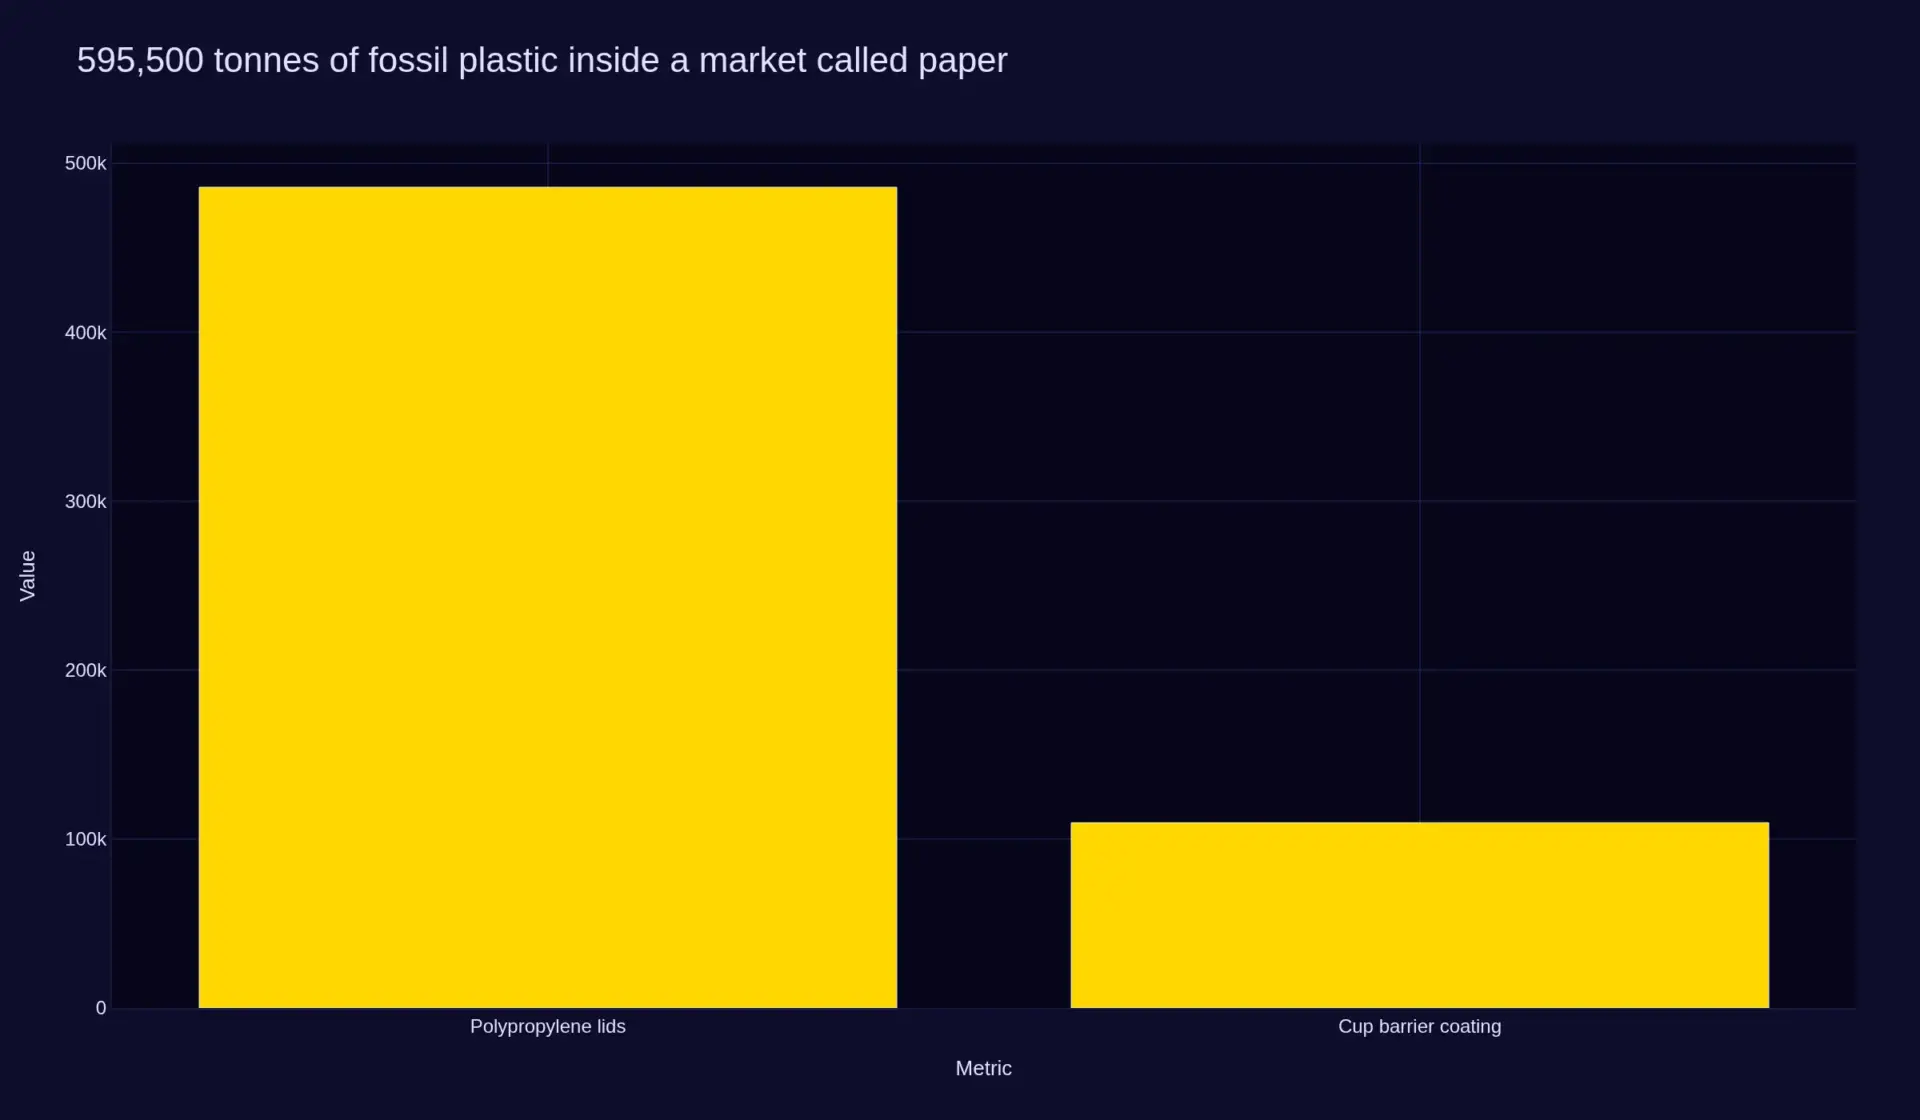
A hot cup and its lid weigh about fourteen grams together. Roughly 10.5 grams is board, 0.35 grams is coating, and 3.1 grams is a moulded polypropylene lid. By mass, a quarter of the set is fossil plastic, and nine-tenths of that plastic is the lid. Scale it: at 156.7 billion lids in 2025, the closure layer alone consumes 485,800 tonnes of plastic a year, against 109,700 tonnes in cup coatings. 595,500 tonnes of fossil plastic sit inside a market defined by the word paper, and 82 per cent of it is in the lid.
Fibre lids exist. They are not theoretical: Hesburger and Huhtamaki rolled out fibre covers across soft-drink and hot-beverage cups in 2026, a change the chain expects to remove 41,000 kilograms of plastic a year — about thirteen million lids. That is a real programme and a real number, and it is also 0.008 per cent of the plastic in the closure layer. The technical constraint is not the material; it is the seal, the snap-fit and the drink spout surviving hot liquid without leaking. Until those clear at speed, the cup goes fibre and the lid does not.
The money, told by two segments that do report
Two disclosures bracket the industry’s economics, and both moved the same way in 2026.
| Segment | Measure | 2026 | Comparable |
|---|---|---|---|
| Graphic Packaging — Americas Paperboard Packaging | Net sales, Q3 | USD 1,476 m | USD 1,474 m |
| Income from operations, Q3 | USD 132 m | USD 222 m | |
| Operating margin, Q3 | 8.94% | 15.06% | |
| Operating margin, nine months | 8.40% | 14.28% | |
| Huhtamaki — Foodservice Packaging | Net sales, H1 | EUR 445.5 m | EUR 473.2 m |
| Adjusted EBIT margin, H1 | 8.3% | 9.0% | |
| Adjusted EBIT margin, 2024 | 9.2% | ||
Revenue flat, operating income down 40.5 per cent. And the decomposition of Graphic Packaging’s two-million-dollar quarterly increase is the whole industry in one line: volume/mix +1 per cent, or USD 19 million; price −1 per cent, or USD 15 million. They are passing deflation through and buying volume to stand still.
That is a mix problem before it is a price problem, and mix is what a market-size report cannot see. Which is why this one is built at the unit.
Demand is geographic, not per-capita
US food spending reached USD 2.51 trillion in 2025, of which USD 1.41 trillion — 56.3 per cent — was spent away from home, on USDA Economic Research Service figures. That is the demand pool, and it is not growing in units the way it grows in dollars. In constant dollars, total food spending rose from USD 2.49 trillion to 2.51 trillion between 2024 and 2025 — under one per cent. Price is carrying the nominal growth.
The consequence for a cup maker is direct and uncomfortable: in mature markets the units are flat, so growth has to come from somewhere else. It comes from three places — cold beverages displacing hot, lids becoming universal where they were optional, and volume migrating to Asia, Latin America and Africa where the cup is still being adopted rather than replaced. All three are lower-realisation than the business they replace. That is the arithmetic behind a 4.09 per cent unit rate and a 3.10 per cent value rate.
The rulebook hardened without anyone passing a cup law
No jurisdiction has banned the paper cup. What has happened is more consequential: seven US states now operate packaging producer-responsibility statutes — California, Colorado, Maine, Maryland, Minnesota, Oregon and Washington — and their fee schedules are modulated by recyclability and recycled content. Oregon’s producer-funded system went live in July 2025; California’s regulations took effect on 1 May 2026, with a draft producer-responsibility organisation plan filed in June and compliance milestones from 2027; Washington’s producers must be in a producer-responsibility organisation from 2026.
In Europe, Regulation (EU) 2025/40 sets recyclability performance grades from 2030 and requires packaging to be recyclable at scale from 2035, mandates modulated producer fees, and from 1 January 2030 requires final distributors of alcoholic and non-alcoholic beverages to ensure at least 10 per cent of those products are made available in reusable packaging, rising to 40 per cent by 2040, with a sales-area exemption below 100 square metres. The Commission’s guidelines defining exactly which products fall inside that target are due by 12 February 2027 — which is the date the reusable question actually resolves.
The asymmetric detail is the one worth carrying away. The fibre cup is heading toward fee-scheduled recyclability with 20 per cent household access and 35 end markets behind it. The plastic lid faces recycled-content obligations with almost no food-grade recycled polypropylene supply to meet them. The two halves of the same product are being regulated in opposite directions, and only one of them is prepared.
What this report contains
- Competitive landscape — the fragmentation arithmetic, the two disclosed segments that bracket the industry’s margin, and why no tier-one player can exist in a business bought at cents per thousand.
- Value chain — the board-to-counter stack priced per thousand units, why the lid is the most valuable item per gram in the set, and where the margin leaks.
- Technology and innovation — the barrier transition from polyethylene to aqueous dispersion, the PFAS exit, why fibre lids fail at the seal rather than the material, and the rotation arithmetic that governs reusables.
- Investment activity — the capex collapse at the incumbents, the Novolex–Pactiv consolidation trade, and where capacity is actually being added.
- Market risk — the scenario band, what one per cent is worth, four risks that can break the base, and the three observations that would falsify it.
- Regulatory landscape — the seven state regimes with dates, the EU’s 2030 and 2035 thresholds, and the lid’s recycled-content problem.
How to read this
This report is written at converter realisation — what the converter books for the finished item, before distributor margin and before the operator’s logistics — because that is the only price a cup maker controls. A cup that costs four cents to a distributor is a different product from a cup that costs eight cents to a restaurant, and mixing the two is how industry estimates end up an order of magnitude apart.
The unit basis is not a flourish. A cup is bought as a cup, against a contract that specifies a price per thousand and a delivery window, and the plant that makes it is measured in cups a minute. Forecasting this market in dollars alone hides the only variable that management can actually move.
The research basis is set out in the methodology field: roughly 70 per cent secondary and 30 per cent primary — converter and distributor conversations, conference-floor pricing, and structured interviews with operators and buyers, used to establish mechanism and direction rather than to carry magnitude. Every magnitude in this report traces to a published filing, a government statistic or an arithmetic step that is shown.
Table of Contents
Contents
Seven sections. Each one states what it establishes, so a reader can go directly to the section that answers the question in front of them. The forecast rests on two numbers that move in different directions — 4.09 per cent on units and 3.10 per cent on value — and each section below is a test of one of them.
| Section | What it establishes | Test it applies |
|---|---|---|
| 1. The largest packaging product in the world that no company reports | Definition, exclusions, the 2025 base of 470.0 billion units and USD 15,340 million, the cup and lid split, the regional structure and the band around the estimate | What is counted, how much of it there is, and how wrong the base could be |
| 2. Competitive landscape | Why 5,439 line-equivalents produce no champion, and what the two disclosed seats actually earn | Whether any supplier can hold price |
| 3. Value chain | The 3.26 cents between a board tonne and a counter, and who takes each part of it | Where the margin actually sits |
| 4. Investment activity | The two-million-dollar line, the payback arithmetic that decides where it goes, and the capacity being built against it | Where capacity will be added, and by whom |
| 5. Technology and innovation | Barrier layers, the fibre lid, coat weight against legal definition, and the 95 per cent fibre threshold | Whether the mix path in the forecast is physically buildable |
| 6. Market risk | Three scenarios, the sensitivity of each variable, four risks that break the base case, and three falsifiers | What would prove this report wrong, and how quickly |
| 7. Regulatory landscape | The EU packaging regulation and the single-use plastics directive, seven US state EPR regimes, the PFAS exit, and the cup recycling access curve from 5 to 20 per cent | Whether the pricing half of the forecast is legislated or aspirational |
At a glance
| Measure | 2025 | 2033 | CAGR |
|---|---|---|---|
| Value, converter realisation | USD 15,340 m | USD 19,588 m | 3.10% |
| Volume | 470.0 bn units | 647.5 bn units | 4.09% |
| Realisation per unit | 3.26 US cents | 3.03 US cents | −0.94% |
| Scenario band, 2033 | USD 16.7 bn – 22.5 bn | — | |
How to read the split. The unit forecast is a bet on foodservice traffic and on the cup holding its share of the hot and cold serve; it can be checked quarterly against restaurant transaction counts, distributor case volumes and cup recycling access. The value forecast is a bet on price holding as fibre capacity arrives; it can only be checked against realised converter prices and the composition of the lid layer. A reader who accepts the first and rejects the second should use 4.09 per cent and treat the remaining 0.99 points as a mix outcome rather than a revenue one.
Competitive Landscape
Competitive landscape
This is a fragmented market in the strict sense, and the arithmetic is unusually clean. The world makes 313.3 billion paper cups a year. A modern cup machine runs at roughly 160 cups a minute, three shifts, 6,000 productive hours a year — 57.6 million cups. Divide one by the other and the entire global cup layer fits on about 5,440 line-equivalents. A market that fits on five thousand machines does not produce a dominant supplier, and it has not.
The disclosure problem hides this. Not one listed converter reports cup revenue, so every published share estimate for this market is an attribution dressed as a measurement. What can be said with confidence is narrower and more useful: on the disclosed segments, the two largest Western converters each account for somewhere between two and six per cent of the global pool, and the balance is spread across several thousand converters in China, India, Vietnam, Turkey, the Gulf, Eastern Europe and Latin America, most of them single-site and unlisted.
The two disclosures that bracket the industry
Graphic Packaging International and Huhtamaki are the only listed converters whose reporting reaches the cup, and neither reports it directly. Their segments are the best available proxy, and both contracted in 2026.
| Participant | Disclosed segment | 2026 net sales | Margin | Prior-year margin |
|---|---|---|---|---|
| Graphic Packaging | Americas Paperboard Packaging | USD 4,427 m (nine months) | 8.40% operating | 14.28% |
| Huhtamaki | Foodservice Packaging | EUR 445.5 m (first half) | 8.3% adjusted EBIT | 9.0% (9.2% in 2024) |
| Novolex, including Pactiv Evergreen | Not disclosed post-close | Transaction valued at USD 6.7 bn including net debt | Not disclosed | Not disclosed |
| Dart Container | Private | Not disclosed | Not disclosed | Not disclosed |
Read the two margins as the same story told at two companies. A business converting board into a cup, and polypropylene into a lid, is running at eight to nine per cent operating margin when it was running at fourteen to fifteen a year earlier. Huhtamaki also booked a EUR 16 million impairment inside Foodservice Packaging in the second quarter of 2026, explicitly tied to production footprint optimisation — the accounting term for closing capacity that is not needed.
What competition actually turns on
Five variables, none of them proprietary, and the ranking matters more than the list.
- Board buying. Cupstock is 38 to 41 per cent of realisation and it is a globally traded commodity. A converter with a mill relationship and a basis-weight discipline buys the same tonne cheaper than one without, and the difference exceeds the entire operating margin.
- Utilisation. A cup line is a fixed cost with a variable output. The plant running 85 per cent is a different business from the plant running 60, and in a market growing 4 per cent in units there is no rising tide that rescues the second.
- Print. The only visible differentiation on a shelf that nobody shops. Print quality is how a distributor defends a price on an unbranded cup.
- Freight. Cups ship as air. A nested pallet of 12-ounce cups is mostly void, and the delivered cost is set by distance in a way that makes regional plants durable.
- Lid fit. The least discussed and the most commercially decisive. A lid that leaks on a chain’s cup is not a cheaper lid; it is a rejection, and the qualification cycle to replace it runs to quarters.
The buyer is more concentrated than the seller
Supply is fragmented. Demand is not. A handful of quick-service and coffee chains specify the cup nationally, lock the specification to a fixed unit cost, and put the volume out to a small number of qualified converters. Between them sits the broadline distributor, which is the actual gatekeeper for everyone who is not a national account: it takes the margin on the small operator, it decides what appears in the catalogue, and it increasingly carries its own brand of cup made by whoever will run it cheapest.
That asymmetry — fragmented supply selling into concentrated demand, with an intermediary that owns the route to market — is a margin structure. It is not the converter’s margin. And it explains the price line in Graphic Packaging’s third quarter: net sales up USD 2 million on volume and mix up 1 per cent, or USD 19 million, and price down 1 per cent, or USD 15 million. The volume was bought with price, at a moment when commodity input and operating cost inflation added USD 83 million to the cost line.
Why no tier-one player can exist here
Three conditions create national or global champions in packaging, and the cup has none of them. Feedstock is not owned: cupstock comes from merchants and integrated mills, so nobody can secure input on terms a rival cannot match. The machine is bought, not invented: a cup line is a capital purchase available to any converter with a bank facility, at USD 1.5 to 3 million. And the customer specifies to a price, not to a system, so there is no installed base to lock in.
Compare that with a market that does consolidate — in vitro diagnostics, where the instrument is placed and the reagent annuity follows for a decade. A cup is the opposite: a consumable bought per thousand with no captive aftermarket. Consolidation here therefore happens for distribution and substrate breadth, not for share of a product. That is precisely the logic of the Novolex and Pactiv Evergreen combination, and it is why the combined company’s disclosed assets are more than 250 brands and 39,000 SKUs across one of the most diverse substrate sets in the industry rather than a larger cup line.
The one structural advantage, and how long it lasts
Vertical integration into board. A converter that owns or has a contracted mill can defend a spread through a board cycle, and in a year when board rose and price fell, that is the only defence available. Huhtamaki’s fibre investment and Graphic Packaging’s mill system are the two clearest examples, and both are being held back by deleveraging rather than by strategy — Graphic Packaging’s net debt stood at USD 5,183 million with net leverage at 4.8 times against 3.8 at the start of the year.
Every other advantage in this market is temporary. That is not a criticism of the participants; it is the structure they operate in, and it is why the fight has moved from share of cups to share of the substrate decision. The Global Packaging Market 2026–2033 sets out the wider board cycle this market inherits, and the Europe Monodose Packaging Market shows the same fragmentation arithmetic at work in a far smaller format.
Value Chain
Value chain
Six stages sit between a standing tree and a hand holding a coffee, and the money is not distributed evenly across them. Priced at the blended 2025 realisation of USD 40.31 per thousand units, this is what a hot cup actually costs.
| Stage | Who | USD per 1,000 | Share of realisation | Margin character |
|---|---|---|---|---|
| Cupstock board, 14 kg at about USD 1,150/t | Board mills — Clearwater, Stora Enso, Billerud, integrated GPI | 16.10 | 39.9% | Cyclical, commodity, globally priced |
| Barrier coating, 0.5 kg | Resin suppliers, dispersion coaters | 0.75 | 1.9% | Chemically priced, small share, high technical leverage |
| Print and ink | Converters, specialist printers | 1.30 | 3.2% | The only visible differentiation |
| Forming — labour, energy, depreciation, tooling | Converters | 5.50–6.50 | 13.6–16.1% | Utilisation-driven |
| Packaging and handling | Converters | 1.60 | 4.0% | Volume-driven |
| Outbound freight | Converters, third-party logistics | 1.80 | 4.5% | Distance-driven; cups are air |
| Waste, startup, quality | Converters | 1.20–1.45 | 3.0–3.6% | The quietest leak in the business |
| Selling, general and administrative | Converters | 7.20–7.80 | 17.9–19.4% | The largest controllable line |
| Operating margin | Converters | 2.60–4.80 | 6.5–11.9% | Reconciles to the 8.4–8.9% the disclosed segments report |
Cost shares are Pheonix estimates for a 12 to 16 ounce hot cup set at US realisation, built from board basis weight, resin price and observed conversion economics. They are not transaction data, and no converter publishes a cost stack. The table’s purpose is not precision; it is to show that board is four-tenths of the price and the converter does not set it.
What that means in dollars
Two numbers follow. Board is USD 16.10 of every thousand cups sold, or about 1.6 cents a cup — against a realisation of 4.03 cents. Everything the converter actually controls, from coating through freight, is roughly USD 12 a thousand, of which the genuinely discretionary portion is smaller still, because depreciation on a machine and wages on a shift do not flex with price.
This is why the industry’s response to a two-hundred-basis-point margin loss is never one thing. It is basis weight down a gram, print setup waste down a point, a line consolidated out, a distributor term renegotiated — four savings that each look like rounding and together are the margin.
The lid is a different business
Here is the arithmetic that explains why the substrate transition stopped where it did. An injection-moulded polypropylene lid weighs about 3.1 grams. Polypropylene at USD 1,100 a tonne makes the resin in that lid 0.34 US cents. The lid realises 1.73 cents. Material is 20 per cent of the price of a lid against 40 per cent for a cup.
| Cup | Lid | |
|---|---|---|
| Realisation per unit | 4.03 US cents | 1.73 US cents |
| Material share of price | about 40% | about 20% |
| Dominant process | Forming, printing, sealing | Injection moulding, tooling, cycle time |
| Unit growth to 2033 | 3.41% | 5.35% |
| Realisation direction | −0.26% a year | −2.32% a year |
A lid is a converting business rather than a material pass-through, and that has two consequences that cut in opposite directions. It is the more defensible half of the set, because the value is in the tool and the fit rather than the gram. And it is the half that has not moved to fibre, because the value being defended is a seal and a snap, not a fibre source. Section four takes that further.
Who takes the money, stage by stage
- The mill takes a commodity margin on board, which is cyclical and currently supported by fibre tightness. It carries no specification risk on the cup.
- The converter takes a spread of about 6.5 to 11.9 per cent, in which the entire variance of the industry sits. It carries the tooling, the customer qualification and the working capital.
- The distributor takes a margin on every operator who is not a national account, and owns the catalogue and the credit. In the small-operator channel it is the price-setter, not the converter.
- The operator pays 8 to 12 cents a cup delivered, against a ticket that may be eight dollars, and treats it as a rounding item until a fee schedule or a chain standard makes it a visible line.
That last point is the commercial opening for anyone selling into this market. A cup is 0.15 per cent of the ticket. It becomes a management subject only when the cost of the cup is no longer a cup cost — when a producer-responsibility fee, a recyclability grade or a chain-level substrate mandate attaches to it. See the Europe PFAS-Free Food Contact Packaging Market 2026–2033 for the barrier side of that shift, and the Peru Thermoformed Packaging Market for a worked example of a single dated prohibition moving a whole format.
Where the chain leaks value
- Basis weight tolerance. A gram of excess board on a 14-gram cup is 7 per cent of the board bill, invisibly spread across millions of units. It is the single largest recoverable sum in a cup plant and the hardest to see on a per-unit price.
- Print setup waste. Short runs and long changeovers are the economics of a market where every chain wants its own cup. Digital print reduces the waste and raises the cost per unit; the correct answer depends entirely on run length.
- Lid rejects. A lid that does not seal is scrap at the customer, not at the plant, and the cost of a recall on a chain’s beverage programme is not measured in lids.
- Freight on void. A pallet of nested cups is mostly space. Serving a distant market from a central plant is a structural penalty, and it is why the industry built regional plants long before it built global ones.
Investment Activity
Investment activity
The most important fact about capital in this industry in 2026 is that the incumbents have stopped spending it.
| Company | Measure | 2024 | 2025 | 2026 |
|---|---|---|---|---|
| Graphic Packaging | Capital expenditure | USD 1,203 m | USD 935 m | Guided below USD 450 m |
| Adjusted cash flow | Guided USD 600–700 m against USD 169 m in 2025 | |||
| Net leverage | 3.8× at year-end 2025 | 4.8× at 30 September 2026 | ||
| Huhtamaki | Capital expenditure, first half | EUR 73.2 m (H1 2025) | EUR 171.9 m (full year) | EUR 53.4 m |
| Foodservice impairment | EUR 16 m, footprint optimisation | |||
The capex fall is not a signal of a company losing faith in cups. It is the arithmetic of a completed build programme meeting a debt wall. Graphic Packaging finished Waco — a project of roughly USD 1.67 billion — and is now converting capital spending into cash flow and deleveraging, with the explicit guidance that adjusted cash flow moves from USD 169 million to USD 600–700 million while capex goes below USD 450 million. Huhtamaki’s EUR 16 million Foodservice impairment is the same message from the other direction: capacity being taken out, not put in.
For anyone buying or selling in this market, the consequence is straightforward. There is no incumbent adding cup capacity in the West in 2026, which means any volume that shifts will be absorbed by the converters already holding it.
The payback arithmetic that decides where capacity goes
A cup line costs USD 1.5 to 3 million installed, and at 160 cups a minute over 6,000 hours it makes 57.6 million cups a year. Run that against the two ends of the realisation ladder and the geography of capacity becomes obvious.
| Mature market | Low-income market | |
|---|---|---|
| Installed cost of a line | USD 2.0 m | USD 2.0 m |
| Annual output | 57.6 m cups | 57.6 m cups |
| Realisation per cup | 4.60 US cents | 1.70 US cents |
| Annual revenue per line | USD 2.65 m | USD 0.98 m |
| Operating margin assumed | 9% | 9% |
| Annual operating profit | USD 238,000 | USD 88,000 |
| Simple payback | 8.4 years | 22.7 years |
Same machine, same speed, different world. The line that pays back in eight years in Ohio does not pay back at all in a market realising 1.70 cents unless the board, the labour and the capital cost all fall with the price — which is precisely what happens in the markets where the capacity is actually being added. The conclusion is not that low-income markets are bad; it is that capacity there is built by local converters with local input costs and often second-hand machines, not by Western converters exporting a business model.
Where the capacity is going instead
- Asia, for domestic demand. Indian, Vietnamese, Indonesian and Chinese converters adding lines against local beverage and QSR growth, at lower capital intensity and lower specification.
- The Gulf and Turkey, for export. Board import, cheap energy, freight access to Europe and Africa — the classic position for a low-cost converter serving a high-cost market.
- Fibre lids and formed fibre. The one place Western capital is genuinely being deployed: converting assets and tooling for pulp-formed closures, because the closure is where the regulation is heading and where nothing yet works at scale.
- Recycling and fibre recovery. Mills investing in the separation technology that turned four end markets into 35. This is upstream capex that shows up in the cup’s recyclability claim rather than in its price.
The consolidation trade
Novolex completed its combination with Pactiv Evergreen on 1 April 2025, in a transaction valued at approximately USD 6.7 billion including net debt, at USD 18.00 a share — a 49 per cent premium to the two-month unaffected volume weighted average price. The combined company carries more than 250 brands and 39,000 SKUs across what it describes as one of the most diverse substrate sets in the industry.
That is a distribution and substrate play, not a cup-share play. Its logic is that the customer is a foodservice operator who wants one supplier for cups, containers, cutlery and bags, and that a supplier who can offer paper, moulded fibre and plastic can follow the customer whichever way a fee schedule pushes them. It is the only strategy in this market that answers the substitution question instead of betting on one side of it.
The Global Cement Packaging Market and the Global FIBC & Bulk Bags Market show the opposite structure — fragmented converters, no consolidation logic, and the same absence of a tier-one player — which is a useful control when judging whether foodservice is genuinely different or merely earlier in the cycle.
Technology & Innovation
Technology and innovation
Almost nothing in a paper cup is new. The machine, the board and the seam are all decades old, and the innovation that matters is happening in a two-to-four gram layer on the inside of the wall and in the closure on top. That is where the entire technical contest now sits.
The barrier, which is the whole game
A cup has to hold hot liquid for twenty minutes without wicking through the seam, without delaminating at the rim, and without tasting of anything. Polyethylene extrusion coating has done that job since the 1960s, applied at 12 to 18 grams per square metre, and it is the reason a paper cup was historically unrecyclable: the plastic is fused to the fibre and the repulping system had to be taught to separate it.
| Barrier route | Coat weight | Recyclability in the paper stream | Constraint |
|---|---|---|---|
| Polyethylene extrusion | 12–18 g/m² | Requires mills configured to separate the lining | Incumbent; cost-effective; the recycling objection |
| Aqueous dispersion | 2–4 g/m² dry | Repulps in the standard stream | Seam strength and hot-liquid performance at the rim |
| PLA and bio-based film | 15–20 g/m² | Industrial compost only in practice | Heat tolerance, cost, and no collection system |
| Water-based acrylic hybrid | 3–6 g/m² | Repulps; food-contact clearance per formulation | Cost and line conversion speed |
The direction is one-way. Aqueous dispersion is winning because it solves the recyclability objection at a lower coat weight, and because the mills did the other half of the work: North American end markets accepting paper cups went from four in 2017 to 35 today, which the Foodservice Packaging Institute describes as 75 per cent of North American mixed-paper demand. A coating that only works if nobody accepts the cup is a coating with a shortening life.
There is a trap in that migration, and it is the most commercially important technical point in this report. An aqueous acrylic dispersion is still a polymer, and under the definition used in the EU Single-Use Plastics Directive it is treated as plastic — which means a cup marketed as plastic-free may in law be a plastic-coated cup, carrying the marking, and the fee band, that follow from that classification. As our own analysis of the coating layer sets out in The Cup Is Five Products, Huhtamaki states the position directly, and specifies its lower-plastic board to reach a minimum of 95 per cent fibre content by product weight — less than 5 per cent polymer — on the argument that this uses less polymer than an acrylic dispersion while remaining repulpable in existing cup waste streams.
So the contest is not chemistry against chemistry. It is coat weight against legal definition, and the two are decided in different rooms. A converter who specifies a barrier without knowing which side of the plastics definition it falls on has not made a technical choice by accident; he has made a regulatory one, and it will appear in his producer-responsibility fee before it appears in his performance data.
What the PFAS exit actually changed
Grease resistance is a different problem from water resistance, and it was solved with fluorochemistry. That solution no longer exists in the United States. The FDA confirmed in February 2024 that PFAS-containing grease-proofing agents were no longer being sold into the US market, and in January 2025 gave notice that 35 food-contact notifications for those substances were no longer effective.
For a coffee cup this is a second-order event; a cup holds a liquid, not a fried product. For the food container it is first-order, and it is why the fibre clamshell and the fibre tray spent 2024 to 2026 reformulating. The consequence that reaches the cup is indirect and more important: every fibre format in the foodservice set now competes on a barrier platform, and the platform is shared. A converter who has qualified a PFAS-free grease barrier has most of the chemistry needed for a fibre lid.
Forming: where speed is set
A cup line blanks a fan from board, wraps it around a mandrel, heat-seals the side seam, forms and seals the bottom, and curls the rim — at 100 to 250 cups a minute. The variables that matter commercially are not the speed on the brochure. They are the seam consistency at the bottom, where leaks originate; the rim curl, where the lid grips; and changeover time, because a market that wants every chain’s own print pays for changeovers more than it pays for cycle time.
Ultrasonic sealing against heat-seal is the live process choice: ultrasonic gives a stronger seam on coated board with less heat history, which matters more once the coating is an aqueous dispersion rather than polyethylene. It is a machine retrofit, not a chemistry decision, and it is the kind of capital item that gets deferred in a year like 2026.
The lid, and why fibre stops there
A lid is injection moulded from polypropylene, in tools of 2 to 8 cavities, and its specification is entirely functional: it must snap onto a rim with a defined interference, hold pressure without leaking, survive a straw, and vent steam without spitting. Fibre is technically capable of all of that and commercially capable of very little of it at speed.
The proof of concept exists. Hesburger and Huhtamaki rolled out fibre covers across soft-drink cups and medium and large hot cups in 2026, developed to withstand both heat and moisture, with a redesigned lid adapter and spout to hold the cup and reduce leakage, and the chain expects the change to remove 41,000 kilograms of plastic a year — about 13.2 million lids at 3.1 grams each. It is a genuine programme and the best-documented fibre lid deployment in the market.
It is also a fraction of one per cent of the plastic in the global closure layer. The gap is not a materials gap. It is the cost of qualifying a seal on every cup diameter a chain runs, and the line-speed penalty of a formed-fibre lid against a moulded plastic one.
Reusables: the arithmetic that decides it
A reusable cup is not a packaging substitution; it is a logistics system with a washing plant attached. It only pays back environmentally and financially above a threshold number of rotations generally placed between 50 and 100, which means the system has to guarantee return rates that a deposit scheme can achieve and a voluntary scheme cannot.
That is why the European obligation is written as it is. Regulation (EU) 2025/40 requires final distributors of beverages to ensure at least 10 per cent of products are in reusable packaging from 2030, exempts sales areas below 100 square metres, and allows pooling. A pooled system across a city solves the return-rate problem; a single café’s own cup does not. The realistic outcome is reusables taking a mid-single-digit share of beverage occasions in dense Northern European cities and close to nothing elsewhere.
What is not moving the market
- Compostable cups. Technically competent, commercially stalled: no collection infrastructure exists at the scale that would justify the premium, and industrial composting is not available to a consumer walking out of a shop.
- Mono-material plastic cups. They solve recyclability for the plastic side of the substitution, and they compete directly with the paper cup for the cold-beverage application. This is the underrated threat, and it is discussed in the market risk chapter.
- Edible and unfilled formats. Present in the trade press, absent from the volume.
Innovation intensity in this market is moderate and patent activity low, and both assessments describe the same reality: the frontier is set by the board mills and the machine builders, and the converter’s competitive variable is qualification and utilisation rather than invention.
Market Risk
Market risk and the scenario band
Before the risks, the data problem, because it governs how much weight any of this can carry.
There is no published global cup count and no published cup revenue line anywhere in the market. The figures that circulate commercially are built on incompatible definitions — some count cups but not lids, some count foodservice containers as cups, some quote operator spend rather than converter realisation — and they diverge by a factor of two. This report therefore states its own arithmetic, shows each step, and puts a band around the result rather than a decimal point.
The band is roughly plus or minus 15 per cent on the 2025 level. That is the honest range for a base built from a per-capita unit model and a realisation ladder. The direction is much more certain than the level, because the direction is visible in three sets of published accounts: Graphic Packaging’s price and volume lines, Huhtamaki’s segment margin, and the migration of volume toward lower-realisation markets.
The three scenarios
| Scenario | Unit CAGR | 2033 units | Value CAGR | 2033 value |
|---|---|---|---|---|
| Slow | 3.0% | 595.4 bn | 2.1% | USD 18,115 m |
| Base | 4.09% | 647.5 bn | 3.10% | USD 19,588 m |
| Accelerated | 5.0% | 694.4 bn | 4.1% | USD 21,156 m |
The gap between the outer cases is USD 3,041 million on the same population and the same regulation. Nearly all of that sits in two variables — how fast Asian and African volume converts, and how far North American price falls. Both are observable quarterly, which is the point of building the forecast this way.
What one per cent is worth
| Variable | Move | Effect on the 2033 market | What it tells you |
|---|---|---|---|
| Unit volume | ±1% | ±USD 196 m | A normal year’s variance; not a threat to the base |
| Realisation per unit | ±1% | ±USD 196 m | Identical to volume — price is not where the variance lives |
| Growth path | One point high (4.1% value) | USD 21,156 m against 19,588 m — +USD 1,568 m | Eight times a one per cent price shock; the path dominates the level |
| Base year | 2025 pool 15% lower | 2033 falls proportionally to USD 16,650 m | Comparable to the growth-path miss, which is why the band is stated |
Two conclusions. First, a one-point error in the growth rate is eight times more consequential than any plausible price or volume shock, so attention belongs on the path rather than the level. Second, the base-year uncertainty and the growth-path uncertainty are of similar size — which means a reader should treat the 2033 figure as a range of roughly USD 16.7 to 21.2 billion, not a point.
Four risks that can break the base case
- Realisation collapse in North America. The base assumes realisation falls about one per cent a year. Graphic Packaging reported price down one per cent in a single quarter while commodity and operating costs rose USD 83 million. If price deflation runs at three per cent for four years, 2033 value falls by roughly USD 1.4 billion and the unit growth stops being worth having.
- The mono-material plastic cup. The most underrated substitution in this market is not fibre taking share from plastic; it is a recyclable PP or PET cup taking share from paper in cold beverages, exactly where paper has been winning. A PP cup is recyclable in a stream with far higher household access than 20 per cent, and a fee schedule that reads recyclability does not automatically favour fibre.
- Reusable mandates arriving harder than written. The EU’s 10 per cent beverage target is modest and partly exempt. A member state that implements it aggressively, or a city that mandates reusables for dine-in, takes volume out of the single-use pool faster than the base assumes — and the effect concentrates in exactly the high-realisation cities that carry the margin.
- Board availability and basis weight. Cupstock is a tight, technically demanding grade. A fibre-cost spike or a mill conversion away from cupstock compresses the 40 per cent of realisation that the converter does not control, and it cannot be passed through in a market where price is already falling.
Three falsifiers
These are the observations that would say the thesis is wrong before the market size does.
- Fibre lids qualifying at line speed on a major chain. If a global QSR moves a beverage programme to fibre closures, the closure layer’s plastic disappears faster than any forecast here assumes, and the lid’s 5.35 per cent unit growth becomes a substrate windfall for whoever owns the tool.
- Realisation per unit rising for two consecutive years in North America. That would falsify the core claim that this is a volume market with a value problem, and would mean the converters had recovered pricing power.
- Household recycling access for paper cups stalling below 25 per cent by 2028. The whole fibre-side regulatory case rests on the recyclability grade. If access stalls, the fee schedules start penalising the cup that was supposed to be the compliant answer, and the substitution reverses.
What to watch, by lead time
| Indicator | What it tells you | Lead time |
|---|---|---|
| Graphic Packaging’s price and volume lines, quarterly | Whether realisation is stabilising or compounding downward | One quarter |
| Board and cupstock price indices | Converter margin before it reaches the income statement | Weeks |
| Foodservice Packaging Institute access updates | Whether the recyclability case keeps improving | Annual |
| Commission guidelines on PPWR Article 29 | The scope of the 2030 reusable target | Due 12 February 2027 |
| Fibre lid qualification announcements | The closure transition becoming real | Two to four quarters |
Regulatory Landscape
Regulatory landscape
No jurisdiction has banned the paper cup. What has happened is more consequential for a converter: the cup has become the object of a fee schedule, a recyclability grade and a barrier rule, and those three mechanisms now decide more about its future than any product regulation could.
Seven US states, and the dates that matter
Seven states have enacted comprehensive packaging producer-responsibility legislation. They are not uniform, and the implementation dates are what a supplier actually plans against.
| State | Statute | Enacted | Operative position |
|---|---|---|---|
| California | SB 54, Plastic Pollution Prevention and Packaging Producer Responsibility Act | June 2022 | Regulations effective 1 May 2026; draft producer responsibility organisation plan filed June 2026; milestones from 2027 |
| Colorado | HB 22-1355, Producer Responsibility Program for Recycling | June 2022 | Producer participation required from 1 July 2025; dues and reporting from 2026 |
| Maine | LD 1541, Stewardship Program for Packaging | July 2021 | Producer registration and annual packaging data reporting |
| Maryland | SB 901, Packaging and Paper Products | May 2025 | Effective 1 June 2025; producer responsibility plans due 1 July 2028 |
| Minnesota | HF 3911, Packaging Waste and Cost Reduction Act | May 2024 | Rulemaking under way; performance requirements from 1 January 2032 |
| Oregon | SB 582, Plastic Pollution and Recycling Modernization Act | August 2021 | Producer-funded system operational July 2025; registration, reporting and fees in effect |
| Washington | SB 5284, Recycling Reform Act | May 2025 | Producer responsibility organisation membership from 2026; recycling reimbursement from 2030 |
The mechanism that matters is not the fee level, which is still settling. It is that every one of these regimes modulates fees by recyclability, recycled content or material composition. That converts a cup from a product with a cost into a product with a cost and a schedule, and the schedule is written on the item the customer receives.
Why the fibre side is winning the fee argument
Because the recyclability evidence improved faster than anyone expected. Residential access for single- and double-sided paper cups in the United States went from 5 per cent of the population in 2015–16 to 20 per cent in May 2026, and North American end markets accepting cups from four in 2017 to 35 today. The polycoat objection was answered by mill investment, and the Paper Cup Alliance — founded in 2018 with Clearwater Paper, Dart, Graphic Packaging, Huhtamaki, Novolex, Seda, Smurfit Westrock and Sustana among its founding members — coordinated the supply chain that made it happen.
That is the strongest regulatory asset the paper cup has. It is also fragile, because 20 per cent is still a minority of households and a fee schedule that reads access, rather than design, will price the difference.
Europe: three thresholds
Regulation (EU) 2025/40 replaces the 1994 directive and applies as a regulation, which removes the member-state variation that made the old regime so uneven. Three dates structure it.
- 2030 — recyclability performance grades. Packaging must be designed for material recycling, with a grading system from 2030 and stricter requirements from 2038.
- 2030 — re-use targets under Article 29. From 1 January 2030, final distributors making alcoholic and non-alcoholic beverages available to consumers must ensure at least 10 per cent of those products are in reusable packaging within a re-use system, rising to 40 per cent by 2040. Final distributors with a sales area of 100 square metres or less are exempt in any given year, and member states may allow pools of up to five distributors covering no more than 40 per cent of a beverage category.
- 2035 — recyclable at scale. The requirement that packaging be collected, sorted and recycled at scale becomes operative, which is the provision that decides whether a cup with 20 per cent access is compliant.
The scope question is genuinely open. Whether a cup filled at a counter is a “beverage made available in sales packaging” under Article 29 is the difference between a market facing a 10 per cent re-use target in 2030 and one facing almost none. The Commission is required to publish guidelines on the products in scope by 12 February 2027, and that document is the single most important regulatory date in this report.
The lid’s problem is the mirror image
The plastic lid faces obligations the fibre cup does not, and the worst of them is recycled content. PPWR sets minimum recycled content for plastic packaging from 2030, with a lower rate for contact-sensitive applications. Food-grade recycled polypropylene is scarce, collection of small rigid PP items is poor, and a lid is a small, contaminated, mixed-colour item that sortation systems handle badly.
So the two halves of the same product are being pushed in opposite directions. The cup is being pushed toward a fibre stream that now has 35 end markets. The lid is being pushed toward a recycled-content target with almost no feedstock. That is an argument for substitution that no converter has yet been able to act on at line speed — and it is the reason the closure is where the next round of capital and qualification will go.
Compliance cost is per SKU, not per tonne
The burden falls unevenly because it attaches to the stock-keeping unit rather than the volume. A converter running 400 cup sizes and prints carries a declaration, a migration assessment and a print approval for each; a converter running 20 carries 20. In a market where every chain wants its own cup, that is a structural cost that scales with customer count rather than with tonnes — and it is the quiet reason consolidation into distributors and broad-range suppliers keeps winning.