
Global Topical Drug Delivery Market Report, Size, Share and Forecast 2026–2033: USD 120.70 Billion of New Revenue, and the Severe End of the Disease Left the Tube
The finding
The global topical drug delivery market is USD 186.20 billion in 2025 and USD 306.90 billion in 2033: 6.45 per cent a year, USD 120.70 billion of net new revenue, and 39.33 per cent of terminal value that does not exist today.
That 6.45 per cent is not a volume figure and it is not an epidemiology figure. It is the rate that survives after two exits. The severe end of dermatology has left the tube for injectable biologics: Galderma, the largest pure-play dermatology company in the world, grew net sales 17.7 per cent at constant currency in 2025 to USD 5,207 million, and the driver was Nemluvio (nemolizumab), an injectable, at USD 452 million in its launch year, with Therapeutic Dermatology up 50.2 per cent. The mild end has left the prescription pad for the shelf: in February 2020 the US Food and Drug Administration approved diclofenac sodium topical gel 1% for over-the-counter sale as Voltaren Arthritis Pain — the first prescription-strength topical NSAID to make that switch — which moved the most commonly used topical analgesic class out of prescription pricing entirely.
What is left inside the route is the largest, most chronic and least glamorous part of dermatology and localised pain management: maintenance therapy in psoriasis, eczema and acne, barrier and fungal conditions, and the patch franchise that reaches the systemic circulation through skin. That layer grows. It does not grow at dermatology's rate, because the patients who generate the most revenue per head have already left it.
Headline figures
| Measure | Value |
|---|---|
| Base year (2025) | USD 186.20 billion |
| Forecast year (2033) | USD 306.90 billion |
| Net addition, 2025–2033 | USD 120.70 billion |
| Multiple | 1.65× |
| CAGR, 2026–2033 | 6.45% |
| Share of 2033 value that is new revenue | 39.33% |
| Average annual increment | USD 15.09 billion |
| First step (2025→2026) | USD 12.00 billion |
| Final step (2032→2033) | USD 18.58 billion |
| Attribute | Reading |
|---|---|
| Coverage | Global |
| Currency and unit | USD, billion, value only |
| Market structure | Fragmented |
| Competitive intensity | High |
| Tier-1 players profiled | 10 |
| Largest formulation class | Semi-solid (creams, ointments, gels, lotions, foams) |
| Fastest-growing formulation class | Transdermal patches |
| Largest region | North America |
| Fastest-growing region | Asia Pacific |
The arithmetic, held in dollars rather than in per cent
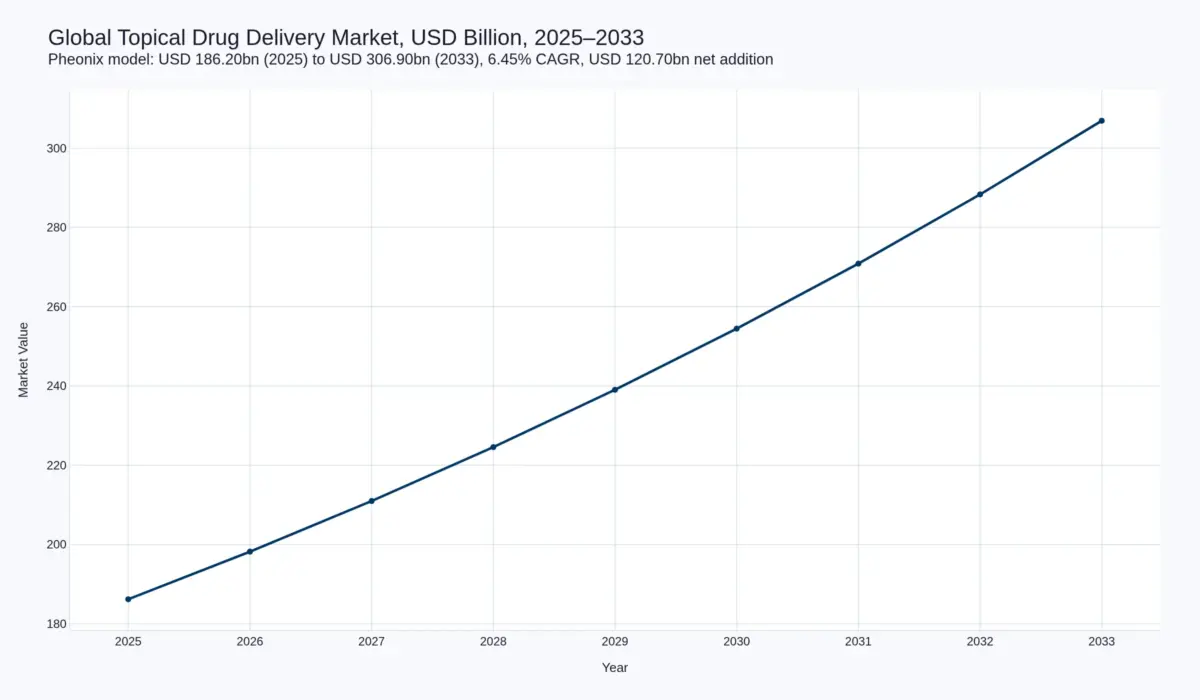
A compound rate hides the thing a supplier actually has to plan against: how much revenue has to be found in each individual year. Held in dollars, the curve is back-loaded.
| Year | Market value | Increment vs. prior year |
|---|---|---|
| 2025 | 186.20 | — |
| 2026 | 198.20 | 12.00 |
| 2027 | 210.98 | 12.78 |
| 2028 | 224.58 | 13.60 |
| 2029 | 239.05 | 14.47 |
| 2030 | 254.46 | 15.41 |
| 2031 | 270.86 | 16.40 |
| 2032 | 288.32 | 17.46 |
| 2033 | 306.90 | 18.58 |
The first step adds USD 12.00 billion; the last adds USD 18.58 billion. Eight years are therefore not eight equal years: one weak year in 2032 costs more than the whole of 2026's growth, and the average increment of USD 15.09 billion a year has to be re-earned annually in new prescriptions, new over-the-counter switches and new patches.
Scale test: nobody owns this market, and nobody is close
Galderma's USD 5,207 million of 2025 net sales — the entire company, across injectable aesthetics, dermatological skincare and therapeutic dermatology — is 2.80 per cent of the USD 186.20 billion this report sizes. No participant holds a double-digit share of the route, and no participant holds a share that would let it set price across it. The remainder of the pool is thousands of finished-dose products: store-brand hydrocortisone, generic clobetasol, prescription calcipotriol, compounded creams, and a long tail of branded formulations with single-digit shares.
That is why this report describes the structure as fragmented rather than consolidated, and why the short tier-1 list in the competitive chapter should not be read as concentration. The list is short because brand scale in topicals is short.
What this number is, and what it is not
Scope. This report sizes finished-dose drug products administered by the topical route: semi-solid formulations (creams, ointments, gels, lotions, foams), liquid formulations (solutions, suspensions, sprays) and transdermal patches, applied to skin or to integumentary and mucosal surfaces including ophthalmic, otic, nasal, vaginal and rectal applications. It excludes injectables, oral solids, pulmonary inhalers, and cosmetic products that carry no drug claim.
Scope matters more here than in most markets. Published third-party estimates for the phrase "topical drug delivery market" differ by more than a factor of two, because some include dermocosmetics, some count only prescription products, and some treat transdermal patches as a device category rather than a drug delivery route. The Pheonix model takes the finished-dose product as its unit and puts a value on the route, not on the molecule. A reader comparing this figure against another published figure should establish their scope before concluding that either is wrong.
Value only. The model carries no unit, tonnage or prescription-count series for this market. This report therefore ranks formulation classes and regions rather than pricing them, and it does not divide value by patient numbers to manufacture a revenue-per-patient figure that no source would support. Where the route split is described below, it is a ranking, not a set of dollar shares.
Formulation classes and regions, ranked not sized
Semi-solid formulations carry the largest share of value and remain the default vehicle for dermatological prescribing: they are cheap to make, familiar to prescribers, and supported by decades of stability data. Transdermal patches are the fastest-growing class in the model, because they are the only part of this route that makes a systemic claim and therefore escapes the dermatology pricing ceiling. Liquid formulations sit between the two: large in volume, low in unit price, and heavily genericised.
North America holds the largest regional share on branded pricing and on the depth of the over-the-counter aisle. Asia Pacific grows fastest, on diagnosis volume, on out-of-pocket dermatology care, and on the Indian and Chinese generic manufacturing base that supplies semi-solids to the rest of the world. Europe sits between the two, with member-state health-technology assessment acting directly on the branded layer.
Articles on this market
Table of Contents
- The finding, headline figures and the annual path
- Value chain: where the margin sits in a cream
- Technology and innovation: vehicles, patches and the test method
- Competitive landscape: fragmented at the top, intense in the middle
- Investment activity: capital is not the constraint
- Market risk: five ranked, and what would falsify the forecast
- Regulatory landscape: complex products and the evidence package
Competitive Landscape
Fragmented at the top, intense in the middle
This market is fragmented and its competitive intensity is high, and the two are not in tension. Fragmentation is a statement about share: the largest pure-play dermatology company in the world, Galderma, recorded USD 5,207 million of net sales in 2025, which is 2.80 per cent of a USD 186.20 billion pool. High intensity is a statement about behaviour: dozens of suppliers contest each formulation class, generic semi-solids erode on price within months of a launch, and the over-the-counter aisle competes on retail margin rather than on prescription value.
The ten participants profiled here are not ten holders of the market. They are ten distinct positions inside it.
Galderma is the pure-play reference point, and its 2025 results show where dermatology value has gone: net sales up 17.7 per cent at constant currency, but driven by an injectable rather than by the tube. Bayer brings consumer-health scale to the topical category through brands that sit on the shelf rather than on the prescription pad. Almirall and LEO Pharma represent the European dermatology specialists, whose franchises are built on corticosteroid and calcineurin histories and whose branded layer is exposed to member-state pricing pressure. Bausch Health operates a hybrid of specialty brands and generics. Teva and Sun Pharmaceutical compete at generic scale, where the semi-solid price floor is set. Perrigo is the aisle itself: store-brand over-the-counter topicals, where the growth is real and the price is not. Hisamitsu holds the most structurally advantaged position in the route, a transdermal patch franchise with systemic claims and pharmaceutical pricing. Pfizer is included as a cautionary case: a large company that acquired a novel topical active and never built it into a franchise, which is the clearest available evidence that in topicals, commercial reach in the channel matters more than the molecule.
Two structural observations follow. First, consolidation in this market buys channel access, not pricing power: acquiring a semi-solid portfolio buys volume at generic margins. Second, the only sub-segment where acquiring share changes the economics is the patch franchise, which is why patch assets and patch technology attract multiples that cream portfolios do not.
Value Chain
Where the margin sits in a cream
The topical value chain has six steps, and only two of them are expensive. The active pharmaceutical ingredient is usually off-patent and traded as a commodity. The excipient system — the vehicle — is where formulation know-how actually lives, and it is protected by trade secret as often as by patent, which is why generic entrants can reproduce a molecule and still fail to reproduce a product. Fill-finish and primary packaging (tubes, pumps, sachets, patch laminates) sit in a competitive contract-manufacturing base with capacity to spare, so the packaging step earns a manufacturing return and nothing more. Distribution runs through wholesalers, pharmacy chains and, increasingly, the retail aisle. Then comes the step that sets the economics: the evidence package. And at the end of the chain is the payer, or the consumer’s own wallet.
The evidence package is the expensive one. A topical product other than a topical solution is regulated in the United States as a complex product, and an abbreviated application has to carry in vitro permeation and in vitro release data demonstrating that the test product behaves like the reference. That work requires validated equipment, a validated method and months of analytical labour, and it is product-specific rather than class-wide. The consequence is unusual in small-molecule pharmaceuticals: the barrier to generic entry is analytical capability rather than chemical synthesis. A cream is a commodity. A cream that permeates within the acceptance window of the reference, reproducibly, across batches, is not.
So the two durable positions in this chain are a proprietary vehicle and the ability to prove equivalence. That second position explains an otherwise puzzling fact about the route: some contract research organisations and analytical laboratories earn better returns on topicals than the formulators whose names are on the carton. It also explains why price erosion in semi-solids is slower than in ordinary oral generics, and why it is faster in liquids, where the analytical burden is lighter.
The fragility sits in a step almost nobody discusses: reference-product access. An abbreviated application is written against a reference listed drug, and if that product is withdrawn from market or restricted to limited distribution, the generic pathway stalls for reasons that have nothing to do with the science. In a market where the largest participants hold single-digit shares, that single administrative dependency is a bigger determinant of who can enter than any patent cliff.
Investment Activity
Capital is not the constraint
Topical manufacturing is not capital-hungry. A semi-solid line, a patch laminate line and the associated quality infrastructure are modest against biologics capacity, which is why this report characterises capital intensity as low and why capacity has never been the reason a topical product did not reach market. What capital buys in this route is the evidence package and commercial reach, in that order.
The economics at scale are nevertheless attractive, and Galderma’s 2025 results show the shape of them: USD 5,207 million of net sales, Core EBITDA of USD 1,211 million at a 23.3 per cent margin, Core EPS of USD 3.69, net leverage down to 1.5 times, and 2026 guidance of 17 to 20 per cent net sales growth at constant currency. That is a scaled dermatology franchise performing well — and, as the rest of this report argues, not because of the tube.
Capital in this market therefore flows to three destinations rather than to formulation capacity. The first is the injectable and biologic adjacency, where the severe end of dermatology now sits and where the growth is. The second is over-the-counter brand ownership and switch-ready assets, where the payer is the consumer and the marketing spend is the moat. The third is patch technology and patch assets, the only part of the route with pharmaceutical pricing power. Recent consolidation activity in the market is concentrated in exactly those three, and the strategic read for a buyer is straightforward: acquiring a semi-solid portfolio buys volume and channel at generic margins, and should be priced accordingly.
The absence of a capital constraint has one consequence worth stating plainly. Because entry is not gated by money, it is gated by time and by analytical capability, and those are the two things a well-funded new entrant cannot simply buy. That is why the fragmented structure of this market has proved so durable, and why a 6.45 per cent growth rate has coexisted with dozens of suppliers for two decades.
Technology & Innovation
Vehicles, patches and the test method
Innovation in this route runs on four fronts, and only one of them is chemistry.
Vehicle science is the oldest and still the most commercially productive. Penetration enhancers, supersaturated systems, microemulsions, emollient ratios and pH control change how much active reaches the viable epidermis, and a formulation change of that kind can support a new clinical claim without any new molecule. This is where most branded topical revenue growth comes from — including the recent entrants that are new actives in conventional cream vehicles, sold at a multiple of the generic steroid price on the strength of a better vehicle and a cleaner safety label.
Patch engineering is the most defensible technology in the route, because a patch is a device and a drug at once and makes a systemic rather than a local claim. Drug-in-adhesive matrix designs dominate; reservoir systems persist where the dose is higher or the molecule less stable. The economics are attractive for a structural reason: a patch is priced against the oral or injectable alternative it replaces, not against a cream, so it escapes the dermatology pricing ceiling entirely.
Microneedle arrays are the most discussed and least commercialised front. Coated and dissolving arrays exist at scale in cosmetic and diagnostic applications; therapeutic arrays with a pharmaceutical claim remain a small number of products, and the manufacturing tolerance problem — coating uniformity across millions of projections — has not been solved economically at volume.
The measurement layer is the front that actually moves the arithmetic, and it is not a product technology at all. As in vitro permeation testing matures as a regulatory instrument, the ability to characterise a product’s behaviour through skin becomes the gate on entry and, in some cases, the basis for a claim of therapeutic equivalence. Innovation here is quiet and decisive: a better-permeating vehicle that cannot be demonstrated is worth less than a worse one that can.
The technology maturity of the route overall is mature, and the innovation intensity is moderate. That combination — not a low rate of scientific activity, but a low rate of scientific activity that changes the arithmetic — is exactly what a 6.45 per cent CAGR looks like from the inside.
Market Risk
Five risks, ranked
1. Reference-product access. The highest-severity, least-discussed risk in the route. An abbreviated application is written against a reference listed drug; withdrawal or limited distribution of that product blocks generic development regardless of analytical capability. It is an administrative dependency on somebody else’s commercial decision, and it can remove a competitor from the field — or remove the route to market from an entire product class — without warning.
2. Biologics moving down the severity curve. Every label expansion into moderate disease removes patients from the topical layer permanently, and the direction of travel in atopic dermatitis and psoriasis has been down the severity scale for several years. This is the largest single threat to the value line: not a competing cream, but the absence of the patient.
3. Further over-the-counter switches. Good for units, deflationary for value. Each switch converts prescription revenue at prescription prices into retail revenue at retail prices, and the pool this report sizes is prescription-weighted.
4. Price erosion in semi-solid generics. The base tier carries the volume and competes on price. Sustained erosion there is not a tail risk; it is the normal condition, and it is why the increment has to come from the classes above it.
5. A technology step change in patches. Microneedle arrays at commercial scale, or a step change in adhesive and permeation design, would reprice the one part of the route with real pricing power — upward for whoever owns the technology and downward for everyone holding conventional patch assets.
What would falsify the forecast
This forecast is a 6.45 per cent CAGR with a back-loaded increment. Three observable developments would break it, and none of them requires a scientific failure.
First, a harmonised, cheap and widely accepted permeation standard would lower the cost of generic entry, compress the semi-solid price floor faster than the model assumes, and pull the value line down. Second, a biologic or oral therapy achieving broad reimbursement in moderate atopic dermatitis or psoriasis would shrink the addressable topical population faster than label expansion has so far. Third, a switch wave across the remaining prescription topical analgesics and corticosteroids would move a large block of value into retail pricing in a short window. Each of these is more plausible than a sudden collapse in demand, and each is measurable in the regulatory record rather than in the market data — which is where a reader should watch.
Regulatory Landscape
Complex products, and the evidence package as the gate
The United States sets the regulatory logic for the route, and it starts from a classification rather than a rule. Because topical products are typically locally acting, with a complex route of delivery and often complex formulations, the FDA treats topical products other than topical solutions as complex products. The practical consequence is that an abbreviated new drug application for a cream, gel, ointment or foam cannot rest on systemic pharmacokinetics; it has to demonstrate local bioequivalence. The agency’s October 2022 draft guidance on in vitro permeation test studies for topical products submitted in abbreviated applications sets out how that comparison is made against the reference standard, and it carries the usual caveat that it is not for implementation. It is nonetheless the document that shapes the cost of entry, because it defines the evidence a filer must produce before the question of price even arises.
Because the permeation method is set product by product through product-specific guidance, the regulatory burden is not a class-wide barrier that can be amortised across a portfolio. It is a per-product analytical programme. For an entrant this is a real cost; for an incumbent it is a moat that survives patent expiry, because a competitor must spend the same money to cross the same bar. That is the single most important regulatory fact in this report: the barrier to copying a topical is not the molecule, it is the test.
The second route into the market is the over-the-counter switch, and it changes the payer rather than the product. The FDA’s February 2020 approval of diclofenac sodium topical gel 1% for over-the-counter sale — the first prescription-strength topical NSAID to make the switch in the United States — is the template: a well-characterised active, guideline support for topical over oral use in knee and hand osteoarthritis, and a consumer population that can self-treat. A switch converts prescription revenue into retail revenue at a lower price per unit and a much larger unit base, which is good for volume and deflationary for this report’s value line.
Outside the United States the picture is national rather than harmonised. European marketing authorisations for complex generics run through member states without a mutual-recognition shortcut for the permeation data, and health-technology assessment remains a member-state matter for topicals, with the EU’s joint assessment regime phasing in first through oncology and advanced therapies. In Asia Pacific the binding constraint is not price but diagnosis: the fastest-growing region in this model grows because more patients reach a clinician, not because any payer raises a price.