
Editorial Article
A Paper Cup Line Costs USD 2 Million and Repays in 8.4 Years at 4.60 Cents. At 1.70 Cents It Takes 22.7
Somewhere between five and six thousand cup-forming lines supply the world’s paper cups. Each runs at roughly 160 cups a minute, six thousand hours a year, and turns out about 57.6 million cups. That is the entire production base of a market we size at 470.0 billion units and USD 15,340 million of converter realisation in 2025, reaching 647.5 billion units and USD 19,588 million by 2033.
Two growth rates sit inside those numbers and they do not agree. Units grow 4.09 per cent a year. Value grows 3.10 per cent. Realisation per unit slides from 3.26 to 3.03 US cents — 0.94 per cent a year of price attrition absorbing most of the volume gain. Most coverage of this market stops there, with the observation that price is falling. The operating question is the next one: what does a converter do about it, and why does the answer determine where the capacity gets built?
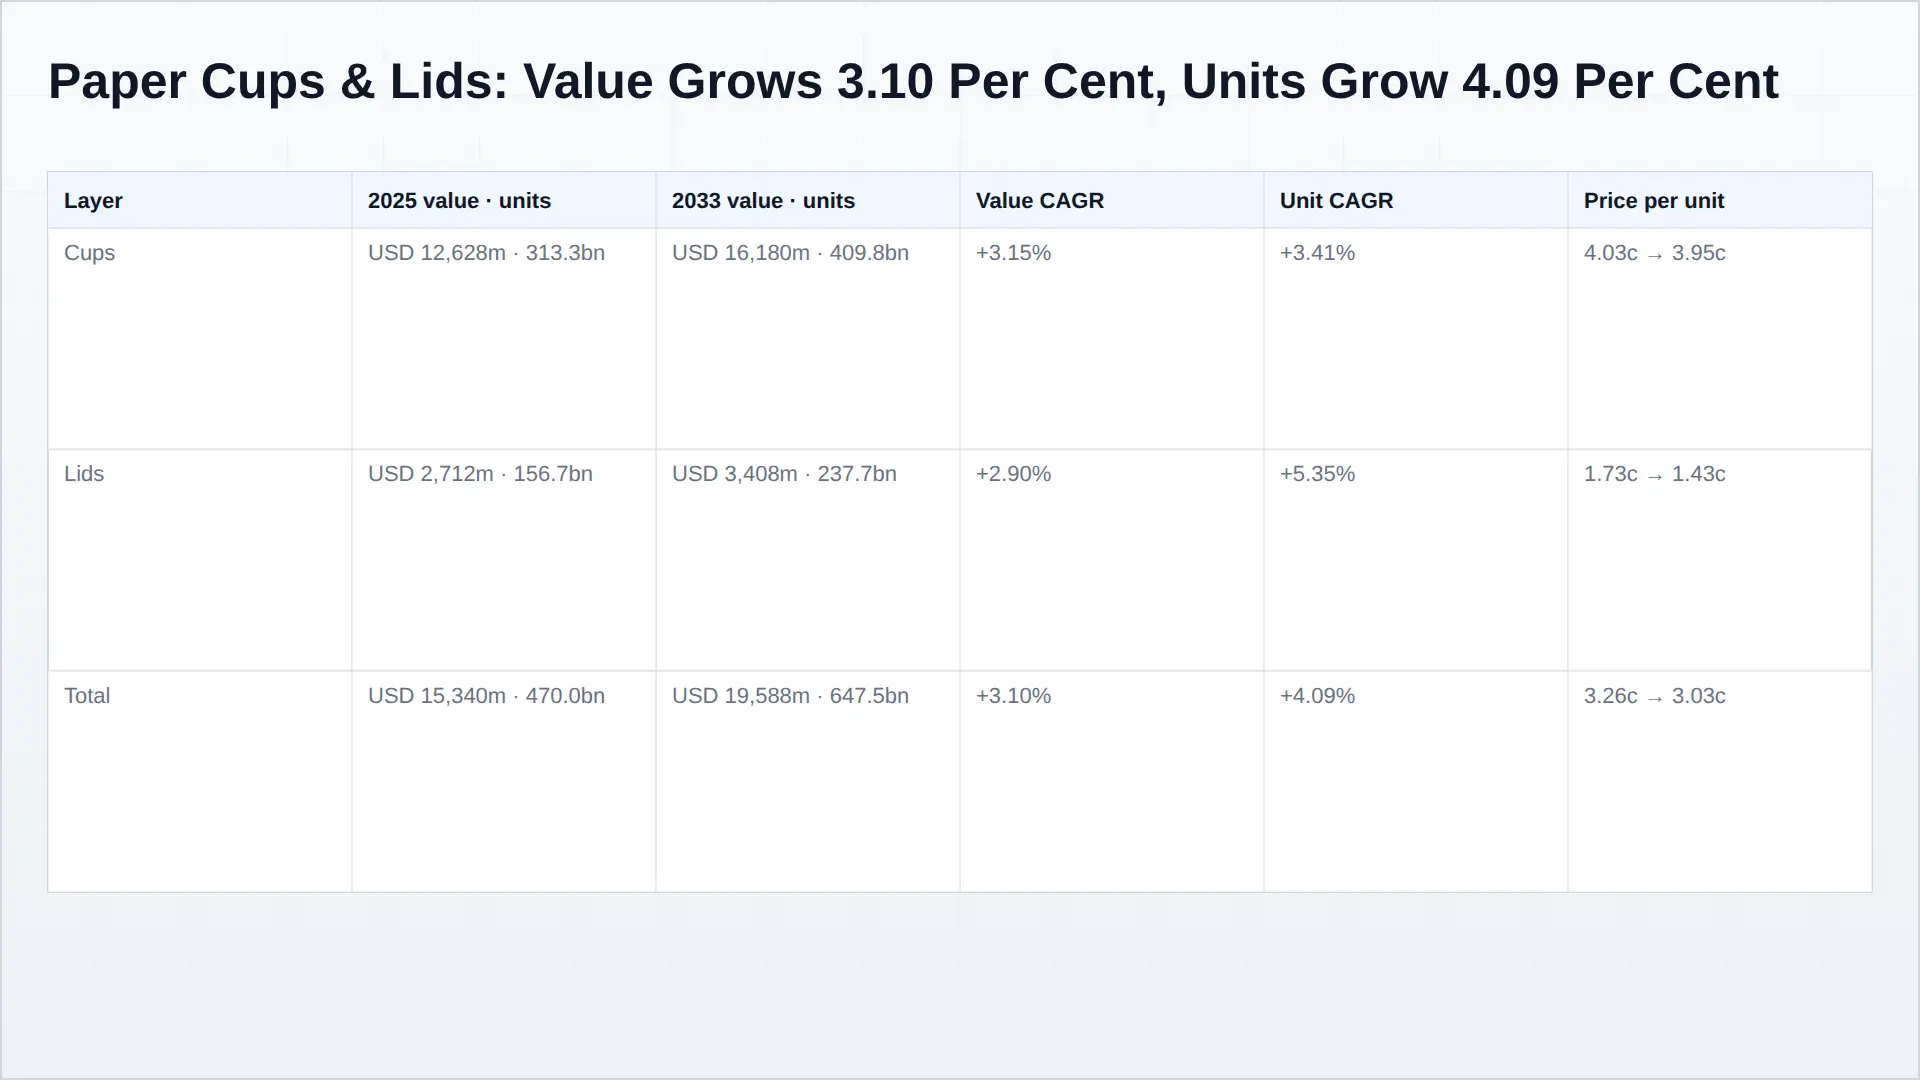
The two numbers are one number
Value and units are not independent readings of this market. They are the same reading at two denominators, and the ratio between them is a price. Every strategic statement about paper cups is a statement about that ratio moving.
| Layer | 2025 | 2033 | Value CAGR | Unit CAGR | Realisation per unit |
|---|---|---|---|---|---|
| Cups | USD 12,628 m / 313.3 bn | USD 16,180 m / 409.8 bn | 3.15% | 3.41% | 4.03c → 3.95c |
| Lids | USD 2,712 m / 156.7 bn | USD 3,408 m / 237.7 bn | 2.90% | 5.35% | 1.73c → 1.43c |
| Total | USD 15,340 m / 470.0 bn | USD 19,588 m / 647.5 bn | 3.10% | 4.09% | 3.26c → 3.03c |
Two things fall out of that table. The lid is the growth layer in units and the deflation layer in price — the only part of the set where volume and money move in opposite directions at that scale, at +5.35 per cent units against 2.90 per cent value. And the cup’s price is nearly stable, at 0.26 per cent a year of attrition. That is why the headline gap is a point rather than a chasm. This market is not collapsing. It is being repriced in one component while the other component carries the volume.
What a forming line has to recover
The report’s investment chapter runs a line through the realised price band. A cup-forming line plus tooling is modelled at USD 2 million. At 4.60 cents a cup, that capital repays in 8.4 years. At 1.70 cents, it repays in 22.7. Same machine, same output, same customer — 2.7 times the capital cycle, entirely because of what the cup is worth at the end of it.
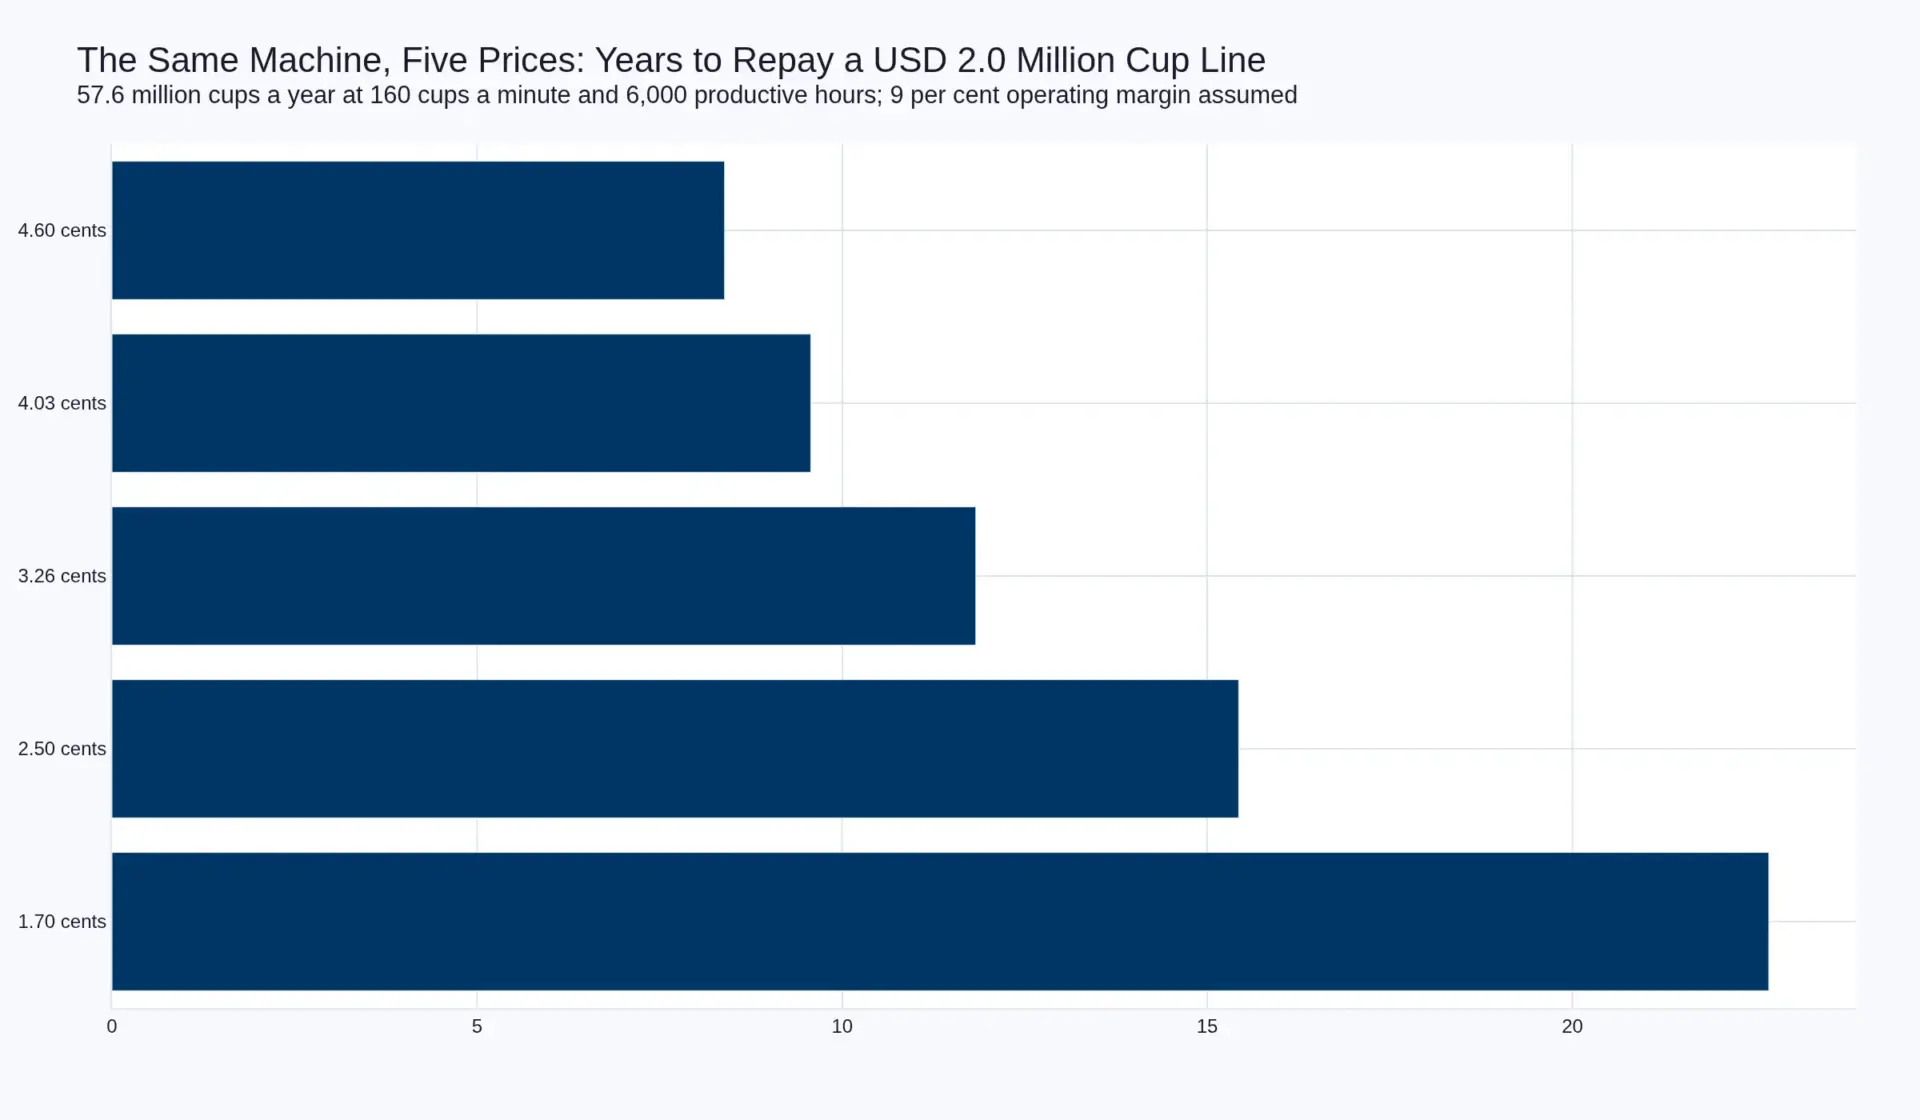
That ratio, not the CAGR, is the strategic fact. A converter choosing between a hot-cup programme for a European quick-service chain and a cold-cup programme for a US distributor is not choosing between two growth rates. He is choosing between two payback periods, and the 2033 forecast does not enter the calculation, because the line is paid for in the first nine years or it is not paid for at all.
It also explains the shape of the industry. At 57.6 million cups a line and 313.3 billion cups in 2025, the world needs about 5,439 line-equivalents. No company can own a meaningful share of 5,439 machines that each serve a radius defined by the freight cost of a four-cent product. There is no scale advantage in cups the way there is in containerboard, where a machine costs a hundred times as much and serves a continent. The capital here is small, divisible and local, so the market is too — which is why every published share estimate for paper cups is an attribution dressed as a measurement.
The nearest thing to a share table is a set of disclosed segment revenues that each contain cups plus something else. Even a harmonised customs code does not fix that: as the 2.7-fold unit-value spread inside a single code shows elsewhere in this cluster, classification is not commensurability.
What the disclosed seats actually report
Graphic Packaging‘s Americas Paperboard Packaging segment — the one that carries cups, lids and food containers alongside the cartons it sells to cereal brands — sold USD 1,476 million in the third quarter of 2026 against USD 1,474 million a year earlier, and earned USD 132 million of operating income against USD 222 million. The segment margin went from 15.06 per cent to 8.94. Nine months: 8.40 against 14.28.
| Americas Paperboard Packaging | Q3 2025 | Q3 2026 | 9M 2025 | 9M 2026 |
|---|---|---|---|---|
| Net sales, USD m | 1,474 | 1,476 | 4,461 | 4,427 |
| Income from operations, USD m | 222 | 132 | 637 | 372 |
| Operating margin | 15.06% | 8.94% | 14.28% | 8.40% |
Huhtamaki‘s Foodservice Packaging segment earned an 8.3 per cent adjusted EBIT margin in the first half of 2026 against 9.0 per cent a year earlier, and took a EUR 16 million impairment on footprint optimisation. Two of the largest disclosed seats in the world, both below ten per cent, both down.
The most legible line in either set of accounts is the quarterly bridge: volume up 1 per cent for USD 19 million, price down 1 per cent for USD 15 million. Four million dollars of net growth on a 1.5 billion dollar quarter is the 3.10-versus-4.09 gap arriving in a filing. It is also why mix and margin, not revenue, are what a foodservice sales organisation is now measured on — the argument made in the five products inside a cup.
Three things that would falsify this
- Realised price per cup turns positive. A substrate premium converted from a cost into a price, or a cup and lid sold as one system at one price, would invert the payback arithmetic and pull capacity forward faster than this forecast implies.
- Line speed above 200 cups a minute at commercial scale. The whole fragmentation argument rests on 57.6 million cups per line. A 25 per cent faster line retires a fifth of the capital base, and with it the local-versus-global logic.
- Fibre closures take a double-digit share. Lids are 33.4 per cent of units at 1.73 cents each. Remove the deflation layer from the composite and the market’s realised price stops falling — a different market, not a better one.
The third is the one to watch, because it is where the substrate transition actually stops. Against the wider global packaging market it is a rounding error in value and a very large number in tonnes.
Sources and method
Market sizing is Pheonix’s own, built from installed forming capacity at 160 cups a minute and 6,000 hours a year, then reconciled to disclosed converter segment revenue. Disclosed figures are Graphic Packaging’s third-quarter 2026 segment schedule and Huhtamaki’s half-year 2026 release. Recycling access and end-market counts are Foodservice Packaging Institute data; regulatory positions are FDA and EUR-Lex. No third-party market-research estimate is used or cited anywhere in this article.
Disclosure. This article is approximately 70 per cent secondary research — published filings, government and industry-body data, and the report’s own modelled series — and 30 per cent primary work: open-ended interviews with converters, tooling suppliers and foodservice operators conducted for this research, and the specification and format observations those conversations produced. The primary layer establishes mechanism and behaviour. It carries no market magnitude; every number above traces to a published source or to the model, which is shown so a reader can re-run it.
Frequently Asked Questions
How big is the global paper cups and lids market?
USD 15,340 million of converter realisation across 470.0 billion units in 2025, reaching USD 19,588 million across 647.5 billion units by 2033. Cups account for USD 12,628 million and 313.3 billion units; lids for USD 2,712 million and 156.7 billion units.
Why does market value grow more slowly than volume?
Value grows 3.10 per cent a year against unit growth of 4.09 per cent, because realisation per unit falls from 3.26 to 3.03 US cents. Almost all of that attrition sits in the lid, where price falls 2.33 per cent a year while units grow 5.35 per cent. Cup price falls only 0.26 per cent a year.
How long does a paper cup forming line take to pay back?
On a line modelled at USD 2 million including tooling, recovery takes 8.4 years if the cup carries 4.60 cents and 22.7 years if it carries 1.70 cents. The same machine, output and customer produce a 2.7-fold difference in capital cycle purely from realised price per unit.
How many cup-forming lines are there in the world?
About 5,439 line-equivalents. At 160 cups a minute over 6,000 hours a year a line produces roughly 57.6 million cups, so 313.3 billion cups of 2025 demand implies 5,439 lines. That divisibility is why no converter holds a large share, and why published share estimates for this market are attributions rather than measurements.