
Editorial Article
China and India Are 25 Per Cent of Ultrasonic Testing and 38 Per Cent of Its Growth
China and India together are 25.0 per cent of the world’s ultrasonic testing market and 38.4 per cent of its growth. That gap — six-tenths of the world’s value producing more than a third of its increment — is the single sharpest geographic fact in Pheonix Research’s Global Ultrasonic NDT Equipment Market Report, Size, Share and Forecast 2026–2033.
The market is USD 4,964 million in 2025 and reaches USD 8,403 million in 2033 at 6.80 per cent, an increment of USD 3,439 million. Where that increment lands is not where the market currently sits.
| Region | 2025 share of value | Share of the increment | Compound growth |
|---|---|---|---|
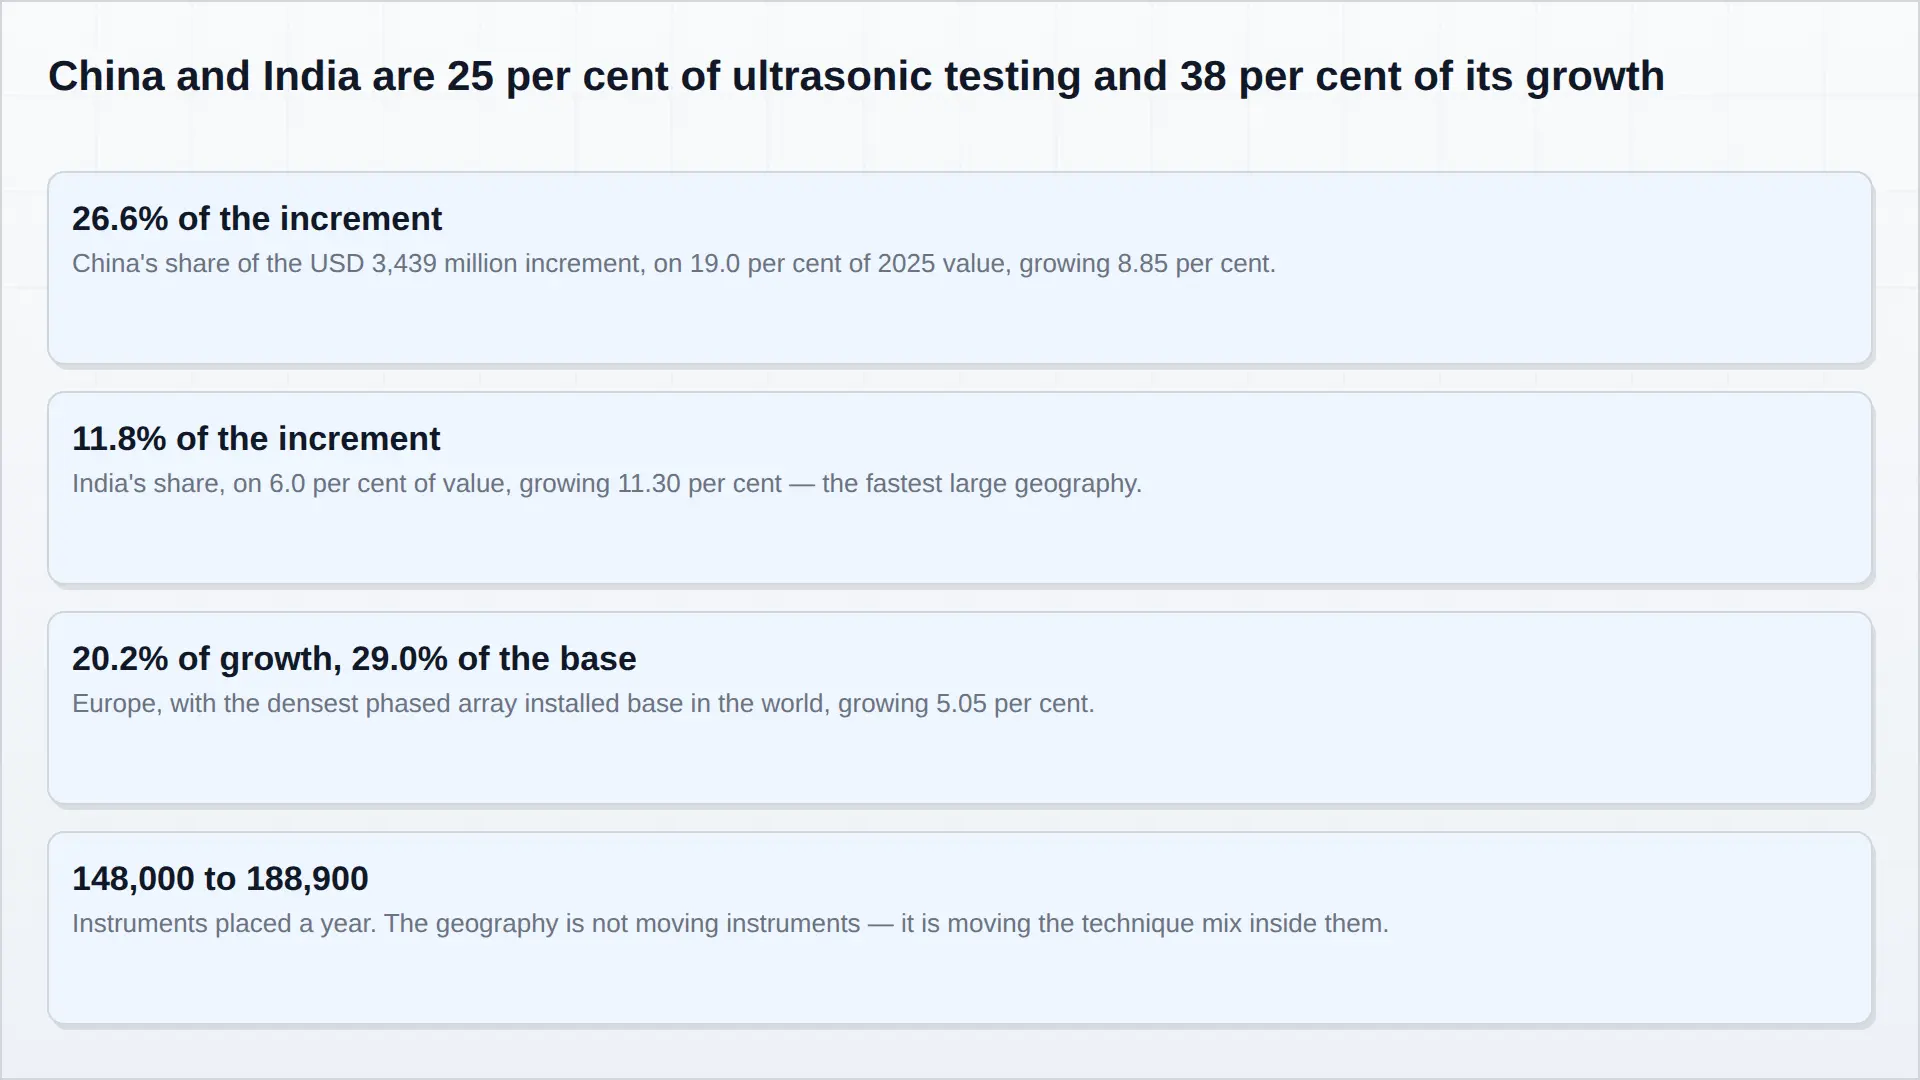
| China | 19.0% | 26.6% | 8.85% |
| India | 6.0% | 11.8% | 11.30% |
| Europe | 29.0% | 20.2% | 5.05% |
Read the Europe line first, because it is the one that should worry a European incumbent. Europe holds the densest phased array installed base in the world — the technique was developed there, the major suppliers are there, and the inspection codes that made it mandatory in critical applications were largely written there. It is 29.0 per cent of the market. It takes 20.2 per cent of the growth. That is not a collapse; it is a mature market behaving maturely, at 5.05 per cent against a global 6.80.
Then read China. Nineteen per cent of value, 26.6 per cent of the increment, 8.85 per cent growth. And India: six per cent of value, 11.8 per cent of the increment, 11.30 per cent — the fastest large geography in the model and the one where the arithmetic is least stable, because a market that small growing that fast is being built rather than maintained.
This is a technique story before it is a geography story
The instinct is to read those numbers as a demand forecast. They are better read as a mix forecast, and the mechanism is specific.
Ultrasonic growth in a mature market comes from replacement: an installed fleet of flaw detectors and thickness gauges reaching end of service, and phased array being specified for new procedures where the re-qualification cost is already being paid on a new asset. Growth in a market that is building its inspection capacity for the first time comes from installation: instruments bought where none existed, procedures written from scratch, and — crucially — no installed base to defend.
That last point is the commercial heart of it. The moat that keeps conventional ultrasonic holding 41.0 per cent of its own family in a mature market is a re-qualification cost on existing procedures. In a market where the procedure does not yet exist, there is nothing to re-qualify, and phased array can be written in at the point of specification rather than sold against an incumbent method. This is why a geography can take a disproportionate share of a family’s growth without the family’s technique split changing globally: the new capacity is simply more advanced than the average of the old.
It also means the geography and the technique are the same forecast wearing two labels. Phased array rises from USD 1,688 million to USD 3,644 million at 10.10 per cent, from 34.0 per cent of the family to 43.4 per cent. A meaningful share of that movement is not a substitution happening anywhere. It is new capacity arriving already phased-array.
What it does not mean
It does not mean volumes are moving east at the rate value is. Instruments placed across the family rise from 148,000 to 188,900 a year at 3.10 per cent, while realised spend per instrument rises to USD 44,484 at 3.59 per cent. Realised spend in China and India is below the global average and rising faster — the mix inside those markets is moving up the technique ladder at the same time as the number of instruments grows. A supplier who models those markets on volume alone will under-forecast their revenue contribution and over-forecast the price they can hold there once the ladder flattens.
It does not mean Europe is a bad business. At 29.0 per cent of 2025 value, Europe remains the largest single regional pool in the model, growing 5.05 per cent on a base that carries the highest service, calibration and software attach rates in the market. The growth is slower and the margin is better; that is a different business from the one being built in Asia, not a worse one.
And it does not mean the end markets move with the regions. Oil and gas is 24.0 per cent of demand globally and the slowest large buyer, because interval codes set the schedule and billable hours set the price. Aerospace is 15.0 per cent and where phased array earns its premium. Those proportions travel; they do not follow the growth.
The question a supplier should be able to answer
Given that 26.6 per cent of this family’s growth is in China and 11.8 per cent in India, and that the technique mix in both is moving up faster than the global average — what share of your phased array capacity, applications engineering and training capability is located where the procedures are being written?
For most of the incumbents the honest answer is that it is not, and that the local competitors who are there are not yet as good and are perfectly adequate for a market writing its first procedure rather than its tenth. That is a five-year problem rather than a one-year problem, and five years is exactly the length of the window this forecast describes.
The regional splits, technique mix by geography and realised spend per instrument are modelled in the Global Ultrasonic NDT Equipment Market Report 2026–2033.
Frequently Asked Questions
How much of ultrasonic growth comes from China and India?
26.6 per cent from 19.0 per cent of 2025 value at 8.85 per cent growth, and 11.8 per cent from 6.0 per cent of value at 11.30 per cent — 38.4 per cent of the increment between them.
What is happening to Europe?
29.0 per cent of 2025 value and 20.2 per cent of the increment, at 5.05 per cent. It holds the densest phased array installed base in the world, so it is a mature replacement market rather than a weak one.
Why does the geography matter to the technique split?
Because new capacity has no installed base to defend. The re-qualification cost that keeps conventional ultrasonic in place in mature markets does not exist where the procedure is being written for the first time, so phased array is specified in rather than sold against an incumbent method.
Are instrument volumes moving east as fast as value?
Not at the same rate. Instruments placed rise from 148,000 to 188,900 a year at 3.10 per cent while realised spend per instrument rises 3.59 per cent — the geography is moving the technique mix inside each instrument, not just the count.