
Editorial Article
Inline Metrology Is the Only Market in This Cluster Where Volume Beats Price
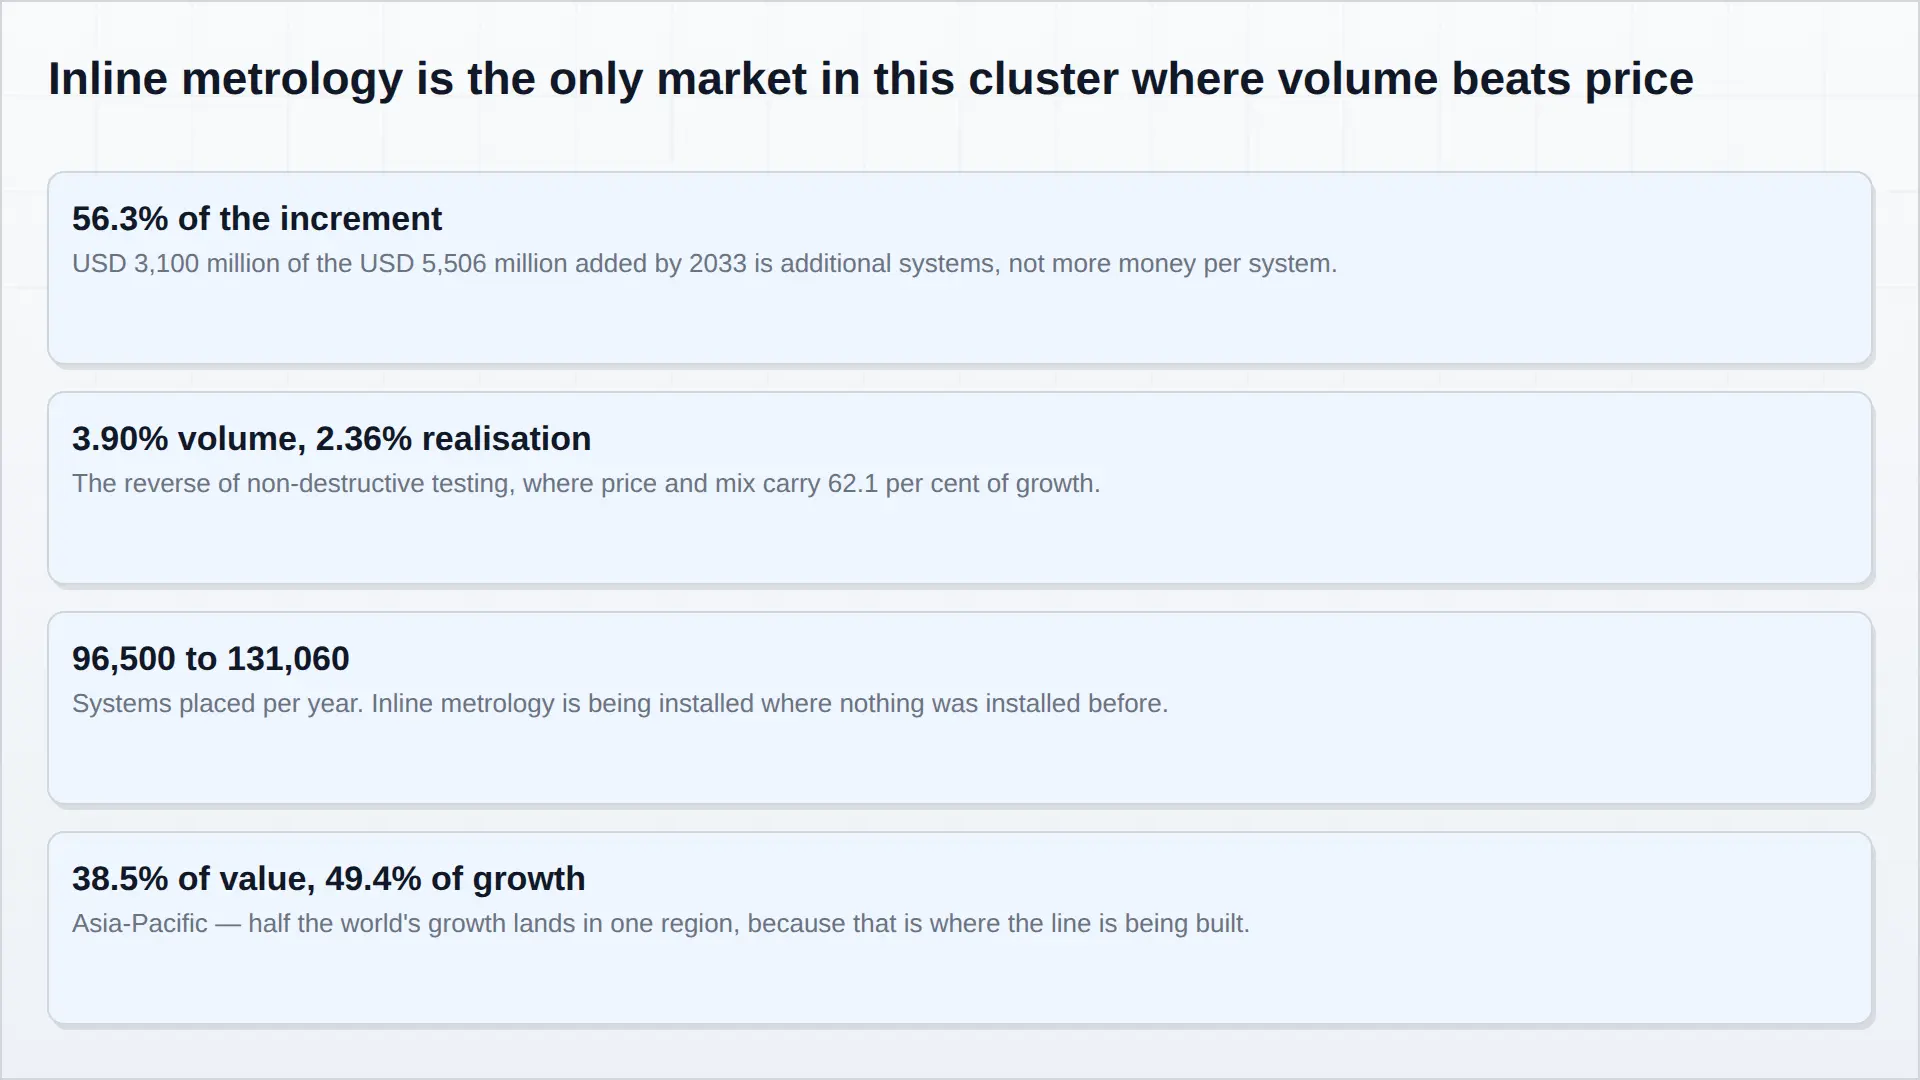
Inline metrology is the odd one out in this cluster, and the oddity is worth more than the headline. Across the inspection markets Pheonix Research models, growth is mostly price: 62.1 per cent of non-destructive testing’s increment and 60.1 per cent of ultrasonic testing’s come from realised spend per instrument rather than from additional instruments. In inline metrology, 56.3 per cent of the USD 5,506 million increment is additional systems.
The market is USD 8,650 million in 2025 and reaches USD 14,158 million in 2033 at 6.35 per cent. Systems placed rise from 96,500 to 131,060 a year at 3.90 per cent; realised spend per system contributes 43.7 per cent of the growth at 2.36 per cent — the lowest realisation rate anywhere in the cluster.
Two kinds of market, one spreadsheet
| Market | Compound growth | Share of growth from volume | Share from price and mix | Volume growth |
|---|---|---|---|---|
| Non-destructive testing | 6.07% | 37.9% | 62.1% | 2.60% |
| Ultrasonic testing | 6.80% | 39.9% | 60.1% | 3.10% |
| Inline metrology | 6.35% | 56.3% | 43.7% | 3.90% |
The difference is not a modelling artefact. It is a difference in what the buyer is doing.
Non-destructive testing is a replacement market. The instrument is bought because an inspection code revision changed a method from permitted to required, because a fleet of flaw detectors reached end of service, or because the labour to run the old method stopped being available. The buyer is not adding capability; they are replacing it under constraint, and constrained buyers accept price. That is why price carries 62.1 per cent of the growth in a market whose unit count rises 2.60 per cent a year.
Inline metrology is not replacing what was already there. It is being installed where nothing was installed before — at the end of a production line that did not previously have a measuring station, or in a plant that previously sampled in a room. The measurement is being pushed to the line, and pushing it there means buying a system that did not exist in that location.
The cost curve runs the other way
Realisation growth of 2.36 per cent is the lowest in the cluster for a specific reason: machine vision hardware rides a semiconductor cost curve. Sensors get cheaper per unit of resolution every year, and cameras get better at the same price. In a market where machine vision is moving from 24.5 per cent of value to 29.2 per cent, mix is shifting toward the technology whose underlying cost declines — which is the opposite of what happens in ultrasonic testing, where mix shifts toward phased array and mix therefore pushes realisation up.
So the supplier trade is explicit. Shifting toward vision buys unit growth at the price of price growth. Volume grows at 3.90 per cent and realisation at 2.36 per cent, and the second number gets worse as the first one gets better.
That trade only works if the software and service attached to those units carries a margin the hardware does not. Which is precisely why every CMM incumbent in this market has spent a decade acquiring software, and why the interesting competition is no longer in the head that touches the part.
What would break the forecast
Two things, and both are visible in the model.
The first is geography. Asia-Pacific is 38.5 per cent of 2025 value and takes 49.4 per cent of the increment — half the world’s growth in one region, because that is where the line is being built and where inspection is specified alongside it rather than retrofitted to it. A slowdown in Asia-Pacific capital spending on new production capacity would not shave this forecast; it would remove its centre. A supplier with a European or North American cost base and an Asian growth assumption is carrying more concentration risk than the topline suggests.
The second is the end market. Automotive and EV is the largest buyer at 26.0 per cent and the most cyclical in the cluster. Unlike non-destructive testing, where a regulator requires the inspection, nothing in inline metrology is bought because it is mandatory. It is bought because a line is being built or a quality problem is being solved, and both of those are discretionary capital decisions that can be deferred by a quarter and then by a year. A code-mandated market is boring in a downturn. This one is not.
What a supplier does with a volume market
Price realisation of 2.36 per cent means the instrument will not carry the growth. Three moves follow, and all of them are about attaching something to the system that does not follow a semiconductor cost curve.
Attach the software as a licence rather than as a feature of the box, so that the same measurement engine can be sold onto a vision cell, a multisensor cell or a CMM and is re-priced when the customer’s line changes. Attach the service contract, because a measuring station in a production line is a metrology asset that needs calibration and drift management, and that obligation recurs annually regardless of what the hardware cost. And attach the process knowledge — the application engineering that decides what to measure, at what rate and against what tolerance — which is the part of the installation the customer cannot buy from a catalogue.
None of that is novel advice. It is worth stating plainly because the arithmetic makes it compulsory rather than optional: in a market adding 56.3 per cent of its growth through additional systems at 2.36 per cent realisation, a supplier whose revenue is the system price is on a treadmill that speeds up every year it succeeds.
The volume and realisation decomposition, by technology and by region, is in the Global Inline Metrology Market Report 2026–2033.
Frequently Asked Questions
How much of inline metrology growth is volume?
56.3 per cent of the USD 5,506 million increment — USD 3,100 million — with systems placed rising from 96,500 to 131,060 a year at 3.90 per cent and realised spend per system contributing 43.7 per cent at 2.36 per cent.
Why is this market different from the rest of the cluster?
Because non-destructive testing is a replacement market where constrained buyers accept price, while inline metrology is being installed where nothing was installed before — and because machine vision hardware rides a semiconductor cost curve that runs downwards.
What is the concentration risk?
Asia-Pacific, with 38.5 per cent of 2025 value and 49.4 per cent of the increment, because that is where the production line is being built and where inspection is specified alongside it.
Which end market makes this forecast most fragile?
Automotive and EV at 26.0 per cent of demand, which is the most cyclical buyer in the cluster. Nothing in this market is bought because a regulation requires it, so capital decisions can be deferred in a way that code-mandated inspection cannot.