
Editorial Article
Magnetic Particle and Penetrant Are 13.7 Per Cent of This Market and Falling. Both Still Grow.
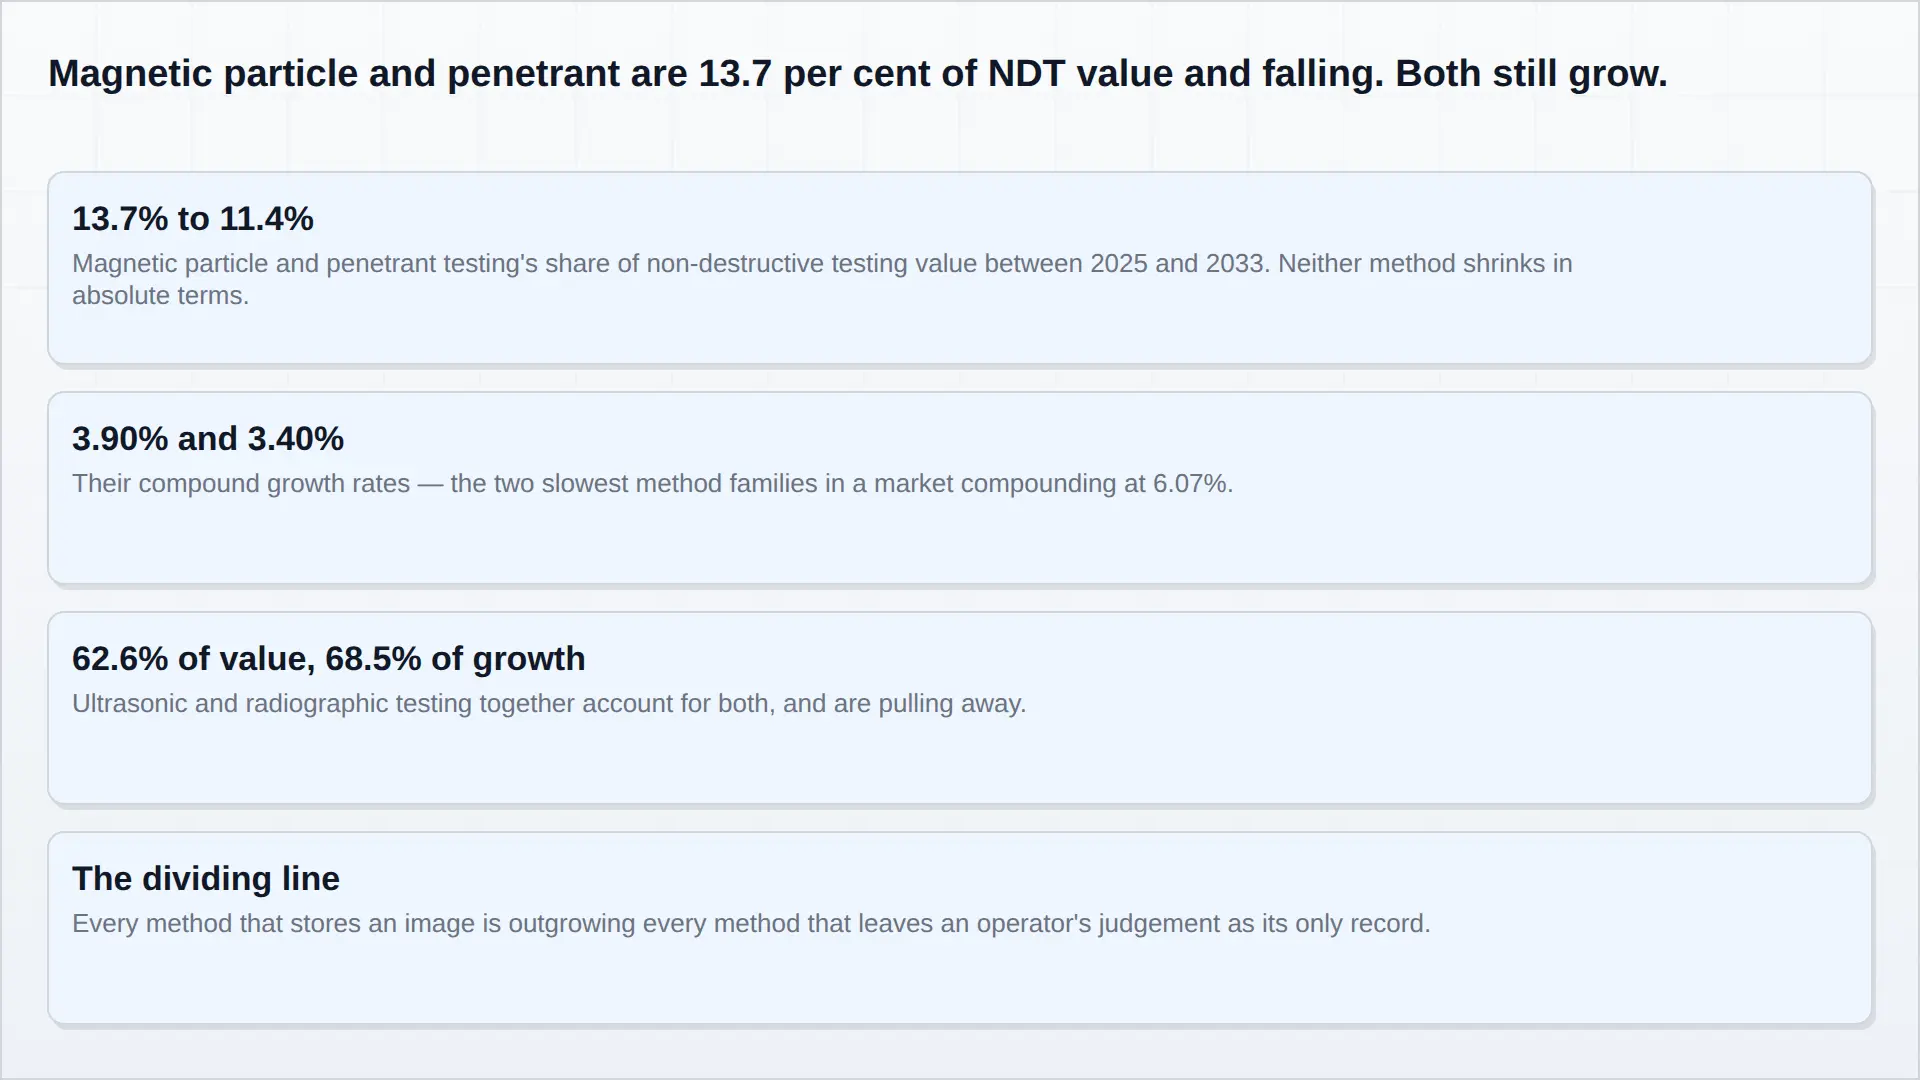
Magnetic particle and penetrant testing are the two oldest methods in the non-destructive testing toolkit, and both are still growing. They are also both losing the market. Together they fall from 13.7 per cent of global non-destructive testing value in 2025 to 11.4 per cent in 2033, and at 3.90 and 3.40 per cent they are the two slowest-growing method families in a market compounding at 6.07 per cent.
That combination — absolute growth with relative decline — is usually reported as a story about technology displacement. It is not quite that. Nothing about magnetic particle inspection stopped working. A fluorescent particle under ultraviolet light still finds a surface-breaking crack in a weld more cheaply than almost anything else invented since. What changed is what the industry now expects a test to produce.
Pheonix Research’s Global Non-Destructive Testing Equipment Market Report, Size, Share and Forecast 2026–2033 models the market at USD 14,600 million in 2025, reaching USD 23,390 million in 2033, an increment of USD 8,790 million. Of that increment, USD 3,329 million — 37.9 per cent — comes from placing more instruments. The other USD 5,461 million, or 62.1 per cent, is price and mix.
What the numbers actually say
| Method family | 2025 share of value | 2033 share of value | Compound growth |
|---|---|---|---|
| Ultrasonic | 34.0% | — | 6.80% |
| Radiographic (film, CR and digital detector array) | 28.6% | — | 6.19% |
| Visual and remote visual | 9.5% | — | 7.20% |
| Magnetic particle | 7.4% | 6.2% | 3.90% |
| Penetrant | 6.3% | 5.2% | 3.40% |
Read the first two rows against the last two. Ultrasonic and radiographic testing together are 62.6 per cent of 2025 value and 68.5 per cent of the increment. Magnetic particle and penetrant are 13.7 per cent of value and take a share of growth well below their weight. Both statements are true at once, and the gap between them is the entire structural story of this market.
Note also that the cheapest family in the table is the fastest growing. Visual and remote visual inspection is 9.5 per cent of 2025 value and takes 11.7 per cent of the increment. If the drift were simply “expensive technology beats cheap technology”, visual inspection would be at the bottom of the table, not the top. It is at the top.
The dividing line is not cost. It is whether the test leaves a record.
Magnetic particle and penetrant inspection both end in a judgement. An operator magnetises a part, or coats it, or sprays a developer on it, and then looks at it under a lamp and decides. The record is a signature on a report. The evidence is a fluorescence that has already faded by the time anyone asks about it.
Ultrasonic, radiographic and vision-based visual inspection all end in a file. A phased array scan is an encoded image. A digital radiograph is an image. A remote visual inspection is a video. Each one can be re-read by somebody who was not there, compared with the previous inspection of the same asset, and attached to an integrity management system that a regulator, an insurer or an acquirer can open.
That distinction matters commercially long before it matters technically, because the buyer of inspection is increasingly not the inspector. In oil and gas, in nuclear power, in aerospace supply chains and in any asset with a regulated integrity management plan, the party accepting the inspection result is a third party. A method whose output cannot be re-examined by that third party carries a growing documentation cost that has nothing to do with its technical performance — and that cost lands on the same purchase decision as the consumables.
Why the decline is slow rather than fast
Two things protect the consumable methods, and both are real.
The first is that they are extraordinarily well suited to the geometry they were designed for. Surface-breaking defects on ferromagnetic welds, castings and forgings are exactly what magnetic particle inspection finds, at a capital cost that fits inside a small fabrication shop’s budget. There are hundreds of thousands of those shops, and no plausible instrument roadmap replaces them in eight years.
The second is that in some sectors the technique is written into the specification. Where a standard annex names magnetic particle or penetrant as the required method for a defined defect type, displacing it requires the customer to re-qualify a written practice — a slower and more expensive act than buying a different instrument. This is the same mechanism that keeps conventional ultrasonic testing holding 41.0 per cent of its own family despite growing at 2.15 per cent, and it is why the drift in this market is a market-share drift rather than a substitution.
So 3.90 and 3.40 per cent are not the numbers of a dying method. They are the numbers of a method that is growing with the installed base of things that need inspecting, and capturing none of the growth that comes from inspecting them differently.
What that means for a supplier
If you sell consumables, the arithmetic of this market is unkind in a specific way: your revenue tracks the volume of inspections, and the volume of inspections is growing at roughly the rate of the instrument count — 1.02 million instruments placed in 2025 rising to 1.25 million in 2033, 2.60 per cent a year. Realised spend per instrument across all methods rises from USD 14,384 to USD 18,766 over the same period, at 3.38 per cent, and almost none of that increase accrues to a bottle of ink.
That leaves two defensible moves. One is to own the labour as well as the chemistry — inspection services rather than inspection materials — which converts a consumable line into a service contract that grows with the regulatory calendar. The other is to make the method produce a record: digitised indication capture, automated fluorescent particle recognition, an image stored against the asset identifier. The second is technically available and commercially under-exploited, and it is the only version of this business that participates in the 3.38 per cent realisation growth rather than watching it.
Neither move is required this year. Both become urgent once a customer’s integrity management system starts asking why the ferromagnetic weld inspection on Line 4 has no image attached to it.
The number to hold on to
Sixty-two per cent of this market’s growth over eight years is price and mix, not more inspection. A market with that shape rewards suppliers who can move a customer onto a more capable method, and penalises suppliers whose revenue is a function of how many times somebody sprays a part. Magnetic particle and penetrant testing will still be a multi-billion-dollar business in 2033. It will simply be a smaller share of a market that has reorganised itself around evidence.
The full method-by-method model, instrument counts, realised spend and the value chain behind them are in the Global Non-Destructive Testing Equipment Market Report 2026–2033.
Frequently Asked Questions
Are magnetic particle and penetrant testing declining?
Not in absolute terms. Both grow — magnetic particle at 3.90 per cent and penetrant at 3.40 per cent a year to 2033 — but both lose share, falling from 13.7 per cent of non-destructive testing value in 2025 to 11.4 per cent in 2033, against a market growing 6.07 per cent.
Why are the consumable methods losing share if they still work?
Because the output of the test is an operator's judgement rather than a stored file. As third parties — regulators, insurers, asset owners — increasingly accept only re-examinable inspection evidence, a method that leaves no image carries a documentation cost that has nothing to do with its technical performance.
Which methods are gaining the share?
Ultrasonic and radiographic testing together are 62.6 per cent of 2025 value and 68.5 per cent of the increment to 2033. Visual and remote visual inspection is the fastest-growing family at 7.20 per cent, taking 11.7 per cent of the increment on a 9.5 per cent base.
What is the largest single driver of growth in this market?
Price and mix. Of the USD 8,790 million the market adds between 2025 and 2033, USD 5,461 million — 62.1 per cent — is realised spend per instrument rising from USD 14,384 to USD 18,766, not an increase in the number of inspections.