
Global Industrial Radiography & Digital X-ray Inspection Market Report, Size, Share and Forecast 2026–2033: Film Was Priced Out, Not Designed Out
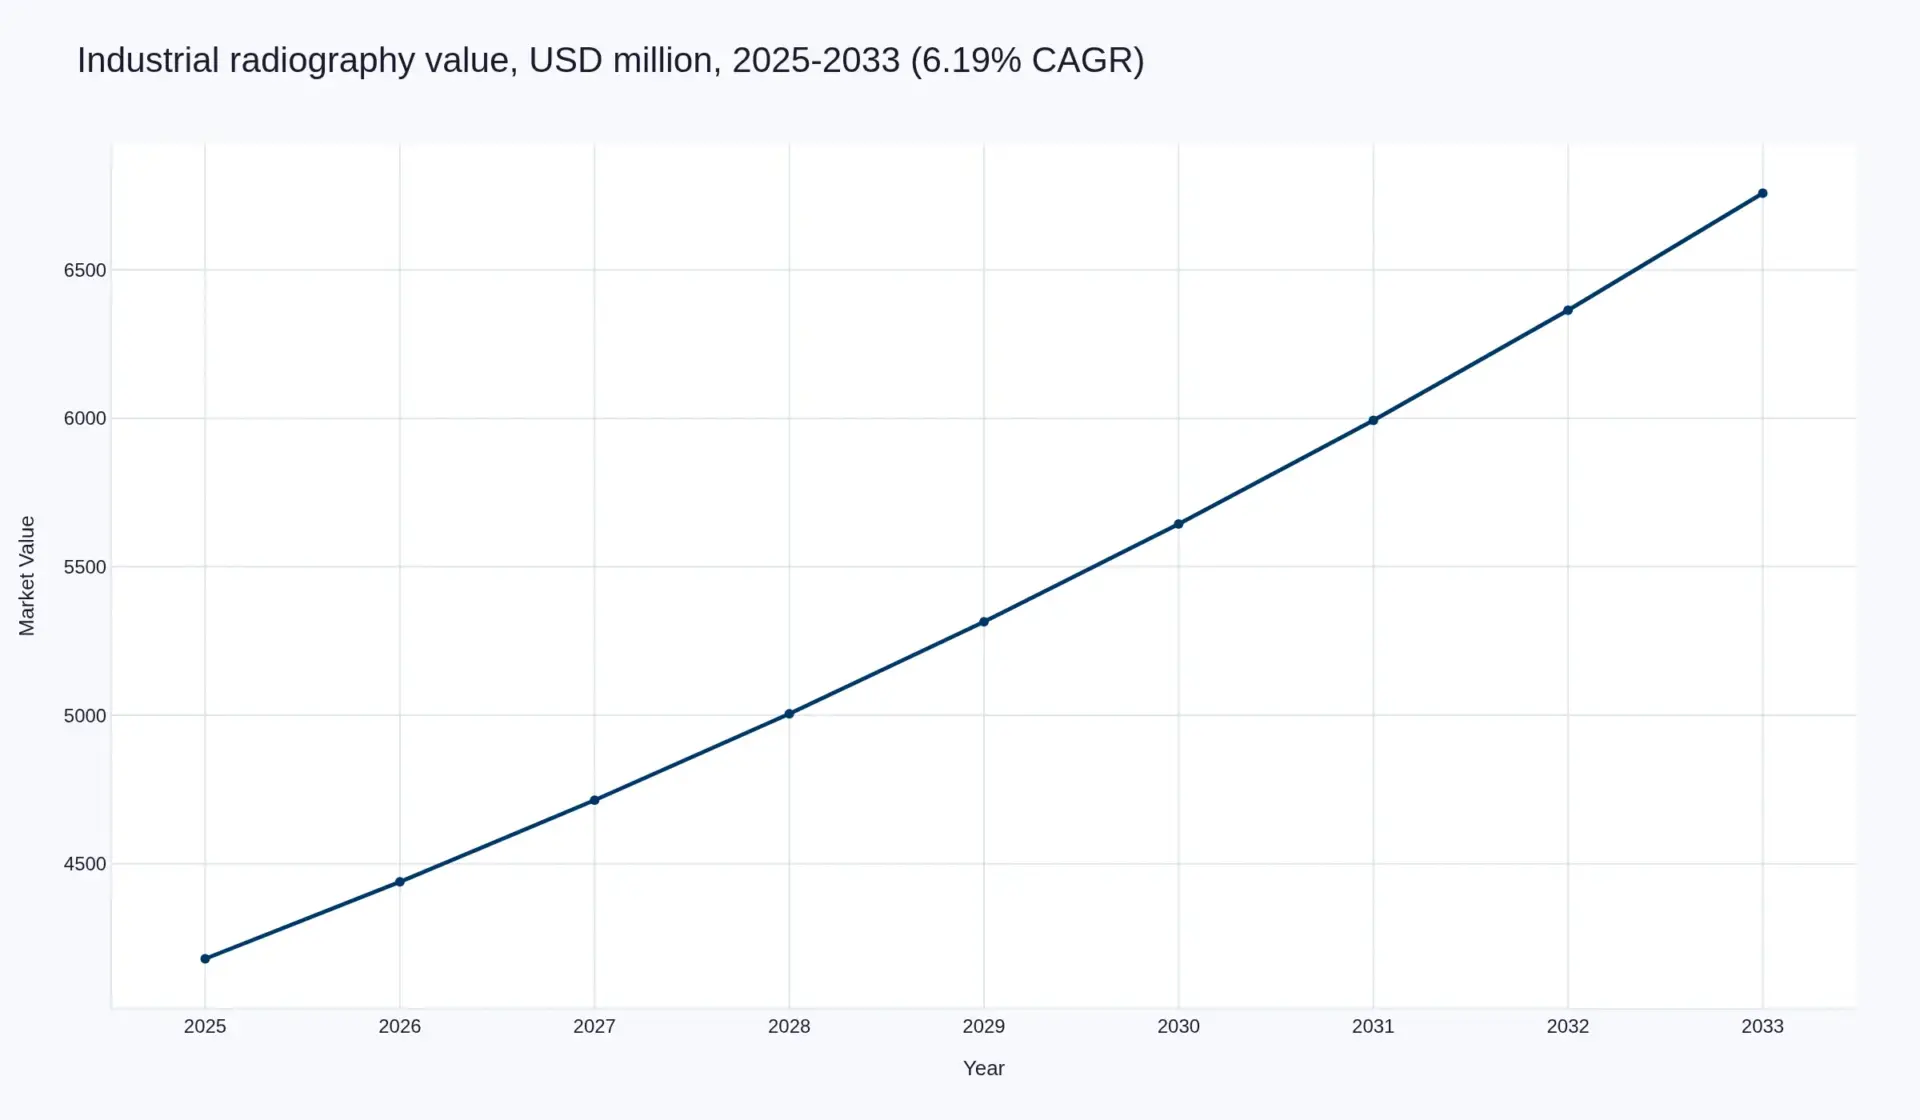
The global industrial radiography and digital X-ray inspection market is worth USD 4,180 million in 2025 across an installed base of 61,100 radiographic imaging chains, and reaches USD 6,760 million in 2033 — a value CAGR of 6.19 per cent. Chain count grows only 1.14 per cent over the same period. Almost the entire increment comes from what each chain costs to run, not from how many of them exist.
That distinction is the report. Decomposed, the USD 2,580 million of additional value splits into USD 397 million from volume (15.4 per cent) and USD 2,184 million from realisation and mix (84.6 per cent). Realised spend per imaging chain rises from USD 68,410 to USD 101,050, a 5.00 per cent CAGR.
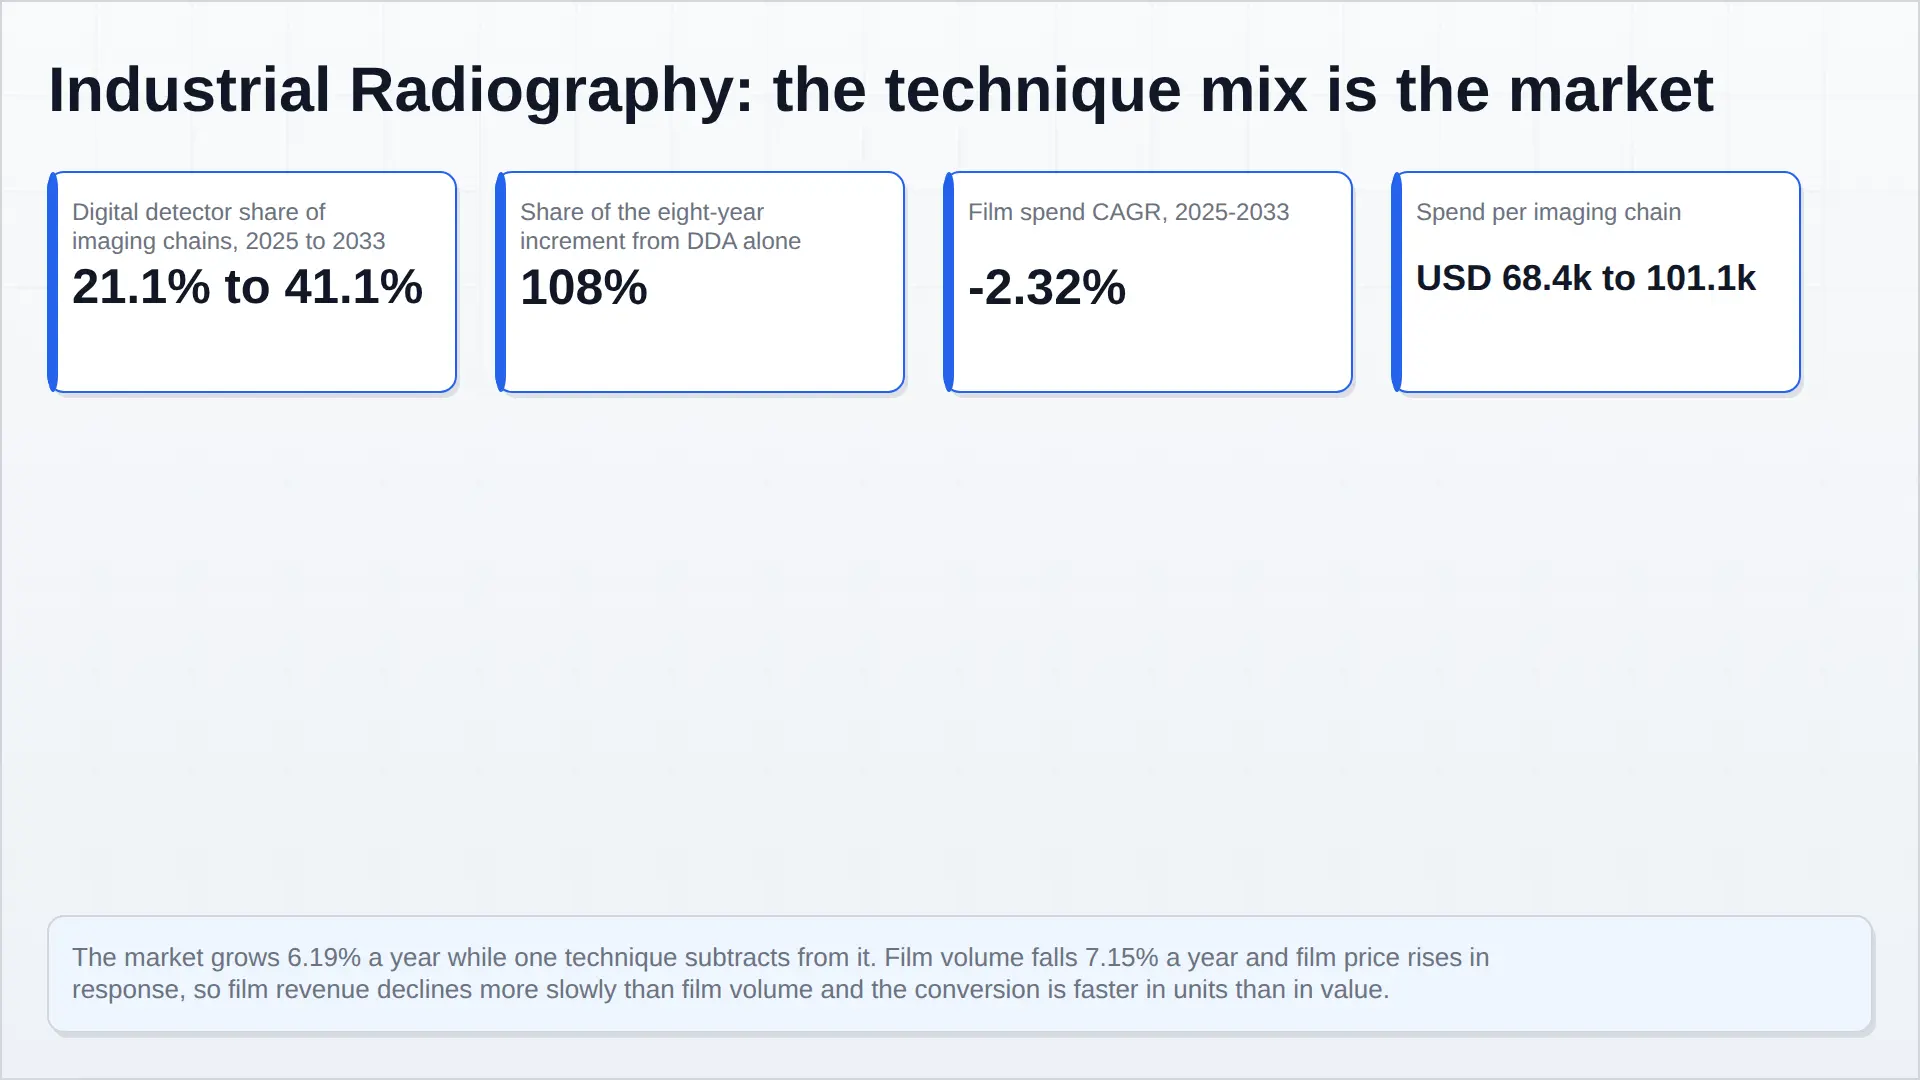
The mechanism underneath is a technique substitution with three very different parts. Film loses 7.15 per cent of its chain count every year and still only loses 2.32 per cent of its revenue, because film price rises 5.20 per cent in response to the same commodity pressure that is driving buyers off it. Computed radiography is the stranded middle: it grows volume at 1.76 per cent, deflates at 0.43 per cent, and ends with 1.32 per cent revenue growth and a falling share of the market. Digital detector arrays — chains growing 9.92 per cent, price and mix adding 2.56 per cent — compound at 12.74 per cent and deliver 108.3 per cent of the net increment, because film subtracts from it. Digital detectors move from 21.1 to 41.1 per cent of installed chains and from 41.5 to 67.0 per cent of value.
The conversion is not being driven by image quality. It is being driven by film becoming hard to buy: Kodak's exit left a single primary supplier, NASA's NESC documented film as "nearing extinction" while assessing its replacement for Orion, and Carestream repriced its entire non-destructive testing film line worldwide in April 2024 citing silver, energy and raw materials after absorbing those costs for a period. Set against a silver market that rose 147 per cent in 2025 and touched an all-time high above USD 121 an ounce in January 2026, the substitution is a supply and cost event with a date on it, not a technology preference.
The second constraint is labour. In EPRI's 2024 survey of 82 nuclear-sector NDE professionals, 37 per cent expected to retire by 2030 and a further 24 per cent within the following decade — 61 per cent of that workforce within sixteen years — and 60 per cent said the industry would not have enough NDE personnel to meet future needs. The ASNT Foundation's 2025 Economic Impact of NDT report puts 42 per cent of the US NDT workforce at 45 or older. Digital radiography's commercial case is man-hours per inspection and the elimination of film handling, chemistry and re-shoots; that case strengthens every year the workforce ages.
Regionally, Europe and North America hold 53.0 per cent of 2025 value but supply only 44.6 per cent of the increment. China grows 7.23 per cent, India 10.92 per cent and the rest of Asia-Pacific 7.60 per cent, on fabrication volume that digital adoption has not yet reached. By end-market, oil and gas remains the largest single buyer at 21.5 per cent of 2025 value but grows slowest at 4.22 per cent, while additive and advanced manufacturing grows 12.02 per cent from the smallest base.
The two structural facts a buyer should carry: first, the codes do not force the conversion — ISO 17636-2, ASME Section V Mandatory Appendix IX and ASTM E2698 each permit digital techniques at film-equivalent sensitivity, which means permission is granted contract by contract, and the conversion therefore advances at the speed of procurement documents rather than at the speed of technology. Second, the firms best placed to convert an inspection department are frequently the firms selling it film: Waygate Technologies sells STRUCTURIX radiographic film alongside its Phoenix|x-ray radiography and CT systems. That is not a conspiracy, it is a portfolio, and it is the reason the film-to-digital transition is slower in practice than the cost case alone would predict.
1. Overview: what this market is, and the one number that decides it
Industrial radiography is the part of non-destructive testing that looks through a part rather than at it — X-ray and gamma photons passed through a weld, a casting, a composite layup or an assembled component and captured on the other side. It is the technique of record for internal soundness, and inside the wider inspection market it occupies the same position that audited financial statements do in accounting: slower and more expensive than the alternatives, but accepted without argument by the people who have to sign off.
This report measures the value of industrial radiographic inspection as delivered: equipment (sources, detectors, computed radiography readers, cabinets and manipulation, acquisition and reconstruction software), media and consumables (film, chemistry, imaging plates), and the associated service and support. Medical and security imaging are excluded — different buyers, different codes, different procurement — as is analytical X-ray (diffraction and fluorescence), which measures composition rather than soundness. The volume measure is the radiographic imaging chain: one radiation source with its associated detection path and handling, whether that path is a film cassette, an imaging plate or a detector array.
Why the technique split matters more than the market size
A topline growth rate in this market hides everything worth knowing. Our central figure of 6.19 per cent for 2025 to 2033 is an aggregate of three technique layers moving in three directions at once — one shrinking in units and revenue, one treading water, one compounding at close to thirteen per cent. They have different buyers, different price behaviour, different competitive structures and different capital requirements. A strategy written against the aggregate will be wrong for all three.
So the model is built as a decomposition rather than a forecast: installed imaging chains × technique take-rate × realised spend per chain, split by technique, region and end-market. Every input is either a supplier-documented figure, a code requirement, a published agency finding, or an explicitly labelled Pheonix construction. Where a conclusion is ours — the concentration estimate in the competitive chapter, the margin allocation in the value chain, the incentive problem that slows the film transition — the report says so and gives the reasoning.
What is in scope, and what a reader should not add to this number
- In scope: industrial X-ray and gamma sources; film and processing chemistry; computed radiography plates, scanners and consumables; digital detector arrays; industrial computed tomography; manipulation, cabinetry, shielding and software; radiographic inspection service and support tied to these systems.
- Out of scope, deliberately: ultrasonic, eddy current, magnetic particle, penetrant, leak and visual inspection (separate reports in this segment); dimensional metrology (a separate report); medical radiography; security and baggage screening; analytical X-ray; and semiconductor wafer inspection.
- Not additive with medical imaging. Detector physics overlap heavily between industrial and medical radiography — the same suppliers often make both — but the pricing, replacement cycle and regulatory burden are different enough that adding the two produces a number that describes nothing.
2. Market size, forecast and the technique split, 2025–2033
The global industrial radiography and digital X-ray inspection market is worth USD 4,180 million in 2025, across 61,100 radiographic imaging chains, and reaches USD 6,760 million in 2033 across 66,900 chains. That is a value CAGR of 6.19 per cent and a volume CAGR of 1.14 per cent. Realised spend per chain rises from USD 68,410 to USD 101,050, a 5.00 per cent CAGR.
| Layer | Chains 2025 | Spend 2025 (USD m) | Spend per chain 2025 (USD) | Chains 2033 | Spend 2033 (USD m) | Spend per chain 2033 (USD) | Revenue CAGR |
|---|---|---|---|---|---|---|---|
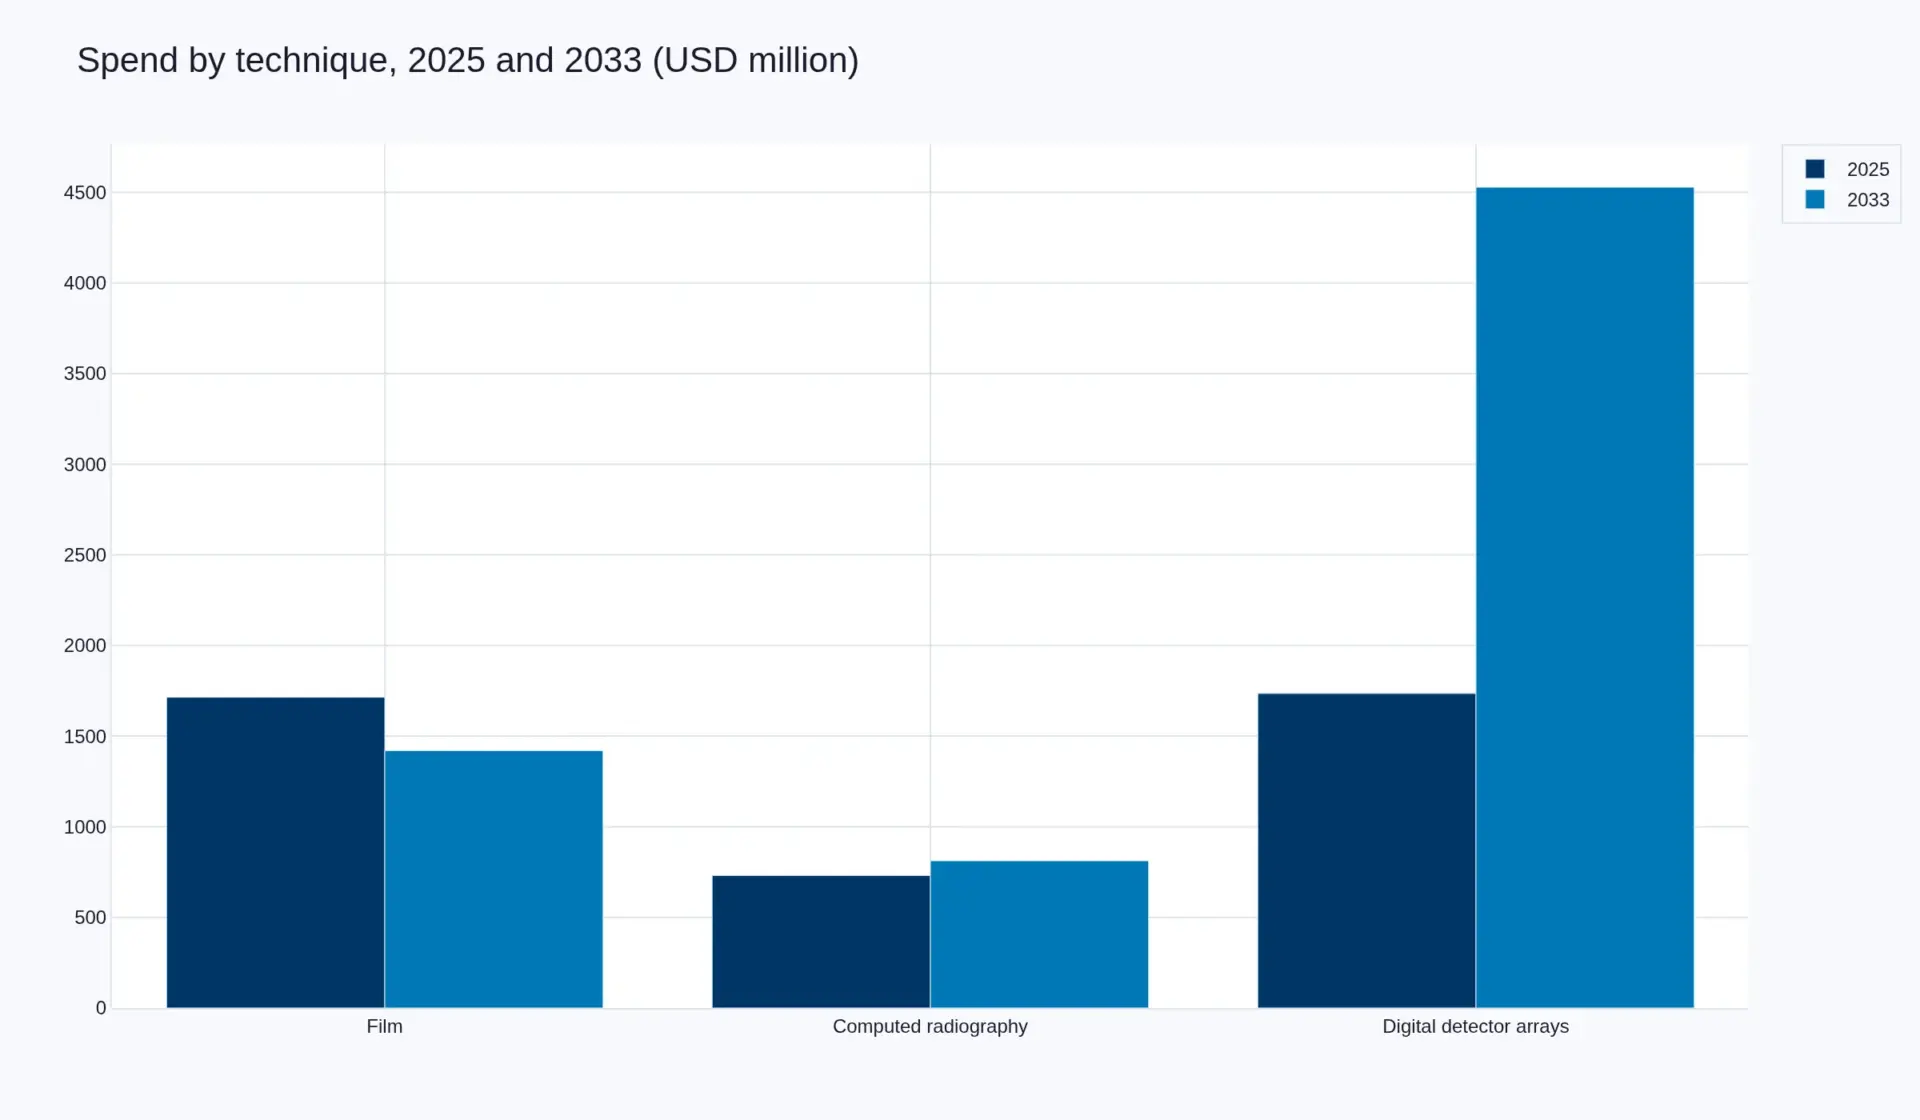
| Film | 26,800 | 1,714 | 63,955 | 14,800 | 1,420 | 95,946 | −2.32% |
| Computed radiography | 21,400 | 731 | 34,159 | 24,600 | 812 | 33,008 | +1.32% |
| Digital detector arrays | 12,900 | 1,735 | 134,496 | 27,500 | 4,528 | 164,655 | +12.74% |
| Total | 61,100 | 4,180 | 68,410 | 66,900 | 6,760 | 101,050 | +6.19% |
Read the technique shares instead of the totals and the market stops looking like a growth story and starts looking like a migration. Film holds 43.9 per cent of chains and 41.0 per cent of value in 2025; by 2033 it holds 22.1 per cent of chains and 21.0 per cent of value. Computed radiography goes from 35.0 to 36.8 per cent of chains while its value share falls from 17.5 to 12.0 per cent — the clearest diagnostic of a stranded middle. Digital detector arrays go from 21.1 to 41.1 per cent of chains and from 41.5 to 67.0 per cent of value.
Where the increment comes from: 84.6 per cent of it is not volume
The USD 2,580 million of additional value between 2025 and 2033 decomposes into USD 397 million from volume — 5,800 additional chains at the 2025 realised rate — and USD 2,184 million from realisation and mix, or 84.6 per cent of the increment. That ratio is the single most important number in this report, and it has a specific cause: the same chain is being made to carry more value.
Three mechanisms produce it. Wear and reliability content rises as systems are specified for longer duty cycles; format and energy move up as the work moves toward thicker sections and denser materials; and automation and software content per system rises faster than hardware content, because a production radiography cell now includes manipulation, automated defect recognition, reconstruction and DICOM/DICONDE traceability. On the technique breakdown: digital detector arrays add USD 2,793 million, film subtracts USD 294 million, computed radiography adds USD 81 million — the array line alone delivers 108.3 per cent of the net increment.
Regional split
| Region | 2025 | Share 2025 | 2033 | Share 2033 | CAGR |
|---|---|---|---|---|---|
| Europe | 1,149.5 | 27.5% | 1,622.4 | 24.0% | 4.40% |
| North America | 1,065.9 | 25.5% | 1,656.2 | 24.5% | 5.66% |
| China | 773.3 | 18.5% | 1,352.0 | 20.0% | 7.23% |
| India | 250.8 | 6.0% | 574.6 | 8.5% | 10.92% |
| Japan | 229.9 | 5.5% | 304.2 | 4.5% | 3.56% |
| Rest of Asia-Pacific | 376.2 | 9.0% | 676.0 | 10.0% | 7.60% |
| Rest of world | 334.4 | 8.0% | 574.6 | 8.5% | 7.00% |
| Total | 4,180.0 | 100% | 6,760.0 | 100% | 6.19% |
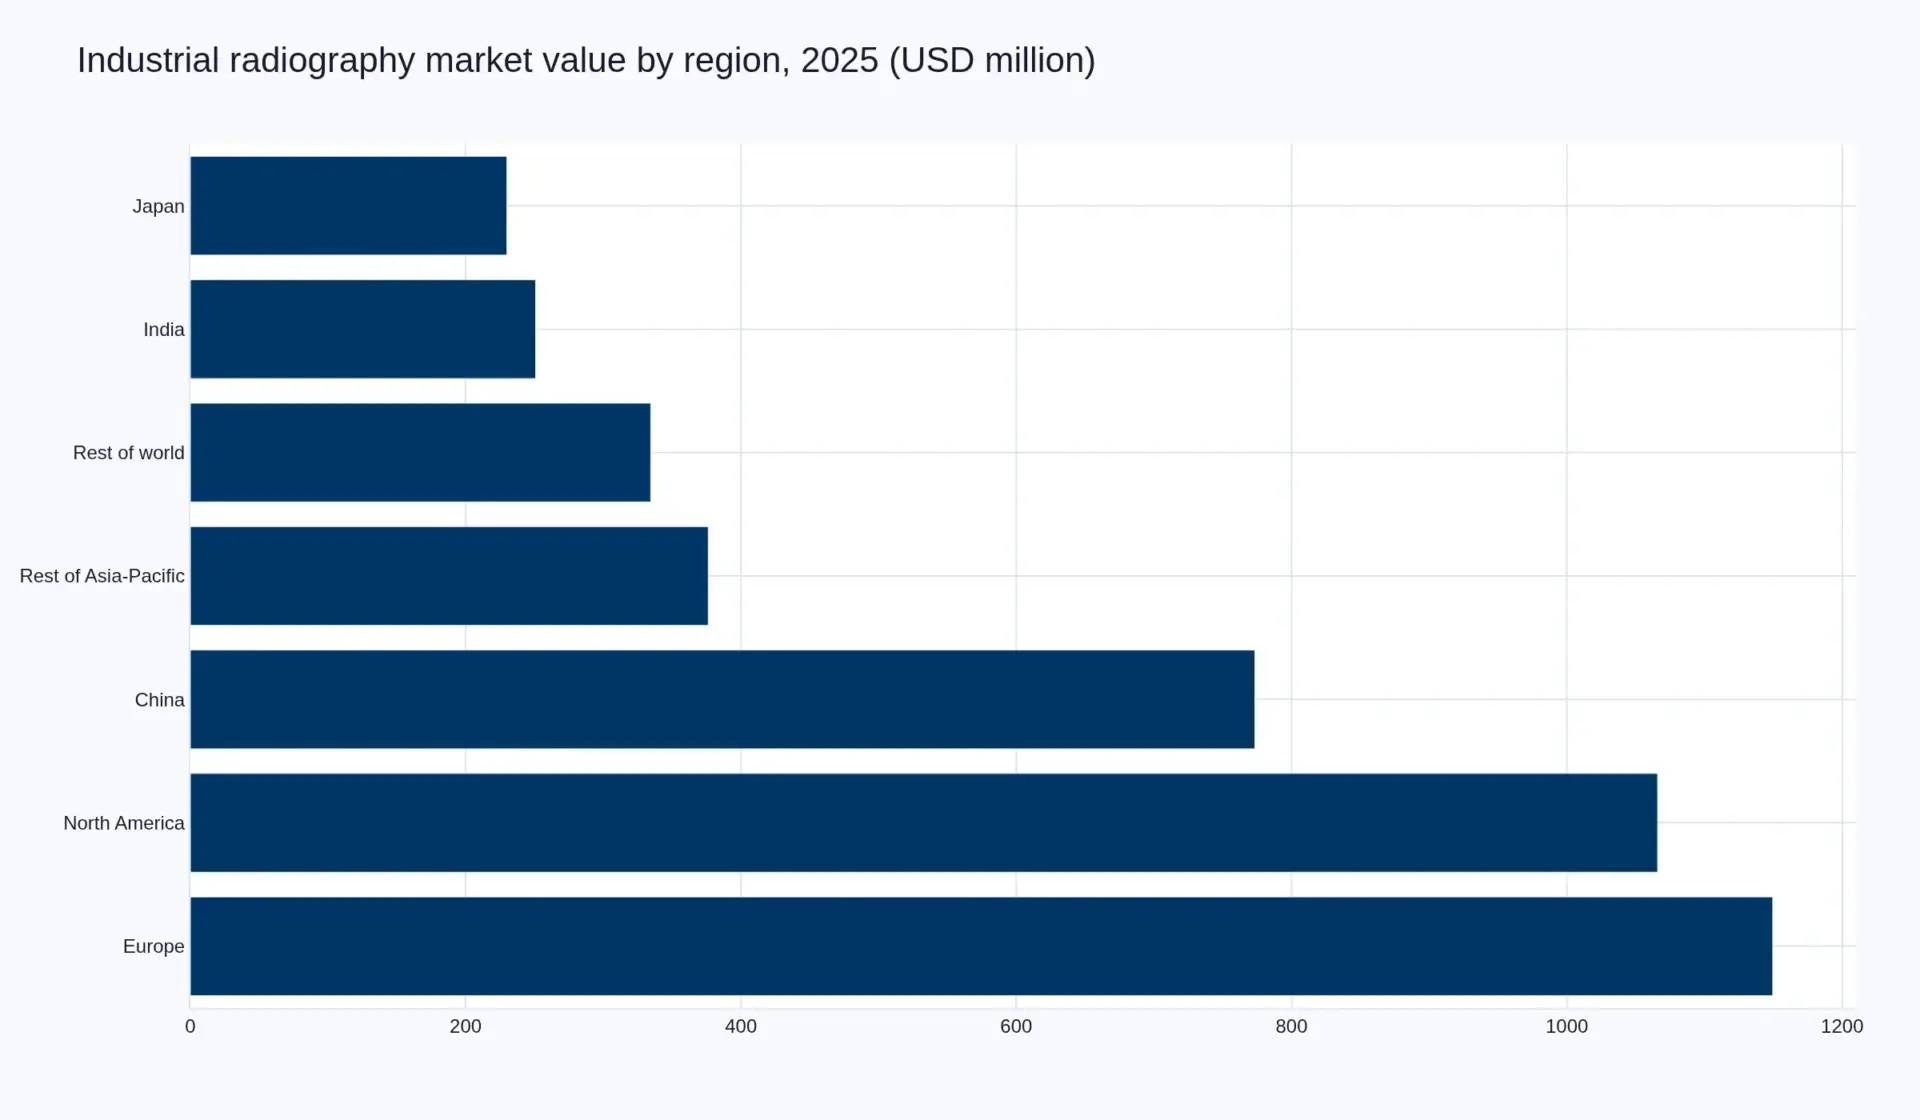
Europe and North America hold 53.0 per cent of 2025 value but supply only 44.6 per cent of the increment — Europe's 4.40 per cent is the slowest rate in the table, and it is slow for a reason: Europe is where the conversion is furthest advanced, so a larger share of its spend is already on the cheaper-per-chain digital layer with less film annuity left to lose. The growth sits in fabrication volume that digital has not yet reached. India at 10.92 per cent and China at 7.23 per cent are the two large markets where chain count is still expanding faster than technique substitution is deflating spend per chain, and the rest of Asia-Pacific at 7.60 per cent behaves the same way from a smaller base. Japan's 3.56 per cent is the profile of a mature, fully equipped industrial base with a shrinking fabrication footprint.
End-market split
| End-market | 2025 | Share 2025 | 2033 | Share 2033 | CAGR |
|---|---|---|---|---|---|
| Oil & gas, pipelines and corrosion under insulation | 898.7 | 21.5% | 1,250.6 | 18.5% | 4.22% |
| Aerospace structures, engines and castings | 773.3 | 18.5% | 1,318.2 | 19.5% | 6.89% |
| Power generation — nuclear and conventional | 585.2 | 14.0% | 1,047.8 | 15.5% | 7.55% |
| Automotive and ground transport castings | 564.3 | 13.5% | 811.2 | 12.0% | 4.64% |
| Additive and advanced manufacturing | 313.5 | 7.5% | 777.4 | 11.5% | 12.02% |
| Defence and marine | 459.8 | 11.0% | 811.2 | 12.0% | 7.35% |
| Other (construction, chemicals, electronics) | 585.2 | 14.0% | 743.6 | 11.0% | 3.04% |
| Total | 4,180.0 | 100% | 6,760.0 | 100% | 6.19% |
Oil and gas is still the largest single buyer at 21.5 per cent and the slowest-growing large segment at 4.22 per cent, for a structural reason: pipeline and refinery radiography is field work, done on gamma isotopes in conditions where a flexible cassette and a physical image have real operational advantages, and it is governed by contract-by-contract acceptance. Aerospace and power generation both grow faster than the market because both convert on written, reusable qualifications — a prime's specification or a utility's procedure — rather than on every contract. Additive and advanced manufacturing is the fastest line in the table at 12.02 per cent and is the one segment where the buyer's requirement is volumetric almost by definition, which makes it a computed tomography market rather than a radiography one.
Scenarios
| Scenario | 2033 value (USD m) | CAGR | What has to be true |
|---|---|---|---|
| Conservative | 6,050 | 4.73% | Digital qualification stalls in oil and gas and general fabrication for two to three years; film pricing eases as silver retreats, cutting the film revenue line faster |
| Base | 6,760 | 6.19% | Conversion continues at the observed rate; film price keeps passing through metal cost; detector content per system keeps rising |
| Optimistic | 7,520 | 7.62% | Automated defect recognition shortens the qualification path; detector supply concentrates enough to add pricing power; additive manufacturing scales faster than modelled |
What would falsify the forecast
The realisation line carries 84.6 per cent of the increment, so it is the line to attack. Evidence that detector price per unit is falling without a matching rise in system and software content would break it; so would evidence that the film line is being invested in rather than harvested, which would change the shape of the film revenue decline. The volume line, at 1.14 per cent, is the more robust of the two — it is anchored to fabrication capacity and to a certified-inspector population that is shrinking, both of which are easier to observe than price.
Articles on this market
- Film Lost Seven Per Cent of Its Units a Year and Two Per Cent of Its Revenue. The Difference Is the Story. — why the film line's revenue declines at half the rate of its volume, and what that does to the market's topline.
- Sixty-One Per Cent of the Nuclear NDE Workforce Leaves Within Sixteen Years. That Is a Radiography Forecast. — the certified-labour constraint treated as a modelled input rather than a narrative risk.
Press release: Industrial Radiography Grew 6.19 Per Cent and 84.6 Per Cent of It Was Price and Mix.
Table of Contents
Competitive Landscape
3. Competitive landscape: three arenas, one incumbent dilemma
“Who competes in industrial radiography” is the wrong question, because the market is really three arenas with different participants and different economics. Conflating them produces the standard error in this sector: attributing a systems integrator’s share to a detector maker, or a film producer’s installed base to a company that has never sold a consumable.
Arena one: physics, meaning tubes, generators and high-energy detection
This is the smallest population and the highest barrier. It requires the ability to make X-ray sources that survive industrial duty cycles and detectors that survive high-energy radiation without degrading — Teledyne’s own description of why it agreed to acquire Varex is precisely this gap: it produces X-ray detectors, but not detectors suited to high-radiation environments, and it produces vacuum electronics but has never produced X-ray tubes for radiography. Teledyne ICM, based at Andrimont in Belgium, makes portable X-ray generators and digital radiography systems specifically for non-destructive testing, with roughly fifty staff and the overwhelming majority of turnover exported; Teledyne DALSA supplies industrial X-ray detectors across CCD, CMOS and IGZO technologies, including detectors sold explicitly for NDT.
Arena two: systems, software and service delivery
The largest population and the most visible brands. Waygate Technologies, a Baker Hughes business, sells the Phoenix|x-ray range of 2D radiography and computed tomography systems from entry-level microfocus cabinets to nanofocus CT and 3D metrology platforms, and runs customer solutions centres that sell inspection by the hour, the scan or the project. North Star Imaging sells digital radiography systems with motion programming and automated defect recognition into foundry and aerospace production. Dürr NDT sells computed radiography scanners and imaging plates. Comet’s Yxlon business and Nikon Metrology both compete in industrial CT and radiography cabinets. The common feature is that none of them owns a differentiating physics layer exclusively, so competition runs on throughput, automation, software and service reach rather than on the detector.
Arena three: media, meaning film and plates
Concentrated almost to the point of single points of failure. Carestream sells the INDUSTREX line across grain classes from DR50 to AA400 and repriced the entire global NDT film range in April 2024. Waygate Technologies sells the STRUCTURIX film family — built on what the product documentation still describes as an Agfa emulsion technology — from ultrafine to high-speed, in sheets, rolls and vacuum-sealed packs, and states that the range is compliant with the German Federal Institute for Materials Research and Testing’s industrial film classification. That a firm whose principal business is selling the digital alternative also sells and certifies the film is the single most important structural fact in this chapter.
Concentration: our estimate, and why it is an estimate
Adding up share in this market from the outside is not possible with precision, because a large share of value moves through privately held systems integrators, national distributors and third-party inspection contractors who do not report segment revenue. Our estimate — and it is ours, labelled as such — is that the eight largest suppliers of radiography equipment, detectors and film together account for roughly 55 to 60 per cent of equipment and media value, with the remaining 40 to 45 per cent spread across a long tail of regional integrators and specialist CT houses. The service layer is a different distribution entirely: thousands of accredited firms, no participant above a low single-digit share globally, and consolidation driven by certification scarcity rather than by scale economics. The denominator is not observable, which is why we state a range and the reason for it rather than a point figure.
The incumbent dilemma
Both major film lines in this market sit inside organisations that also sell the digital replacement — Waygate explicitly, Carestream across a digital and film NDT catalogue. This is not a conflict of interest in any improper sense; it is a portfolio decision, and it produces a predictable behaviour. A firm that earns an annuity on a consumable and a capital sale on the substitute has no reason to accelerate the substitution faster than the consumable’s own economics require, and every reason to manage it in the order that preserves the annuity longest. For a buyer, the practical implication is that the supplier best placed to convert an inspection department may not be the one most motivated to do it quickly, and that the timing of a conversion is more often set by film supply and price than by the technology on offer. For a competitor, it is the opening: the conversion is available to be taken by anyone willing to price it on cost per accepted inspection rather than on system specification.
Value Chain
4. Value chain and where the margin actually sits
Industrial radiography is unusual among inspection markets in how clearly its value chain separates into layers that price differently. Six layers, in order of physical precedence.
| Layer | What it is | Concentration | Margin character |
|---|---|---|---|
| 1. Physics and materials | X-ray tube and generator design, high-voltage components, scintillator materials, photodiode arrays, phosphor for imaging plates, silver halide emulsion and film base, radioisotope sources | Highest — a handful of firms globally for high-energy tubes and for photon-counting detectors | Structural. Protected by process know-how and by radiation-hard design, not by patent alone |
| 2. Detector and media componentry | Flat-panel detectors (amorphous silicon, IGZO, CMOS), linear diode arrays, computed radiography plates and readers, film in all grain classes | High upstream, moderate at the plate and reader level | Good on detectors; annuity-like on film and plates; deflating on CR readers |
| 3. Systems integration and software | Cabinets and shielding, manipulation and robotics, acquisition and reconstruction software, automated defect recognition, DICONDE archiving, traceability and reporting | Moderate and rising | The growth margin. Software content per system is increasing faster than hardware content |
| 4. Consumables | Film sheets and rolls, processing chemistry, imaging plates, lead screens and cassettes, source replacement | Very high in film, which is the point of the chapter | Historically the best margin in the chain, and the one being repriced upward as volume leaves |
| 5. Inspection service | Third-party NDT contractors, certified personnel, mobilisation, reporting | Very low — thousands of accredited firms, national and regional | Labour-arbitrage margin, compressed by a certified-inspector shortage |
| 6. End user | Fabricators, foundries, aero-engine and airframe manufacturers, pipeline operators, utilities, additive manufacturers, defence depots | Fragmented to concentrated by vertical | Bears the compliance cost; captures the avoidance of scrap, rework and failure |
The margin allocation, and why it is shifting down the chain
Our reading of supplier documentation and specification sheets puts the largest gross margin in the chain at the consumable layer — film and imaging plates — and the second largest at the physics layer, with systems integration third and service last. That ordering has held for two decades and is now reversing at the top. Film carries a repriced annuity that is shrinking in square metres; detector arrays carry a hardware line with falling unit cost but rising per-system content because the systems around them are getting bigger, faster and more automated.
The consequence for anyone modelling this market: a supplier whose revenue sits in layer 1 or 2 grows with the conversion, a supplier whose revenue sits in layer 4 declines with it, and a supplier sitting in layer 3 grows faster than either because the software and automation content per system is expanding on top of a slowly growing base of systems. Our realisation figure of USD 68,410 rising to USD 101,050 per chain is the aggregate of those three directions, and it is why the market’s topline growth of 6.19 per cent is compatible with a chain count growing 1.14 per cent.
The piece most often mispriced: the cost of the inspection itself
Almost every published discussion of industrial radiography prices the technology and ignores the workflow. In practice the buyer’s decision variable is cost per accepted inspection, and that number is dominated by set-up time, re-shoots and the labour grade required to interpret the image. North Star Imaging’s own case documentation of a foundry conversion puts the arithmetic plainly: a film exposure on an aluminium casting takes roughly 30 seconds with at least another 30 seconds of set-up including tube ramp and door time, against around 3 seconds of imaging time on a digital system with no set-up and no downtime between acquisitions, and it reports a four to ten times improvement in speed from motion-programmed digital inspection alone. That is where the labour shortage in the risk chapter converts into a purchase order.
Investment Activity
5. Investment activity: capital is buying the detector, not the film
Capital in this market is not evenly distributed across the value chain, and where it is going is the clearest forward-looking signal available.
The transaction that defines the cycle
Teledyne Technologies and Varex Imaging entered a definitive merger agreement on 10 August 2026 at USD 18.90 per share in cash, an aggregate value of approximately USD 1.1 billion. Varex stockholders adopted the agreement at a special meeting on 28 October 2026, with 32,534,030 of 42,463,446 shares outstanding at the 16 September record date present or represented — approximately 77 per cent — and both the merger proposal and the compensation proposal approved on the final certified count filed on 29 October. Closing remains subject to regulatory clearance and is anticipated in early 2027.
The strategic logic is stated in Teledyne’s own words and it is worth quoting precisely, because it describes the shape of the whole market: the company produces X-ray detectors, but does not provide detectors suited for high-radiation environments; only Varex provides advanced photon counting detectors for healthcare and industrial inspection; and while Teledyne produces vacuum electronics such as magnetrons, it has never produced X-ray tubes for radiography. A tube plus a radiation-hard detector plus a generator plus software is a complete imaging chain. That is what is being bought.
The segment arithmetic that justifies it
Teledyne’s Form 10-Q for the quarter ended 27 September 2026 shows Digital Imaging net sales of USD 903.0 million, up 15.0 per cent year on year, against group net sales of USD 1,684.9 million, up 9.4 per cent — so the imaging segment is 53.6 per cent of the company and growing at more than one and a half times the group rate. Segment operating income was USD 182.7 million, up 48.1 per cent. For the nine months, Digital Imaging sales were USD 2,588.6 million against USD 2,313.4 million, up 11.9 per cent.
Two things follow. First, the margin expansion is larger than the revenue expansion by a wide margin, which in an instrumentation business usually means mix moving toward higher-content systems and software rather than volume leverage alone. Second, a company with more than half its revenue in digital imaging and a demonstrated willingness to pay USD 1.1 billion for the missing physics layer has made a public bet that inspection demand grows. That bet is a demand-timing bet, and it is the kind of bet a bought market study is meant to underwrite.
Where capital is not going
Nothing in the evidence suggests investment is flowing into film capacity. The observable behaviour is the opposite: incremental repricing rather than expansion. Carestream’s April 2024 announcement states that the company had absorbed increases in raw material and energy costs, had made ongoing improvements in film manufacturing and supply chain, and had “only now begun to raise prices in response to the commodity driven market conditions”. That is the language of an asset being managed for cash rather than grown. NASA’s NESC assessment is more direct still: Kodak had all but stopped production, one primary supplier remained, and the material was becoming prohibitively expensive.
A rational allocation follows: capacity, R&D and M&A capital go to detectors, high-energy sources and software, because those layers grow; film is harvested, because it does not. Investors should expect the film line to keep producing revenue that declines more slowly than its volume, and to keep doing so until the price mechanism can no longer offset the square metres leaving.
The service layer, and an inference we label as one
Third-party inspection services are where the certified-labour shortage bites hardest and where scale is least available. Our expectation — an inference from the workforce data rather than a documented transaction pattern — is that service capacity consolidates over this forecast window as certification becomes the binding constraint, and that the buyers are as likely to be the equipment houses building a service annuity around their installed base as they are to be financial sponsors. The customer solutions centres operated by Waygate Technologies, selling inspection by the hour, scan or project, are the visible version of that model already running.
Technology & Innovation
6. Technology and the conversion: film, CR and the detector array
Three techniques share this market, and they are not three vintages of the same thing. They have different physics of capture, different cost structures and — decisively — different relationships to automation.
Film
A silver halide emulsion on a flexible base, exposed through lead screens and developed in chemistry. Its virtues are unchanged: it is flexible, it can be wrapped around complex geometry, it works across an enormous range of source energies including gamma isotopes in the field, and it produces a permanent physical record that a regulator or an insurer accepts without argument. Its problem is that it is a consumable made from a metal that has become expensive and from a manufacturing base that has consolidated to the point where a single supplier’s decision is a supply event. NASA’s NESC assessment of the Orion tube welds described film production as declining, Kodak’s radiographic film production as all but stopped, one primary supplier remaining, and the material as “getting prohibitively expensive”.
Computed radiography
A photostimulable phosphor imaging plate replaces the film in the cassette; the plate is exposed identically and then read by a laser scanner. Operationally it is the closest thing to film, which is exactly why it spread first: same exposure geometry, same source-to-film distance arithmetic, same physical flexibility, and a reusable plate instead of a consumable. Dürr NDT’s own comparison documentation sets out the trade: plates cost grams rather than kilograms and can be had up to roughly 35 cm by 200 cm against a fixed detector format, spatial resolution is selectable from around 30 microns upward, and one scanner can read plates from several bunkers at once — but time to image is minutes rather than seconds, re-shoots still happen through mispositioning and exposure error, and automation in manufacturing is not possible because the scanning step is separate.
That last point is why computed radiography is a bridge and not a destination, and it is visible in our numbers: CR chain count grows 1.76 per cent, realised spend per chain falls 0.43 per cent, and revenue grows 1.32 per cent while its share of value falls from 17.5 to 12.0 per cent. It captures the first step off film and loses the second step to the detector array.
Digital detector arrays
A scintillator coupled to a photodiode array, read directly, image in seconds. Dürr’s comparison puts detector life at 100,000-plus exposures against roughly 1,000 for a plate, image acquisition in seconds rather than minutes, and re-shoots as “nearly none” because the operator sees a live preview. The trade is real and worth stating: fixed formats, limited flexibility, kilograms rather than grams, restricted source flexibility because scintillator and shielding are built in, and a much higher capital cost per unit.
What has changed is not the detector. It is what surrounds it. Waygate Technologies’ own product documentation for its Phoenix Speed|scan CT64 scanner claims fully automated in-line scanning at four times the speed of earlier models and more than a hundred times the speed of conventional industrial fan-beam CT for large light-metal castings. Compute for reconstruction, robotic part handling, automated defect recognition and DICONDE-format traceability have turned a detector into a production cell — and a production cell is bought on throughput and headcount, not on image quality. That is the mechanism behind a 12.74 per cent revenue CAGR on a chain count growing 9.92 per cent.
Where the next conversion is already visible
Computed tomography is the clearest case. It is radiography turned volumetric, it needs the detector array, the compute and the manipulation together, and its natural customers are the ones whose parts cannot be sectioned — additively manufactured lattice and internal-channel geometry, composite structures, battery cells, castings with internal cores. Our end-market split shows additive and advanced manufacturing growing 12.02 per cent from 7.5 to 11.5 per cent of value, and that growth is almost entirely a CT phenomenon rather than a 2D radiography one.
The second conversion is subtler: automated defect recognition moving from a quality-department tool to the pass/fail decision itself. That shifts value from the detector to the software and, in time, from the inspection department to the production line — the same migration that machine vision has already completed. It is the reason we treat systems-and-software as the growth-margin layer in the value chain rather than a rounding item.
Market Risk
8. Market risk: the five things that could move this number
Five risks matter, in descending order of how much they would move the forecast.
1. The film price mechanism reverses, and takes the topline with it
The most exposed assumption in this model is not the detector line — it is the film line. Film revenue falls only 2.32 per cent a year while its chain count falls 7.15 per cent, and the entire difference is a 5.20 per cent realised price increase. That increase is a pass-through of a metal cost, not a pricing decision. Silver rose 147 per cent in 2025 after a 42 per cent rise in the annual average price, touched an all-time high above USD 121 an ounce on 29 January 2026 and then traded back to the mid-70s, according to Reuters and the Silver Institute. If silver retreats and film prices follow, film revenue falls at something closer to its volume rate, and the market’s topline growth falls by up to two percentage points with no change whatever in the digital story. Conversely, a further silver spike would support film revenue — perversely making the market look healthier while accelerating the conversion underneath it.
2. Certified labour runs out before the capital is deployed
The digital case is a labour case, and a labour case can fail in two directions. EPRI’s 2024 survey of 82 nuclear-sector NDE professionals found 37 per cent expecting to retire by 2030 and a further 24 per cent within the following decade — 61 per cent within sixteen years — with 60 per cent saying the industry would not have enough NDE personnel to meet future needs. The ASNT Foundation’s 2025 report puts 42 per cent of the US NDT workforce at 45 or older and calls it a demographic turning point. Digital raises output per certified person, which is the reason to buy it; but if the population of people who can be certified falls faster than productivity rises, inspection capacity becomes the constraint on the end markets themselves and the volume line in this model is too high. Note the ASNT’s response — a national apprenticeship programme approved by its board in 2026 — as evidence the industry sees the same risk.
3. Detector and tube supply concentrates, and realisation overshoots
Our model has realised spend per digital chain rising 2.56 per cent a year, driven by mix — larger formats, higher energies, more automation and software content. That is a mix assumption, not a pricing-power assumption. If tube and high-energy detector supply concentrates into one or two hands, as the logic of the Teledyne-Varex transaction suggests it might, pricing power could add to that figure. The effect is ambiguous for the market: higher value per chain lifts the value line, but slower unit adoption lowers it. We have not modelled a supply-driven price shock, and a reader who believes one is coming should raise the optimistic path above our USD 7,520 million rather than adjust the base.
4. Permission stalls
Because the codes permit rather than compel, conversion can be paused by any party in a contract chain — an end customer, an insurer, a notified body, or a prime’s specification committee. That is the mechanism behind our regional and end-market dispersion and it is also the largest source of timing error in the forecast. The specific risk is not that a digital technique is rejected on technical grounds; it is that a qualification is deferred because the commercial case for re-papering a contract this year is weaker than the cost of doing it. Any stall of two to three years across oil and gas and general fabrication would move the base case toward the conservative path of USD 6,050 million.
5. Computed radiography strands
CR is the least defensible layer in the model. It keeps the film workflow and loses the automation, and its realised spend per chain already deflates at 0.43 per cent. A faster-than-modelled collapse in CR prices would push buyers straight from film to detector arrays, which is good for the DDA line and neutral for the total — but a slower collapse would leave a generation of installed readers depreciating against a shrinking plate annuity. Suppliers with CR-heavy exposure are the most exposed balance sheets in this market, and the risk is under-appreciated because CR still looks like growth at 1.32 per cent.
What would falsify this report
Three observations would do it, and all are checkable. First, evidence that the film line is being invested in rather than harvested — capacity announcements, new coating lines, a film producer adding rather than exiting. Second, contract-level evidence that digital qualifications are being granted routinely without project-specific approval, which would make the conversion run at the speed of capital rather than the speed of paperwork. Third, a sustained fall in detector price per unit without a matching rise in system and software content, which would break the 84.6 per cent realisation share that carries the value forecast. If any of those appears, the number to revise is the realisation line, not the volume line.
Regulatory Landscape
7. Regulatory landscape: the codes permit, they do not compel
The most consequential thing about the regulatory layer in this market is what it does not do. No major code requires a fabricator to abandon film. What the codes do is establish that a digital technique is acceptable when it achieves equivalent sensitivity, and then leave permission to be granted contract by contract. That single architectural feature explains why the conversion in our model is fast in some verticals and glacial in others, and why two fabricators making the same weld to the same standard can be ten years apart on technique.
The digital permission, standard by standard
| Instrument | What it does | Practical effect |
|---|---|---|
| ISO 17636-2:2022 (corrected 2023) | Specifies digital radiography of fusion-welded joints in metallic materials with X- and gamma-rays, by computed radiography or digital detector arrays, manual or automated. Sets minimum practice requirements permitting “equivalent sensitivity for the detection of imperfections as film radiography” under ISO 17636-1, and states explicitly that it does not specify acceptance levels — those sit in ISO 10675. | The clearest technical permission available. Note the split: technique here, acceptance elsewhere |
| ASME BPVC Section V, Article 2 with Mandatory Appendix IX | Article 2 is the film rule set for pressure equipment, boilers and piping; Appendix IX adds digital detector requirements on top of it rather than replacing it. | Digital is an addition, not a substitution. If a contract cites Article 2 alone, written approval for Appendix IX is needed before the first exposure |
| ASTM E2698 with ASTM E2737 | Standard practice for digital detector array examination, with the companion practice for detector performance characterisation and long-term stability. | The route most often cited in aerospace and in contracts that specify ASTM. E2737 is the reason detector stability, not just resolution, is a procurement criterion |
| ASTM E2033 and ASTM E2445 | Practice for computed radiography examination, and the practice for CR system qualification and manufacturing control. | The bridge standard set. CR is qualified as a system, which is why a plate and a scanner are bought together |
| API 1104, 22nd edition, July 2021, Errata 1 September 2023 | Welding of pipelines and related facilities; Section 9 sets acceptance standards for non-destructive testing including 9.3 radiographic testing, with Annex A providing alternative acceptance standards for girth welds. | Governs the largest single radiography application by volume in oil and gas transmission, and the standard against which any digital pipeline proposal is argued |
| NASA-STD-5009 | Non-destructive evaluation requirements for fracture-critical metallic components. | Film radiography was among the first techniques written into it, per NASA’s own NDE technical fellow — which is why replacing it inside the agency required a formal assessment rather than a purchase |
| BAM industrial film classification (Germany) | Independent classification of industrial film systems by the German Federal Institute for Materials Research and Testing. | A film-side moat: suppliers cite BAM compliance as proof of consistent system performance, and it is one reason film retains credibility in critical welds |
Three consequences that follow from the architecture
The conversion advances at the speed of paperwork. Because permission is contract-specific, the constraint on a conversion is not the availability of a detector but the willingness of an end customer, an insurer or a notified body to accept a technique on a given job. That produces the pattern our end-market split shows: aerospace and power generation, where specifications are written by primes and utilities with engineering departments that can qualify a technique once and reuse it, convert relatively steadily; distributed pipeline and general fabrication work, where every contract is negotiated, converts in patches.
The technique-and-acceptance split is where disputes live. ISO 17636-2 governs how an image is made and ISO 10675 governs what counts as acceptable in it. A supplier can meet the first and fail the second, and the failure is an acceptance argument rather than a technique argument. Any business case for conversion that stops at image quality has not yet reached the decision the buyer actually has to defend.
Regulation is not the growth driver, and pretending otherwise misleads. There is no analogue in this market to a vehicle emissions standard that forces a component change on a date. The pressure is commercial — film availability and price, and the cost of certified labour — and it acts on procurement rather than on the statute book. We model it that way. A reader looking for a regulatory cliff edge in industrial radiography will not find one, and a forecast premised on one would be wrong.