
Editorial Article
Complaints Rose 25.21 Per Cent and the Reported Money Fell 1.54 Per Cent. Read That Again.
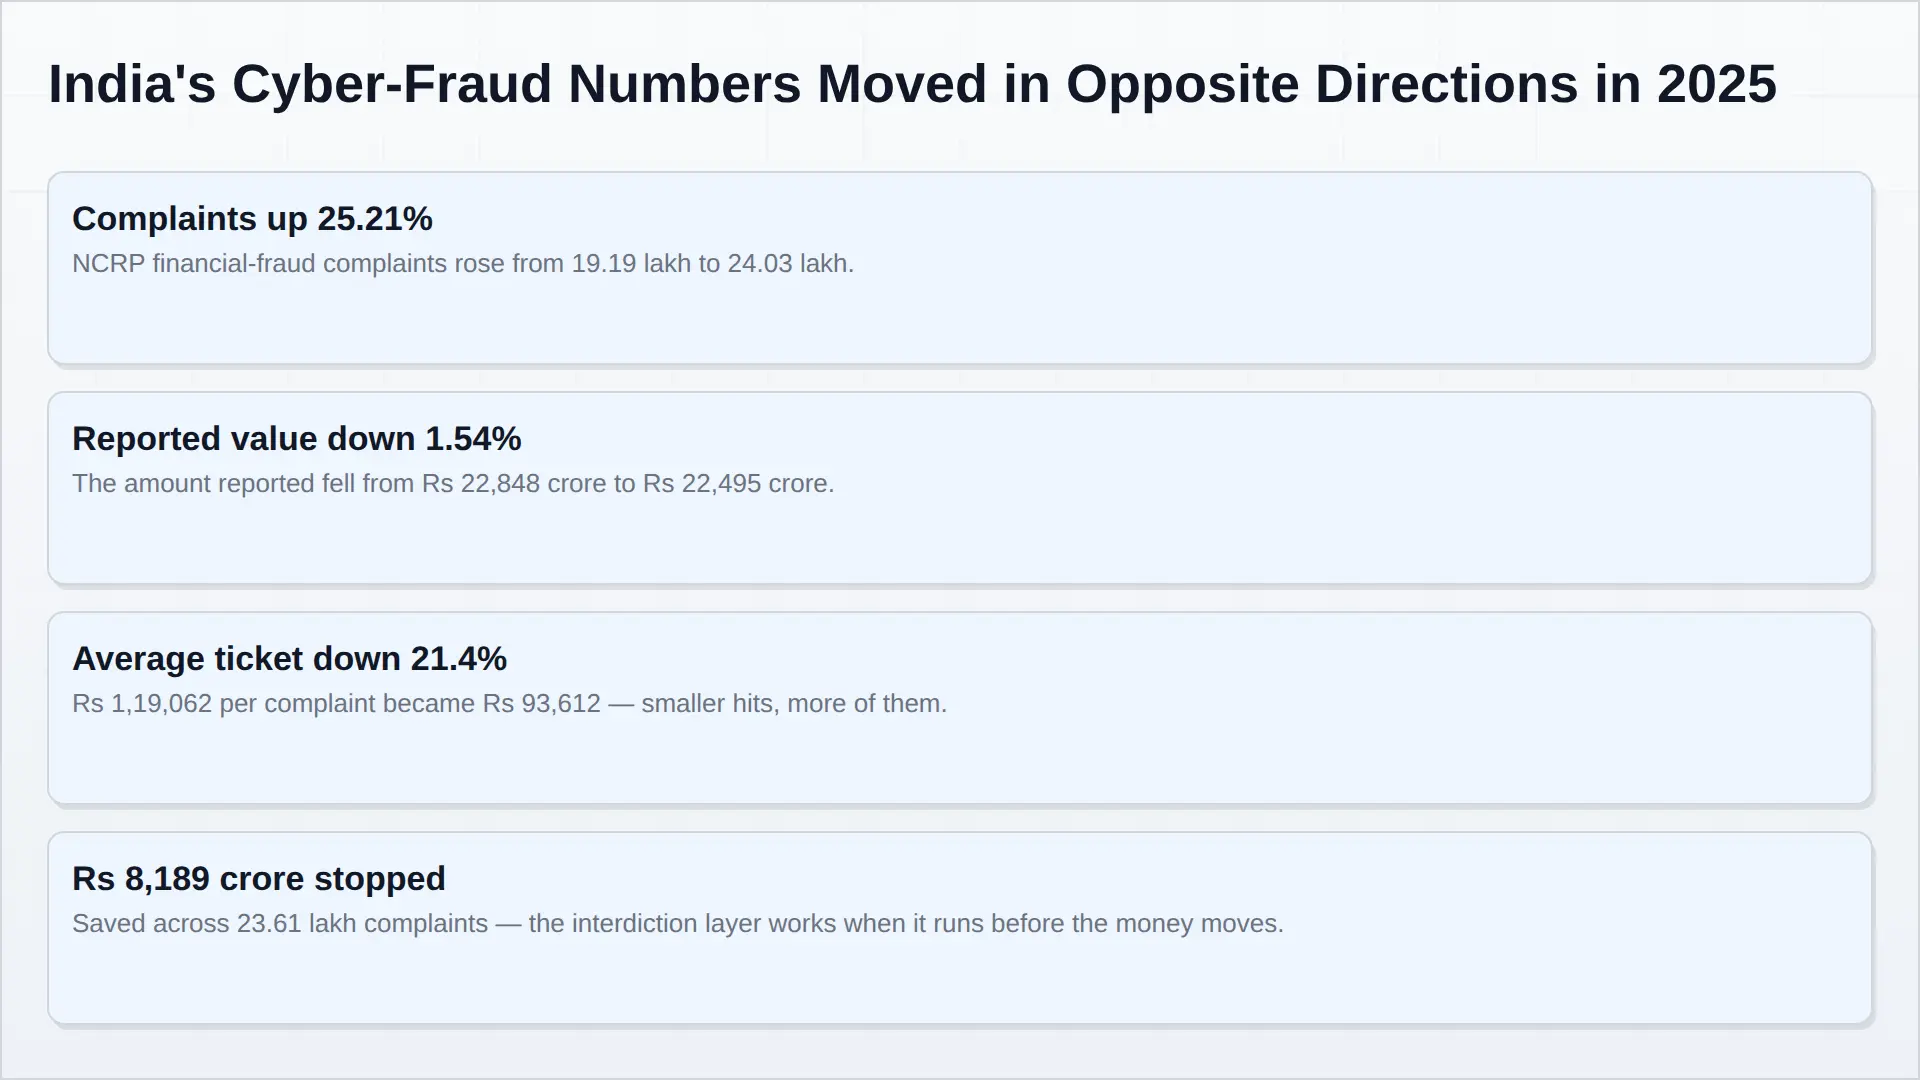
In 2025 India’s National Cyber Crime Reporting Portal recorded 24.03 lakh financial-fraud complaints, up 25.21 per cent from 19.19 lakh the year before. The amount reported in those complaints fell 1.54 per cent, from Rs 22,848 crore to Rs 22,495 crore. The average reported ticket went from Rs 1,19,062 to Rs 93,612 — down 21.4 per cent.
Most readings of a series like that pick one line and call it the story. The volume line gets read as an enforcement failure; the value line gets read as a success. Both readings are available from the same two numbers, which is usually a sign that neither is right. What the divergence actually describes is a change in the shape of the fraud — and shape, not size, is what determines where defensive money can rationally be spent.
Two explanations, and only one of them fits
If India’s defences had genuinely improved, the signature would be falling volume: fewer people defrauded, fewer complaints, and a value line that falls for the same reason. That is not what happened. Complaints rose by a quarter while the average loss per complaint fell by a fifth. A quarter more victims, each losing about a fifth less.
The competing explanation is that the fraud went industrial. It moved down-market to tickets small enough to pass beneath the thresholds banks set for manual review, small enough that a victim may decide reporting is not worth the afternoon, and small enough to be run at volume through rented mule accounts rather than orchestrated as one large theft. A heist has a size. A factory has a throughput.
The published series cannot prove which of those is happening. But 25 per cent more complaints is a difficult shape for an enforcement success to take, and that asymmetry should govern how the number is read.
The number that decides where the money goes
It is Rs 93,612. That is the expected loss attached to a single reported incident in 2025, and it is the figure against which every defensive rupee has to be justified.
Set it against the cost of defending a single transaction. A retail bank scoring every UPI authorisation in real time is buying compute, model maintenance, analyst capacity and — the expensive one — false-positive handling, because a wrongly declined payment is a customer complaint with a rupee value of its own. A control priced per transaction and justified per incident stops being defensible at a ticket size of Rs 93,612 the moment the false-positive rate is anything above negligible. The loss a single transaction can produce is a small fraction of a rupee in expectation; the control costs more than that fraction.
This is not an argument that retail fraud defence is uneconomic. It is an argument about where it has to sit. Anything that must be right for every transaction is infrastructure, and infrastructure is shared. The beneficiary-bank check, the mule-account graph, the device and SIM layer, the reporting spine: no single bank can build the mule graph, because the defining property of a mule network is that it spans institutions. Which is why the state’s role here is not a substitute for the private market. It is the market’s precondition.
Rs 8,189 crore and the argument for being early
Across 23.61 lakh complaints in 2025, Rs 8,189 crore was saved — stopped before it left the chain. As a rate against reported loss that is a substantial share of money that would otherwise have gone. As a mechanism it says something more useful: the money is recoverable only in the minutes before it is layered through accounts, so the recovery rate is a function of how early the system sees the transaction, not how hard it investigates afterwards.
That one fact reorganises the defensive stack. Investigation is a cost centre with a poor recovery rate. Interdiction at the point of authorisation is where the rupees are. Everything upstream of the payment — device intelligence, behavioural scoring, the mule graph, and the reporting path that turns a victim’s call into a flagged account while the money is still moving — is where the growth sits. It is also why the cyber segment of India’s homeland security market compounds at 15.8 per cent while the value per complaint falls.
What it costs to investigate a small fraud
The reason a Rs 93,612 ticket is harder than a Rs 22 lakh one is not the loss. It is the handling cost. Every complaint consumes the same minimum process — intake, triage, a notice to a bank, a lien request, a closure note — and that process does not get cheaper because the sum is smaller. At some ticket size the cost of processing the case exceeds the amount at stake, and below that line the system’s only honest options are automation or nothing.
This is where the volume line earns its keep. Twenty-four lakh complaints a year is not a caseload a human process can absorb; it is a throughput problem, and throughput problems get solved by infrastructure: deduplication across complaints, automated freezing requests, account graphs that let one confirmed mule close a hundred downstream cases. A market that sells detection to a bank and a coordination platform to a state is selling two different products against the same underlying phenomenon, and the second one is growing for reasons that have nothing to do with detection accuracy.
What the state buys, what the buyer buys
India’s homeland security market runs from USD 8.14 billion in 2025 to USD 20.05 billion in 2033 at 11.93 per cent. Inside it, the mix is doing the work: cyber at 15.8 per cent, border at 14.6 per cent, aviation at 7.8 per cent. Between border and cyber, Rs 61,036 crore of the Rs 1,11,216 crore the market adds by 2033 — 54.88 per cent of the increment.
The budget corroborates the direction without naming the line. The Ministry of Home Affairs is allocated Rs 2.55 lakh crore in 2026-27, up 9.44 per cent. Capital outlay under the Police head rises 28.31 per cent, from Rs 16,579.19 crore to Rs 21,272.47 crore — about 8.3 per cent of the ministry’s total allocation, but a far larger share of its growth. Capital growing roughly three times faster than the budget is a statement about what kind of spending the ministry now intends, and coordination infrastructure is what capital buys.
The two buyers are still not buying the same thing. The state is buying a reporting spine in NCRP, an integrated criminal justice stack in ICJS 2.0, and the ability to turn a citizen’s complaint into a flagged account across institutions. The bank, the wallet, the exchange and the merchant are buying a decision made before authorisation. The first is procurement of infrastructure; the second is procurement of a model. L1 tendering selects well for the first and badly for the second, which is why so much fraud technology in India arrives through the private buyer rather than the state one — and why the private buyer’s spend is the better leading indicator even though the state’s budget is the better-documented number.
The compliance clock changes the architecture
The Digital Personal Data Protection Rules were notified on 14 November 2025. The Data Protection Board stood up on publication; consent-manager obligations follow twelve months later; the operational requirements land on 13 May 2027, and consent managers must be Indian companies.
Fraud telemetry is personal data, and the defensive stack above is built almost entirely out of it. Retention limits and minimisation duties arrive at precisely the moment the models want longer histories and more features, not fewer. Two years of device and behavioural history is a better mule detector than six months of it; the same two years is a harder position to defend under a minimisation duty. That tension is not a compliance footnote. It decides which architectures can be operated in India after May 2027, and it will favour systems that make decisions close to the transaction over systems that accumulate records.
Three things that would falsify this
- The average ticket rises while volume falls. That is what enforcement working actually looks like. It would mean the 2025 divergence was a one-year artefact rather than a structural change in the shape of the fraud.
- The reporting series changed definition. A shift in what NCRP counts, or in what banks are obliged to report, can manufacture a divergence like this out of nothing. We have read the series as continuous; if it is not, the argument weakens to nothing at all.
- Recovery rises materially per complaint. If Rs 8,189 crore becomes a much larger share of reported loss, the binding constraint is interdiction speed — and the growth case shifts from scoring to plumbing.
Method and scope
About 70 per cent of what supports this argument is secondary: NCRP’s published financial-fraud series, the Ministry of Home Affairs demand for grants for 2026-27, MeitY’s notification of the Digital Personal Data Protection Rules, and Pheonix Research’s own India homeland security model, from which the segment growth rates, the forensic-loss recovery figure and the market sizing are drawn. Roughly 30 per cent is primary work conducted by Pheonix Research: structured interviews with fraud-risk and payments-integrity leads at banks and payment aggregators, open-ended interviews with mule-account detection vendors and cyber-crime investigators, sessions with the payments and security community at industry conferences, and a practitioner survey covering interdiction timing, false-positive tolerance and the compliance changes respondents expect to constrain model features. Where the primary work does not support a number, we have not stated one.
Sources
- National Cyber Crime Reporting Portal, Ministry of Home Affairs — cybercrime.gov.in
- Ministry of Home Affairs, Demand for Grants 2026-27 and annual report — mha.gov.in
- Ministry of Electronics and Information Technology, Digital Personal Data Protection Rules 2025 — meity.gov.in
- Reserve Bank of India, payments and fraud reporting circulars — rbi.org.in
- National Payments Corporation of India, UPI product and transaction statistics — npci.org.in
- CERT-In, incident and advisory publications — cert-in.org.in
- Pheonix Research, India Homeland Security Market Report 2026–2033; Global Police and Law Enforcement Equipment Market 2025–2033; India Video Surveillance Market 2025–2033; Global Military Drones Market 2026–2033; Global Biometric Technologies Market 2026–2033
Figures are rounded; growth rates are Pheonix Research model outputs, not reported statistics, and should be read with the scope exclusions set out in the underlying report — defence procurement, uniformed pay and pensions, and private guard wages are excluded from the market total.