
Editorial Article
The Global Enforcement Estate Is 435,641 Positions. None of Them Was Counted.
France appears twice in the record, and the two entries differ by 284 devices
France’s national automated enforcement agency counted 4,029 devices in 2025 — 3,423 fixed, 396 deployable and 210 mobile. The commercial camera database that the European press and much of the industry quote carries France at 3,745. The gap is 284 devices, or 7.58 per cent of the smaller count.
Neither number is wrong. They measure different things on different dates with different definitions of “installed” — whether a deployable unit that lives in a patrol car counts as a position, whether a decommissioned housing is retired from the total, whether an ANPR head on a tolling gantry belongs in the figure. What matters is that this is the single best-documented enforcement programme in Europe, run by an agency that publishes more about its estate than almost any other state, and it cannot be counted to within eight per cent.
The gap is not the anomaly. The gap is the precision of the entire category.
Every share quoted in this market has that estimate as its denominator
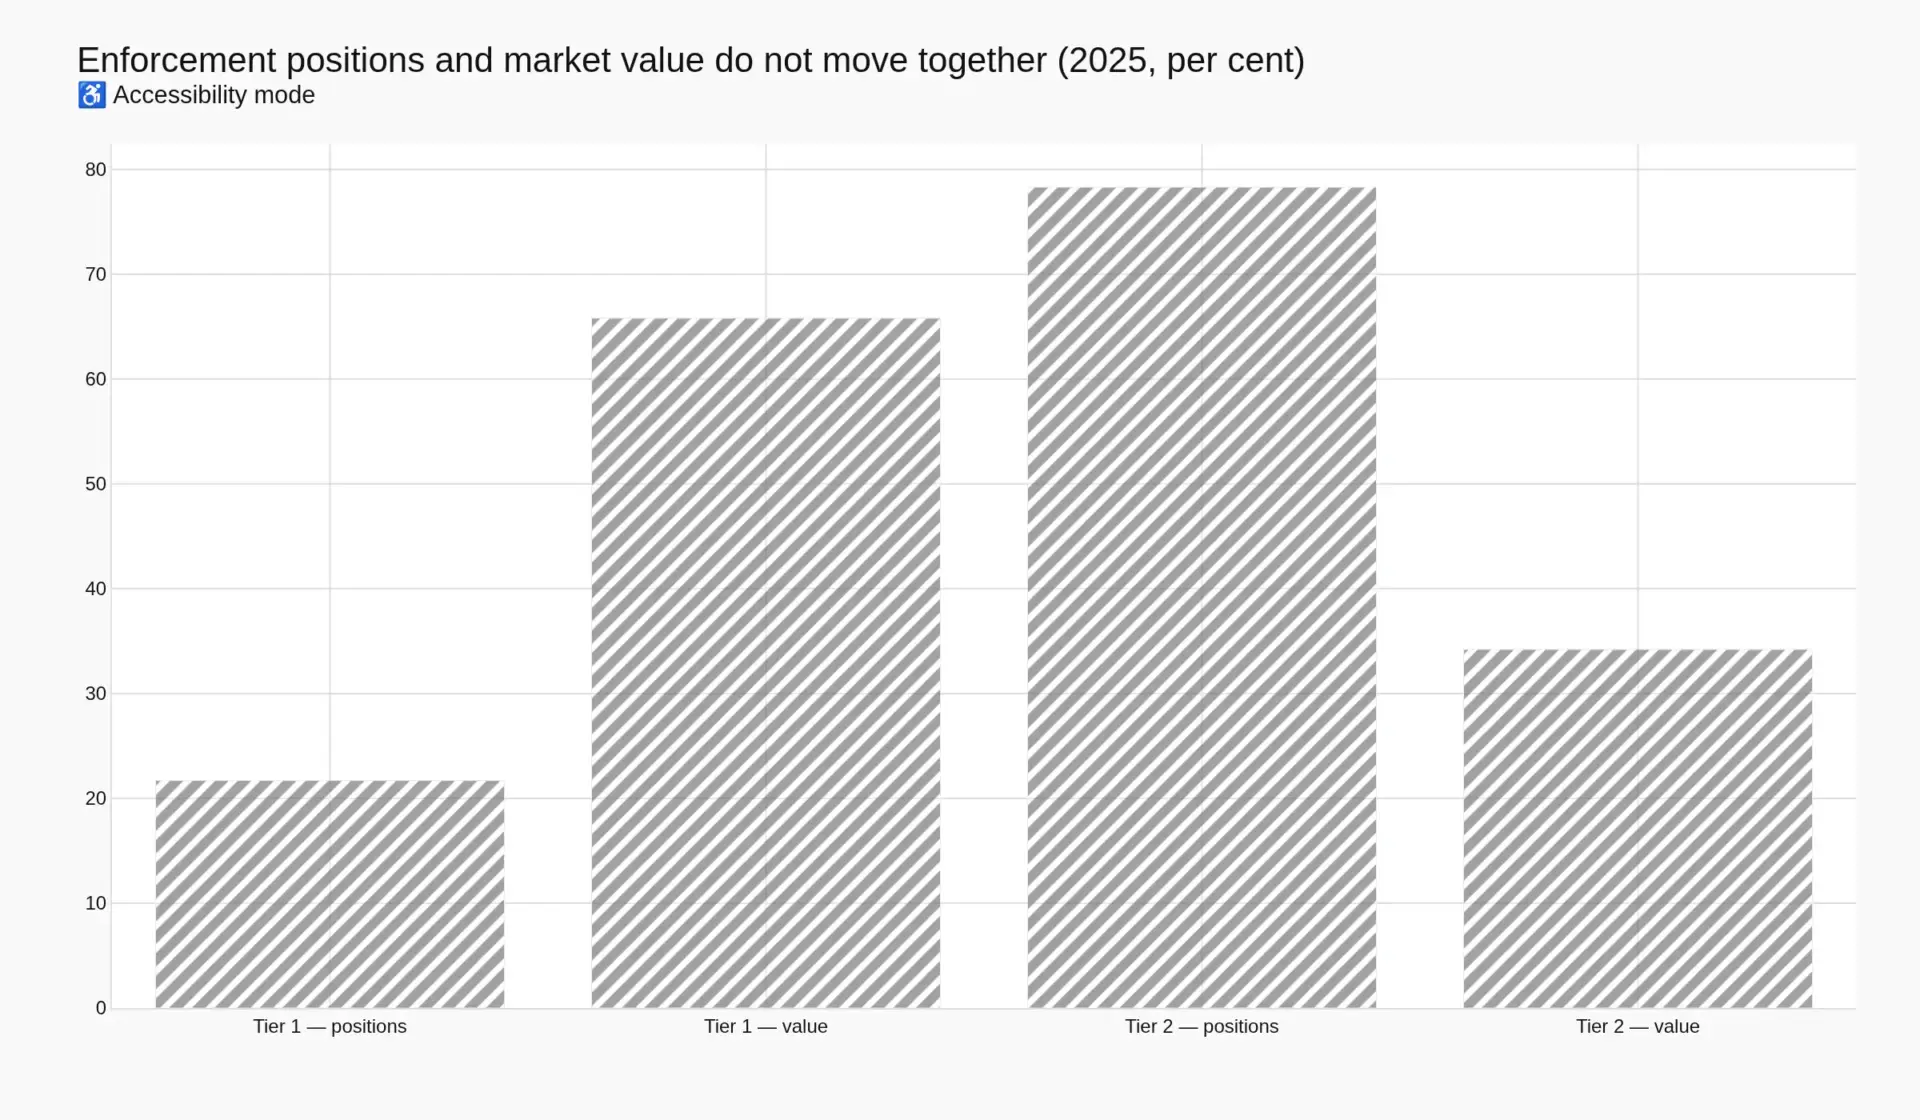
Our construction puts the global estate at 435,641 enforcement positions in 2025, producing USD 5,179.2 million of technology and service revenue and reaching USD 10,069.9 million by 2033 at 8.67 per cent CAGR. Of those positions, 94,606 sit in managed-service markets — 21.7 per cent of the estate and 65.8 per cent of the value — where counts are published or reported by the authority that operates them. The other 341,035, 78.28 per cent of the world’s positions, sit in system-sales markets where no census exists and the figure is modelled from enforcement activity.
Run a 7.58 per cent band through that and the arithmetic does what arithmetic does. A vendor share quoted to one decimal place, against a denominator that moves by nearly eight per cent between two authorities counting the same country, is not measuring the vendor. It is measuring the count.
Europe’s total is inferred from one country’s share of it
Italy reports 11,238 devices and its own press presents that as roughly 17 per cent of the European estate, which implies 66,106 devices across Europe. That 66,106 is not a sum of anything. It is one country’s stated share of an unstated whole, multiplied back out.
Here is the problem with it. The seven largest European programmes by the same dataset sum to 35,385 devices: Italy 11,238, the United Kingdom 7,799, Germany 4,690, France 3,745, Belgium 3,179, Sweden 2,466 and Spain 2,268. Italy is 31.76 per cent of those seven, not 17 per cent. And those seven — which is to say every large European programme anyone has counted — account for 53.53 per cent of the inferred European total. Roughly 30,700 European devices sit outside every published list, in countries that either do not count them or do not say so.
That is not a rounding residual. It is a third of the continent’s estate, and it is distributed precisely across the jurisdictions least likely to publish anything about how they procure.
Outside Europe, three-quarters of the world’s positions are a model
Russia at 18,421 devices and Brazil at 17,614 are counted, and both are counted as estates rather than as programmes. Everything else in Tier 2 is modelled: offence volumes divided by observed throughput per position, then checked against municipal disclosures wherever any exist.
The integrated command and control centre in Chandigarh is the archetype of what the model is reaching for. Inaugurated in March 2022 with 2,085 cameras and a dedicated 28-officer monitoring team, it generated 3.05 lakh challans in six months and Rs 4.6 crore in fines. Those positions are real and they are enforced. They also sit inside a municipal capital project, appear in no camera census, and return nothing recurring to a supplier after warranty expires.
Which is the second reason the count is unreliable as a commercial input: a counted device and a modelled device do not behave the same way commercially. One is inside a service contract with a renewal date. The other is inside a capital programme that ends.
The number you should be using, and the two that should replace it
Value in this category is positions multiplied by value per position-year, and the two tiers price that year at very different rates: USD 36,000 blended in Tier 1 and USD 5,200 in Tier 2 — a 6.92 multiple for the same physical function.
That ratio tells you where to spend measurement effort. A ten per cent error on the Tier 1 count moves USD 340.6 million of 2025 value. The same ten per cent error on a Tier 2 count eight times larger moves USD 177.3 million. Precision is worth paying for where positions are few and priced high. Where positions are many, priced low and uncounted, the honest output is a band, and its width belongs in the sentence rather than in a footnote.
The two indicators that actually move first are neither of them a device count. The first is statutory authorisation. New York’s largest-ever red-light expansion did not follow a fatality trend; it followed S9504A/A.3120A in October 2024, and 300 cameras were installed within two quarters. New South Wales added 2,700 roadside sites for mobile speed cameras. California authorised six cities to run an automated speed safety camera pilot. The 2021 US infrastructure law let states spend up to 10 per cent of federal highway safety funds on non-infrastructure measures, having previously confined federal money to school zones.
The second is budget in a jurisdiction that already holds authority. A place with both is a pipeline. A place with neither is a press release. A place with authorisation and no budget — which is most of them — is a queue whose length nobody publishes, and no camera census will tell you it exists.
We built this base from the position outward for exactly that reason. In a market where nearly everything is reported as a share of the installed base, the installed base is the least reliable input in the model.
How this piece was built
This analysis rests on both research layers, and the split matters. The secondary layer supplied the device counts and the programme statistics: the national enforcement agency’s own 2025 count, Transport for NSW’s road safety progress reporting, the UK Home Office offence series, statutory and council records, US Department of Transportation implementation-cost records, and audited supplier filings. Where an official count and a commercial database disagree, we report both and use the official count in the model.
The primary layer supplied the contract-structure taxonomy and the reason a position is priced on obligation rather than function — structured interviews with road-authority programme managers and procurement leads, open-ended interviews with supplier bid teams covering managed-service contracts, a structured buying-criteria survey, and conference work at Intertraffic Amsterdam in March 2026, where close to 30,000 professionals from 136 countries and 879 exhibitors were present. That layer is used to establish how the market works. It never carries a number; every figure in this piece comes from an agency count, a filing or our own model.
The full tier tables, the position counts by region and the unit-economics brackets are in Global Road Safety & Enforcement Systems Market, 2026–2033.
Companion reading
Two other pieces sit on the same construction. The Same Camera Rents for USD 23,700 a Year and Sells for USD 128,000 a Position takes the unit economics the count cannot see — why the identical physical function is priced across a 3.24 multiple. And the full report sets the two pricing regimes against the statutory authorisation cycle that actually governs revenue.
Frequently Asked Questions
How many speed and red-light enforcement devices are there in the world?
Our construction puts the global estate at 435,641 enforcement positions in 2025. Only 94,606 of those, 21.7 per cent, sit in the managed-service markets where the operating authority publishes or reports a count. The remaining 341,035 are modelled from offence volumes and observed throughput per position, and should be read as an order of magnitude with a wide band rather than as a census.
Why do official and commercial camera counts disagree?
Because they count different things. Definitions differ on whether deployable and mobile units are positions, whether decommissioned housings are retired from the total, whether tolling and bus-lane devices belong in the figure, and on what date the count was taken. France's national agency counted 4,029 devices in 2025 while the commercial database carries 3,745 — a 284-device, 7.58 per cent gap in the best-documented programme in Europe. Neither figure is wrong; they are not measuring the same population.
Which European country has the largest automated enforcement estate?
Italy, at 11,238 devices, which its own press describes as roughly 17 per cent of the European estate. That implies about 66,106 devices across Europe, but the seven largest documented programmes — Italy, the United Kingdom, Germany, France, Belgium, Sweden and Spain — sum to only 35,385 devices, or 53.53 per cent of that inferred total. Roughly 30,700 European devices sit outside every published list.
Does the size of the installed base determine how big the market is?
No, and that is the point. Value is positions multiplied by value per position-year, and a position is worth about USD 36,000 a year in managed-service markets against about USD 5,200 in system-sales markets — a 6.92 multiple. Tier 1 holds 21.7 per cent of the world's positions and 65.8 per cent of its value. Device count and market value are close to unrelated.