
Editorial Article
The Same Camera Rents for USD 23,700 a Year and Sells for USD 128,000 a Position
Three disclosed transactions, priced a multiple apart
The hardware is not the difference. The obligation is.
The ceiling. New York City’s Department of Transportation signed a five-year enforcement contract effective 1 January 2026, with a five-year extension option, at a total contract value of USD 998 million — USD 199.6 million a year to operate the city’s automated estate. Spread across roughly 2,600 speed and red-light positions, that is approximately USD 76,769 per position-year, covering installation, connectivity, maintenance, evidence handling and programme management, but never the fines themselves.
The middle. In March 2025 the same authority instructed its incumbent, by change order, to install 300 additional red-light cameras by year end under a legislatively authorised expansion. Those 300 cameras generated USD 38.4 million of revenue in fiscal 2025 — USD 23.9 million of installation services and USD 14.5 million of product — which is USD 128,000 per position in one-time capital and integration. Almost exactly the midpoint of the USD 67,000 to USD 80,000 per intersection the US Department of Transportation recorded for red-light systems two decades ago, inflated for a much larger multi-approach intersection and a far heavier processing requirement.
The floor. Belleville, Ontario rented four automated speed enforcement cameras for CAD 649,214.16 over five years under council resolution 496-2023 — CAD 32,460.71 per camera-year, roughly USD 23,700. That price includes the camera, its housing, deployment, processing and the city’s share of programme administration. It is what a municipality of about 50,000 people can actually sign.
The spread between USD 23,700 and USD 76,769 for the same function is a 3.24 multiple. It is the most important commercial fact in this market, and it is not explained by anything on the pole.
What the extra money buys: obligation, and the contract length needed to finance it
A position is not priced on what it does. It is priced on what the contract carries. Four things move a position up the range, and each of them is a risk transfer rather than a capability:
- Who owns the asset. Under a rental the supplier carries the capital and depreciates it over the term. Under a sale the authority does, immediately, and the position stops being a service and becomes a line in a capital budget.
- Who holds the maintenance obligation. Uptime commitments against a statutory programme are expensive, because a camera that is lawfully installed but not producing admissible evidence has failed.
- Who indemnifies the evidence chain. The cost of manual secondary verification, retained human review of contested notices and audit trails sits in the evidence stage of the value chain and cannot be capitalised. In a full-service contract the supplier carries it; in a system sale the authority does.
- Who is exposed to political cancellation. A programme that can be switched off by a council vote needs a contract long enough to finance the estate before the vote happens. Contract length is set by the financing structure, not by the asset life.
The wider the obligation, the higher the annual value — and the longer the term has to be to make it financeable. That single mechanism produces almost the entire range between a small Ontario city and New York City.
Which is why the market is really two markets
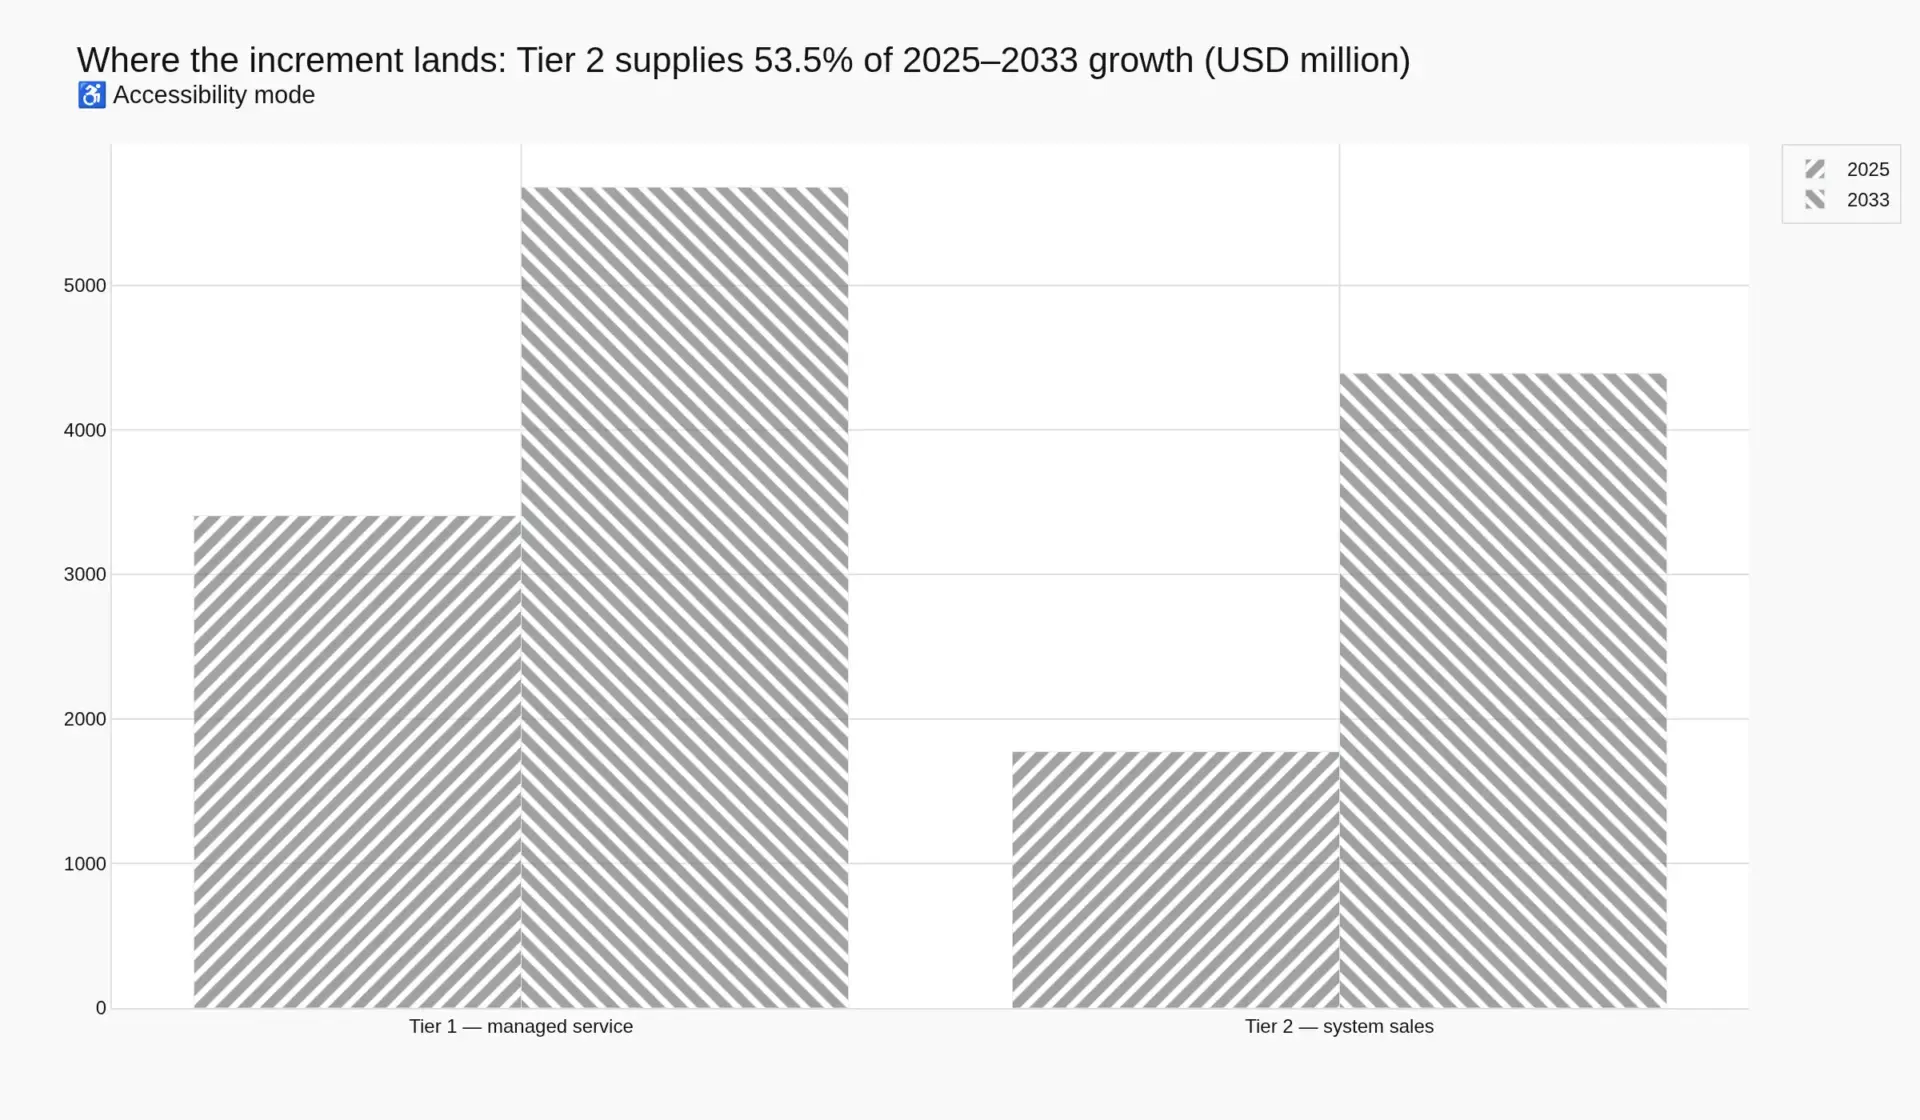
The global market for road safety and enforcement systems was USD 5,179.2 million in 2025 and reaches USD 10,069.9 million by 2033 at 8.67 per cent CAGR, an increment of USD 4,890.7 million. Inside that, two pricing regimes operate almost independently.
| Tier | Positions, 2025 | Value per position-year | 2025 (USD m) | Share | CAGR 2025–33 | 2033 (USD m) |
|---|---|---|---|---|---|---|
| Tier 1 — managed-service markets | 94,606 | USD 36,000 | 3,405.8 | 65.8% | 6.6% | 5,679.1 |
| Tier 2 — system-sales markets | 341,035 | USD 5,200 | 1,773.4 | 34.2% | 12.0% | 4,390.8 |
| Total | 435,641 | USD 11,889 blended | 5,179.2 | 100% | 8.67% | 10,069.9 |
Tier 1 holds 21.7 per cent of the world’s positions and 65.8 per cent of its value. Tier 2 holds 78.3 per cent of the positions and 34.2 per cent of the value, and it supplies 53.52 per cent of the eight-year increment while never exceeding 43.6 per cent of the market by value. A supplier that wins Tier 2 wins share and loses margin. A supplier holding Tier 1 protects margin inside a 6.6 per cent growth rate.
That is the strategic problem the category has not resolved: the fastest-growing half of the market is the half where value per position is lowest, and the half where value per position is highest is the half where a successful programme destroys its own revenue.
The contradiction inside the contract
Enforcement is funded by the behaviour it exists to eliminate, and the elimination is measurable.
New York City’s average daily red-light violations per camera fell from more than thirty in 1994 to seven in 2021. Its speed programme recorded a 73 per cent decrease in speeding at fixed camera locations between 2019 and 2021 and one-third fewer pedestrian injuries. A national review of speed-camera effectiveness cited reductions in the proportion of speeding vehicles of 14 to 65 per cent, with cuts in serious and fatal crashes of up to 44 per cent.
Those are exactly the outcomes a road authority is buying, and exactly the outcomes that shrink the violation base. A programme paid per notice therefore loses revenue as it succeeds. That is why the industry migrated to fixed service fees and per-position pricing — and the migration transfers the risk rather than removing it, because under a fixed fee the authority is now paying for a service whose measured output is falling, and eventually someone on a council will ask why.
The political version of the same problem is visible in the United States, where the number of communities operating automated red-light enforcement fell from over 500 a decade ago to 338 as of March 2024, even as communities operating speed safety cameras rose from 211 in 2023 to 222 in 2024. Red-light programmes are being retired while speed programmes expand, because school-zone speed enforcement carries public support that intersection enforcement does not.
And Italy is what happens when the estate grows without the outcome. Italy has Europe’s largest enforcement estate at 11,238 devices, roughly 17 per cent of the European total, and recorded 3,159 road deaths in 2022, up 9.9 per cent. Municipal fine revenue rose almost 24 per cent against 2019, concentrated in small municipalities, and the country spent fourteen years without publishing the decree that would regulate where and how devices may be installed. A large estate, a rising fatality count and a contested legal basis is not a market signal. It is evidence that device count and safety outcome are separable.
What any of this means for a bid
Three things follow, and they are all pricing decisions rather than product decisions.
Price the position, not the camera. A camera has a bill of materials. A position has an obligation profile, and the obligation profile is what the 3.24 multiple is made of. Bids that quote hardware against a managed-service incumbent are quoting the wrong unit.
Match the term to the financing, not the asset life. A camera lasts longer than most contracts in this category. The five-year and ten-year structures at the top of the range exist because the supplier is financing the estate and needs the term to recover it, not because the hardware wears out.
Assume a falling violation base in any per-notice structure. The jurisdictions where violations per camera have fallen furthest are the ones where the programme is oldest and, usually, the most politically secure. A per-notice model written against year-one violation rates will underperform every year after the first.
None of this is visible from a device count, which is why we model the base from the position outward and price it in two regimes rather than one.
How this piece was built
Both research layers are in this analysis. The secondary layer supplied the disclosed numbers: audited supplier filings — Verra Mobility’s fiscal 2025 results and segment detail, Sensys Gatso’s 2024 annual report, Jenoptik’s 2025 annual report — the New York legislative record for the authorisation that produced the 300-camera expansion, municipal council resolutions for the rental price, US Department of Transportation implementation-cost records, and the national outcome statistics cited above. Where a commercial figure and an official one diverge, the official one is used and the divergence is stated.
The primary layer supplied the contract-structure taxonomy: why obligation rather than function sets the annual value, why term length follows financing, and why a position in a capital programme behaves differently from a position in a service contract. That layer comprised structured interviews with road-authority programme managers and procurement leads across municipal and state jurisdictions, open-ended interviews with supplier-side commercial and bid teams responsible for managed-service contracts, a structured buying-criteria survey covering authorisation, evidence admissibility, payment mechanism and political risk, and conference work at Intertraffic Amsterdam in March 2026, where close to 30,000 professionals from 136 countries and 879 exhibitors attended. It is used to establish how the market works. It never carries a number; every figure here is from a filing, a council record, a regulator or our own model.
The full tier tables, regional position counts and supporting charts are in Global Road Safety & Enforcement Systems Market, 2026–2033. Adjacent demand sits in fleet management and fleet payment and collection, where the same notice ultimately has to be paid.
Companion reading
The Global Enforcement Estate Is 435,641 Positions. None of Them Was Counted. takes the denominator problem the pricing evidence sits on: a 284-device gap between two counts of France, and a European total inferred from one country’s share of it.
Frequently Asked Questions
How much does an automated speed or red-light camera cost per year?
Between roughly USD 23,700 and USD 76,769 per position-year. Belleville, Ontario rented four cameras for CAD 649,214.16 over five years, or CAD 32,460.71 per camera-year. New York City pays USD 199.6 million a year on a USD 998 million five-year contract across roughly 2,600 positions, which is about USD 76,769 per position-year. Separately, the 300-camera expansion New York installed in 2025 cost USD 128,000 per position in one-time capital and integration.
Why is there a 3.24 multiple between the cheapest and most expensive enforcement contracts?
Contract obligation, not hardware. The higher-priced position is one where the supplier owns the asset, carries an uptime obligation against a statutory programme, indemnifies the evidence chain that has to survive appeal, and accepts exposure to political cancellation — which requires a longer term to finance. The same camera under a five-year municipal rental, where the city carries more of those risks, prices at a third of the rate. The spread across USD 23,700 to USD 76,769 is a 3.24 multiple for the same physical function.
Why is the fastest-growing part of the market worth the least per unit?
Because that is where the positions are. Tier 2 system-sales markets hold 341,035 of the world's 435,641 enforcement positions but only 34.2 per cent of its value, at about USD 5,200 per position-year against USD 36,000 in managed-service markets. Tier 2 compounds at 12.0 per cent against 6.6 per cent for Tier 1, and supplies 53.52 per cent of the 2025–2033 increment while never exceeding 43.6 per cent of the market by value. Winning Tier 2 wins share and loses margin.
What happens to revenue when an enforcement programme works?
The violation base falls. New York City's average daily red-light violations per camera went from more than thirty in 1994 to seven in 2021, and its speed programme recorded a 73 per cent decrease in speeding at fixed camera locations between 2019 and 2021. A programme paid per notice therefore loses revenue as it succeeds, which is why the industry moved to fixed service fees — a migration that transfers the risk to the authority rather than removing it. In the United States, communities operating red-light enforcement fell from over 500 to 338 as of March 2024, even as speed camera programmes expanded.