
Global Artificial Intelligence in Pharmacy Market Report, Size, Share and Forecast 2026–2033: Twenty-Nine Per Cent More Sites and Eight Per Cent Less Revenue Per Site
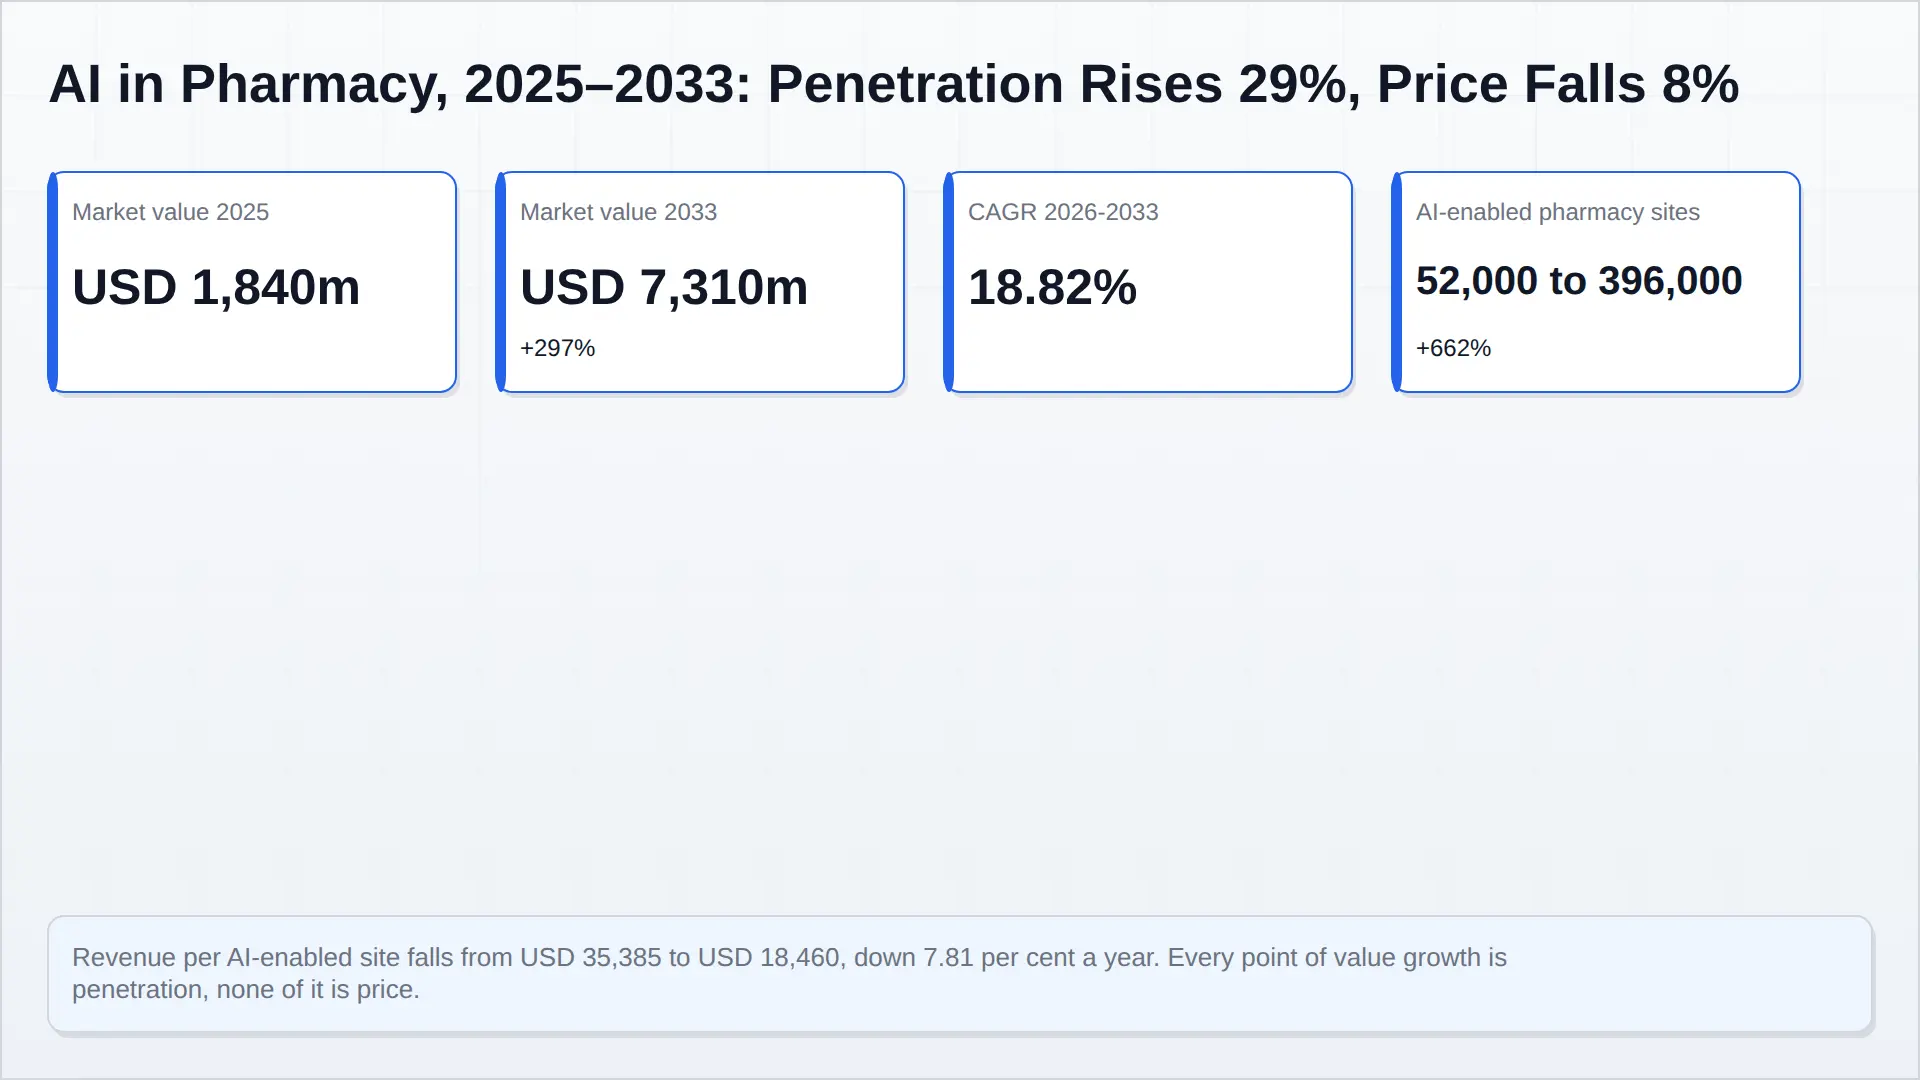
The global artificial intelligence in pharmacy market is USD 1,840 million in 2025 and reaches USD 7,310 million by 2033, an 18.82 per cent CAGR. The AI-attributed site base rises from 52,000 to 396,000 (28.89 per cent CAGR) while revenue per AI-enabled site falls from USD 35,385 to USD 18,460 (minus 7.81 per cent a year).
The decomposition is the argument. This is not a premium software category earning a premium price; it is a falling unit price multiplied by a rapidly expanding site count. Growth is entirely penetration. The strategic consequence is that standalone AI vendors have no pricing power and must be attached to something the buyer already owns - an automation contract, a distribution relationship, or the pharmacy management system itself.
Demand is set by three measured deficits rather than by enthusiasm for the technology. US independent pharmacy locations fell to 18,960 in July 2025 from 18,984 a year earlier while prescriptions per surviving store rose 13.3 per cent to 67,601, so throughput per site is climbing as the site count falls. 56.2 per cent of hospitals report shortages in pharmacy leadership roles. And CMS puts prior authorisation at USD 20-50 per hour, 13 hours a week, or roughly USD 34,000 and 700 hours per provider annually.
Only 17.77 per cent of the 2025 base can be tied to a named, disclosed revenue pool. The remainder is a bottom-up estimate, and this report says so rather than dressing it up.
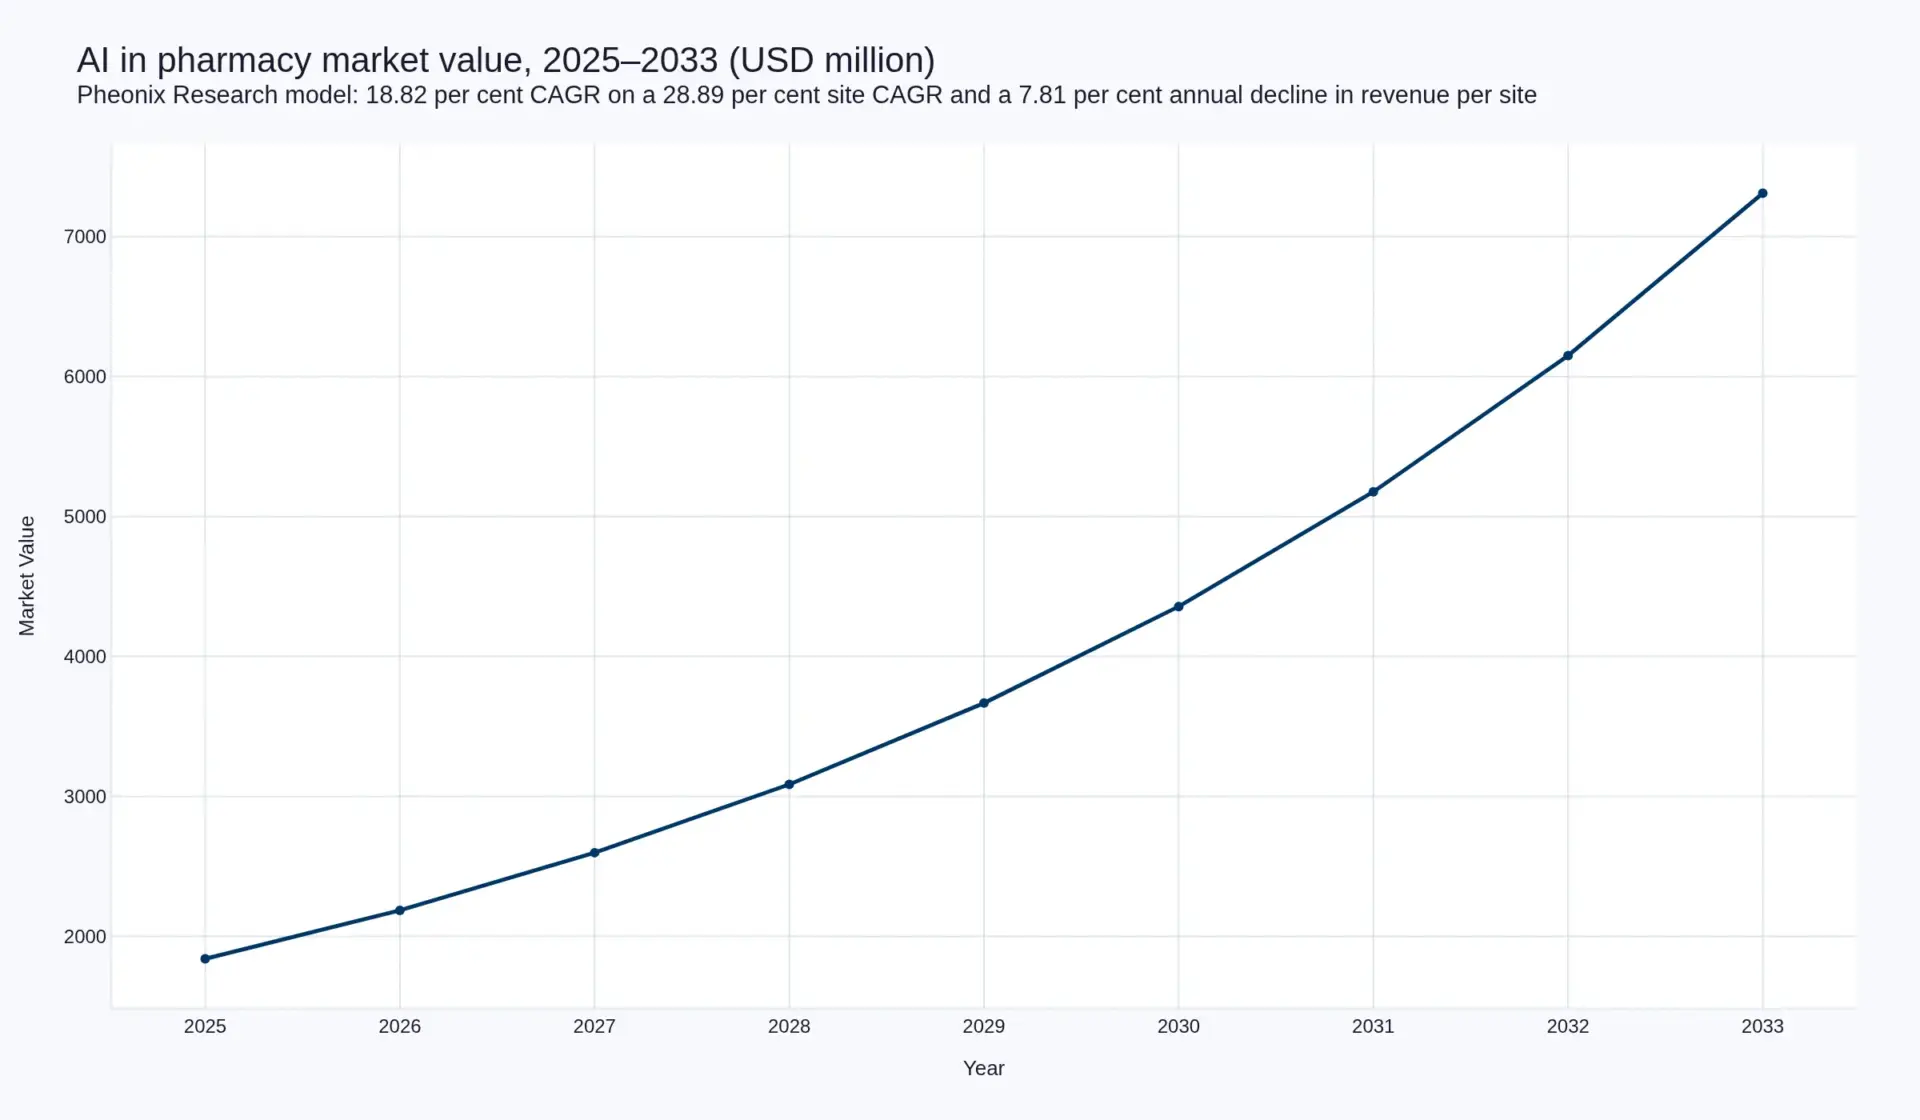
The global artificial intelligence in pharmacy market is USD 1,840 million in 2025 and reaches USD 7,310 million by 2033 — an 18.82 per cent CAGR and a 3.97-fold expansion across eight years. The number of pharmacy sites running at least one production AI workflow rises from 52,000 to 396,000 over the same period, a 28.89 per cent CAGR. Revenue per AI-enabled site falls from USD 35,385 to USD 18,460, or 7.81 per cent a year.
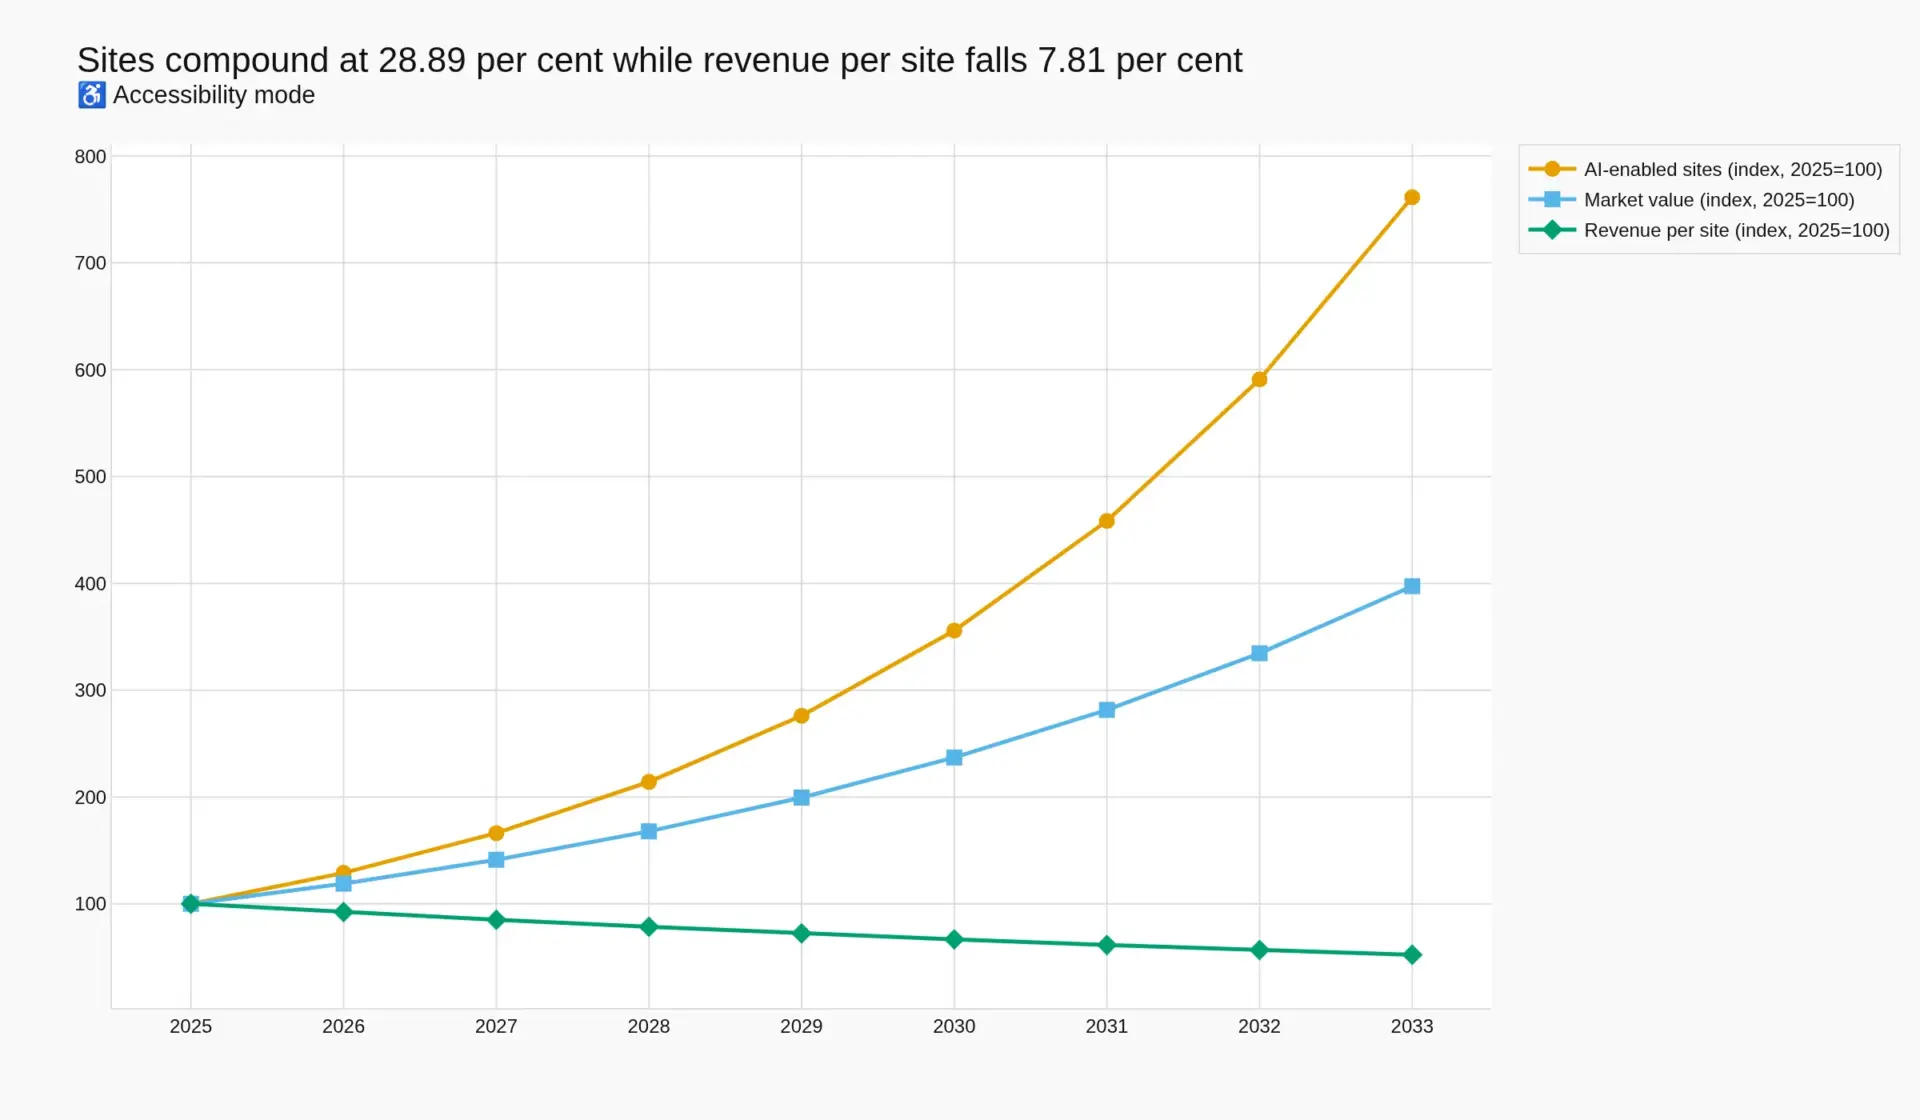
That decomposition is the finding, and it runs against the way this market is usually sold. Most material circulating on pharmacy AI describes a premium capability earning a premium price. The arithmetic describes something else: an 18.82 per cent market growing on a 28.89 per cent site count, with the price per site surrendering more than a fifth of itself every three years. Every point of value growth here is penetration. None of it is price.
The headline model
| Metric | 2025 | 2033 | Change |
|---|---|---|---|
| Market value (USD million) | 1,840 | 7,310 | +5,470 / 18.82% CAGR |
| AI-enabled pharmacy sites | 52,000 | 396,000 | +344,000 / 28.89% CAGR |
| Revenue per AI-enabled site (USD) | 35,385 | 18,460 | −16,925 / −7.81% CAGR |
| Value multiple | 1.00x | 3.97x | — |
Nine points of site growth produce seven and a half points of net value growth because a fifth of the price disappears every three years. Any vendor plan that assumes AI adoption lifts realised revenue per customer is planning against the arithmetic in this table, and the arithmetic wins.
This is the mirror image of pharmacy automation
The comparison is unavoidable because it is the same buyer standing in the same building. The pharmacy automation system market grows 7.76 per cent a year on 4.90 per cent unit growth and a 2.73 per cent rise in revenue per system. AI in pharmacy grows faster in percentage terms but with a 7.81 per cent fall in revenue per site.
The reason is physical. An automation configuration at a central-fill site gets genuinely larger each generation — more cells, more robotics, more integration work — so the average selling price appreciates. Software does not appreciate. The marginal cost of a model call falls every year, the buyer knows it, and the negotiation ends with the saving shared.
Why the price falls while the market grows
Three mechanisms, in order of force. First, inference gets cheaper: the same verification or triage task costs less to run every year, and buyers on multi-year contracts now ask for that decline to be passed through. Second, AI rarely arrives as its own line item. Our vendor interviews found it quoted as a percentage uplift on an automation bid, typically in the mid single digits to low teens of contract value — which makes it a discount lever in the negotiation rather than a capability purchase. Third, the estate is shrinking, so reach is bought with price.
That third mechanism is measurable. The National Community Pharmacists Association put independent community pharmacy locations at 18,960 in July 2025, down from 18,984 a year earlier, with independents representing nearly 36 per cent of all US retail pharmacies — which puts the total US retail estate in the region of 52,700 locations. Over the same period, average prescription volume per independent store rose from 59,644 in 2023 to 67,601 in 2024, an increase of 13.3 per cent, in part because closures pushed volume into surviving sites.
So the addressable site count is falling while throughput per surviving site climbs at double digits. AI in pharmacy is not bought to serve new patients. It is bought to move rising volume through fewer, more heavily loaded sites with fewer people — which is precisely a market that grows by penetration into a contracting base rather than by price.
What the buyer is actually paying to remove
The labour case is documented better than the market sizing is. The American Society of Health-System Pharmacists' national survey of hospital pharmacy directors, fielded in autumn 2024 and published in the American Journal of Health-System Pharmacy, found 56.2 per cent of hospitals reporting shortages in pharmacy leadership roles, alongside a decade-long expansion of pharmacist clinical deployment: involvement in emergency departments rose from 10.9 per cent a decade earlier to 46.5 per cent, with critical care at 68.5 per cent, oncology at 56.9 per cent, and infectious disease and antimicrobial stewardship at 48.1 per cent.
That combination — more clinical work, fewer people to lead it — is the demand signal. Every hour a pharmacist spends on a verification queue or a prior-authorisation portal is an hour not spent on the clinical deployment the survey describes, and hospital pharmacy directors described the trade explicitly in our interviews.
On the administrative side the number is unusually precise, because the regulator publishes it. CMS estimates that requesting prior authorisations costs providers USD 20–50 per hour and consumes an average of 13 hours a week — approximately USD 34,000 and 700 hours of administrative time per provider per year. That is the largest quantified pool of removable labour in this market, and it is a document-understanding problem rather than a clinical one.
The 2027 mandrel, stated precisely
From 1 January 2027, certain health plans regulated by CMS must implement and maintain a set of standardised APIs, including a Prior Authorization API, alongside Patient Access, Provider Directory, Provider Access and Payer-to-Payer APIs. That converts a discretionary efficiency purchase into a dated compliance obligation.
One qualification, because the distinction matters commercially: the CMS programme addresses prior authorisation for medical items and services on the medical benefit, while a large share of pharmacy prior authorisation runs through pharmacy-benefit rails and NCPDP standards instead. The 2027 date is therefore a hard catalyst on the medical-benefit side and a strong directional signal for pharmacy rather than a pharmacy-specific mandate. What it does unambiguously is make structured, machine-readable authorisation the expected norm — and anything automating the unstructured version has a shrinking window.
Where the money is disclosed, and where it is not
Only 17.77 per cent of the 2025 base can be tied to a named, disclosed revenue pool. Omnicell reported fiscal year 2025 total revenues of USD 1.185 billion, up 7 per cent, and used the ASHP 2025 Midyear Clinical Meeting to launch its Titan XT dispensing platform as a step toward autonomous medication management. Becton Dickinson's Medication Management Solutions segment and Cencora's USD 1 billion distribution investment through 2030 — which specifies robotic handling, AI and autonomous mobile robots in its new facilities — supply most of the remainder of what can be attributed.
The other 82.23 per cent is a bottom-up estimate. That is not a weakness of this report; it is a property of the market. AI in pharmacy rarely has its own line in anyone's accounts. It appears as a feature uplift inside a product, a productivity claim inside a capital programme, or an unbundled fee too small to break out. Any sizing that claims precision is describing its own assumptions, and we would rather label ours than hide them.
Related Pheonix coverage in this cluster: smart pill dispensers, electronic medical records, and the global medical devices hub.
Articles on this market
- AI in Pharmacy Sells at a Falling Price. That Is the Business Model. — why 28.89 per cent site growth against 7.81 per cent price deflation decides who wins in this market.
- Seven Hundred Hours a Year: the Prior-Authorisation Bill AI Is Being Bought to Cut — the administrative workflow with the only fixed regulatory deadline in pharmacy AI.
The number this forecast is most fragile to
It is not the site count. It is the 7.81 per cent annual decline in revenue per site. If revenue per site held flat at USD 35,385 while sites still reached 396,000, the 2033 market would be approximately USD 14,012 million — nearly double our figure. The single most consequential judgement in this report is therefore about price, not adoption, and a reader who believes AI in pharmacy will command a durable premium should read the 2033 number as roughly USD 14 billion rather than USD 7.3 billion.
What supports the deflationary reading is that it is what operators told us and what the contracts show. AI is being absorbed into equipment and workflow budgets, not established beside them. That is good news for the volume of deployment and bad news for the pricing of it — and it is why the commercial value in this cluster sits with whoever already owns the workflow.
Table of Contents
Competitive Landscape
This is a fragmented market with three distinct cohorts, and the cohorts are not competing on the same axis.
| Cohort | Position | Structural advantage | Structural weakness |
|---|---|---|---|
| Automation incumbents | Adding intelligence to installed equipment | Owns the workflow, the service contract and the validation history | Hardware margin drag; innovation pace set by an installed base |
| Distributors | Embedding AI in logistics and central fill | Owns the volume, the data and the capital programme | AI is a cost-efficiency lever internally, not a product to sell |
| Software-native and EHR-embedded | Selling modules into the pharmacy management layer | Fast iteration, no equipment burden | No pricing power; dependent on someone else’s workflow |
The strongest position in the market is the first cohort, and not because its models are better. It is because a verification model that arrives with the dispensing cabinet, the service engineer and the existing validation file is an upgrade to a contract already signed, while the same model arriving as a new vendor relationship is a procurement project. That asymmetry explains why the largest single AI announcement of the cycle was a dispensing platform rather than an algorithm.
Revenue reconciliation, and why this market is hard to size
Only 17.77 per cent of the 2025 base can be attributed to a named disclosed pool. The three pools we can reach are set out below; the allocations are Pheonix judgements applied to disclosed totals, and are labelled as such rather than presented as disclosure.
| Named pool | Disclosed basis | Pheonix AI allocation | USD million, 2025 |
|---|---|---|---|
| Omnicell | Fiscal year 2025 total revenues of USD 1.185 billion, up 7 per cent | 12.5% to AI-attributable intelligence and connected software | 148 |
| Becton Dickinson, Medication Management Solutions | Quarterly segment revenue, annualised | 3.5% to AI-attributable software and intelligence | 117 |
| Cencora | USD 1 billion distribution investment through 2030, including AI and autonomous mobile robots in new facilities | Annualised AI and automation-software element of the programme | 62 |
| Named total | 327 (17.77%) | ||
| Residual, bottom-up estimate | 1,513 (82.23%) | ||
That 82.23 per cent is the honest measure of how immature the disclosure is. AI in pharmacy rarely has its own line in anyone’s accounts; it appears as a feature uplift inside a product, a productivity claim inside a capital programme, or an unbundled SaaS fee small enough not to be broken out. Any sizing of this market that claims precision is describing its own assumptions.
Bid dynamics and lock-in
Three patterns recurred across our vendor interviews. AI is quoted as a percentage uplift on an automation bid rather than as a separate line, typically in the mid single digits to low teens of contract value. The buyer negotiates it as a discount lever rather than as a capability purchase, which is the proximate mechanism behind the price deflation in our model. And once installed, switching is rare, because the validation documentation is site-specific and re-validating a competitor costs more than the licence saving. Lock-in in this market is documentary, not technical.
No competitor research is cited in this chapter or anywhere in this report.
Value Chain
The chain has four layers, and the money sits in the third rather than the second.
| Layer | What it does | Where the value accrues |
|---|---|---|
| 1. Data capture | Dispensing events, inventory positions, claims and prior-authorisation traffic, EHR medication lists, image capture at the counting and verification stage | Low. A prerequisite, rarely monetised on its own |
| 2. Model layer | Pill and package imaging, demand and inventory forecasting, natural-language triage of prior authorisations, renal and paediatric dose checking, pharmacogenomic decision support | Low to moderate, and deflating. Models are increasingly substitutable |
| 3. Workflow integration | The pharmacy management system, the automation controller, the EHR, and the validation documentation that lets the output actually change what a technician does | High. This is where the attach is won or lost |
| 4. Delivery and assurance | Implementation, site validation, drift monitoring, audit trail, liability cover | Moderate and durable. Recurring by construction |
The consequence of that shape is blunt. A model that is 3 per cent more accurate than a competitor’s but sits outside the workflow is worth nothing to the buyer, because the buyer’s constraint is not accuracy – it is whether the output can be acted on without a pharmacist re-checking it. The workflow layer is where an incumbent converts an accuracy advantage into a contractual one.
Cost structure
Validation and implementation dominate the early life of a deployment, not inference. In a hospital verification installation we would expect the split to run roughly as follows, and this is the arithmetic our operator interviews kept returning to.
| Cost element | Share of first-year deployment cost | Behaviour over time |
|---|---|---|
| Implementation and integration | 30-38% | Falls slowly, labour-bound |
| Validation and clinical assurance | 18-24% | Falls per site as templates mature |
| Licence and model usage | 22-28% | Falls fastest – the source of price deflation |
| Hardware and imaging capture | 10-15% | Stable, and often bought inside the automation contract |
| Monitoring and support | 8-12% | Stable, recurring |
Because the falling element is the licence and model usage, the deflation shows up in the part of the bill the buyer can see most clearly and negotiate hardest. That is why the 7.81 per cent annual decline in revenue per site is not a forecast of distress for the market – it is a forecast of margin migration from the model layer to the integration and assurance layers.
The specification chain
In retail and central-fill, the specification is short and commercially driven: does it reduce technician hours per thousand scripts, and does it survive an audit. In hospitals it is longer and clinically gated: does the output enter the medication-use policy, is it validated against the site’s own historical error set, and who signs when it is wrong. The hospital chain takes nine to eighteen months longer and is where the durable revenue per site is, which is why the site-count expansion in this forecast runs fastest in retail and slowest in hospital pharmacy.
Investment Activity
The capital in this market is being committed to physical nodes with intelligence inside them, not to software companies selling intelligence.
The distribution programme
Cencora announced on 5 November 2025 a plan to invest USD 1 billion through 2030 to expand its US pharmaceutical distribution network, and described the facilities in explicitly technical terms. A second national distribution centre in Harrison, Ohio – 530,000 square feet, expected fully operational by spring 2027 – will feature robotic handling systems, artificial intelligence and autonomous mobile robots. A 430,000 square foot facility in Fontana, California, expected operational by autumn 2026, is nearly double the size of the site it replaces and is described as highly automated. The Dothan, Alabama specialty facility is being expanded to increase refrigerated storage capacity by 500 per cent and frozen capacity by 200 per cent, completion expected autumn 2026.
Three things follow from that disclosure. The capital is multi-year and therefore visible as a forward demand signal rather than a spot purchase. The AI element is embedded in a building programme, which means it is financed as infrastructure rather than justified as a software return. And the cold-chain expansion is a speciality-medicine bet: Cencora cites an expectation that speciality products will account for 70 per cent of new medicines launched through 2027, and that half of all products launched globally through 2027 will require cold chain, up from 37 per cent between 2013 and 2017.
The equipment cycle
Omnicell’s fiscal 2025 disclosure carries the more commercially interesting signal for this market. Full-year revenue of USD 1.185 billion, up 7 per cent, was attributed to strength in connected devices, technical services, and SaaS and Expert Services – and the company used ASHP Midyear to launch Titan XT as a step toward autonomous medication management, extending beyond the pharmacy into nursing care areas. Recurring revenue is being positioned as the growth engine and the hardware as the vehicle for it.
That is a coherent answer to the deflation problem. If revenue per site falls, the response is not to raise the price of intelligence but to increase the number of things per site that carry a recurring charge – and to own the care-area endpoint where the remaining manual labour sits.
Where acquisition money would go
Our view, and it is a judgement rather than a disclosure: the acquisition market will clear at the workflow layer, not the model layer. A validated integration into a specific pharmacy management system, with site-specific documentation and an installed base, is a durable asset. A model is not, because the model can be replaced by a better one inside a quarter and the integration cannot be replaced without re-validation. Expect consolidation among vendors who own an integration and little activity among those who own an algorithm.
Capital intensity
The software layer is genuinely asset-light, which is why innovation intensity is high and entry is cheap. The node layer – central fill, distribution centres, imaging capture hardware – is capital-intensive and therefore concentrates. This market’s structure is a lightweight, crowded top sitting on an expensive, concentrated bottom, and investment returns accrue disproportionately to the bottom.
Technology & Innovation
The technology story of 2025-2026 is not a new algorithm. It is the relocation of intelligence from a standalone screen into the equipment and the workflow already in the building.
The verification stack
Image-based verification of dispensed product moved from novelty to expected feature during this cycle. The stack is a capture step at the counting or packaging stage, a classification model that compares what is in the cell against what the order says should be there, and a routing rule that decides whether the exception goes to a technician or a pharmacist. The model is the least interesting part. The routing rule is the product, because it determines the labour actually removed.
Autonomous medication management
Omnicell launched its next-generation dispensing platform, Titan XT, at the ASHP 2025 Midyear Clinical Meeting and described the launch as a step toward autonomous medication management, positioning the system as combining automation with intelligence and extending beyond the pharmacy into nursing care areas. Read carefully, that is a statement about the value chain rather than about a model: the intelligence is being pushed out of the dispensing cabinet and into the care area where the dose is actually administered, which is where the remaining labour is.
Forecasting and inventory
Demand forecasting is the quietest and most immediately bankable application, because its payback is measured in inventory turns rather than in clinical trust. At 67,601 prescriptions per independent store in 2024, up from 59,644 in 2023, working-capital discipline on a few thousand SKUs matters more than it did when volumes were lower. This is also the application least exposed to device regulation, which is precisely why it is spreading fastest.
Prior authorisation and natural-language triage
Administrative triage is the application with the clearest number attached to it. CMS estimates prior authorisation costs providers USD 20-50 per hour and consumes an average of 13 hours a week, or roughly USD 34,000 and 700 hours per provider each year. A workflow that reads a payer’s criteria and assembles the documentation is not exotic technology; it is document understanding applied to a fax-and-portal process. Its constraint is payer heterogeneity, not model capability.
Generative models and the substitution risk
The FDA convened a Digital Health Advisory Committee during 2025 focused on generative-AI enabled digital mental health medical devices, which is the clearest signal yet that general-purpose models are being treated as a regulatory category rather than a feature. For this market the implication is uncomfortable for specialists: if a foundation model can read a medication list and a payer criterion set, the point solution built on a narrow model has no defensible moat except its documentation and its integration. That is why substitution risk in this report is rated high even as innovation intensity is also rated high – the two are the same phenomenon seen from different ends.
CDRH authorised 124 novel medical devices in 2025, one of the highest annual totals in its history, and maintains a public AI-Enabled Medical Device List as the register of AI-embedded devices authorised for marketing. That list is the authoritative inventory of what has cleared, and it is notably thin on pharmacy-operations functions relative to diagnostic imaging – a gap that reflects where the evidence burden currently falls rather than where the commercial demand is.
Market Risk
Three scenarios, then six named risks.
| Scenario | 2033 value (USD m) | The assumption that moves |
|---|---|---|
| Optimistic | 10,900 | Revenue per site deflates at 4.5% instead of 7.81%, and sites reach 430,000 on faster hospital adoption |
| Base | 7,310 | Sites 396,000; revenue per site falls 7.81% annually |
| Conservative | 4,650 | Price falls 11.0% as foundation models commoditise the model layer; sites stall at 340,000 on regulatory drag |
1. Price deflation outruns penetration
The core risk, and the one this forecast is most exposed to. If general-purpose models make the narrow model layer substitutable faster than sites adopt, price falls without a matching volume gain. The conservative scenario is a 3.1 percentage point swing in the deflation rate, which is entirely plausible within a single procurement cycle.
2. Incumbent bundling squeezes standalone vendors
Because AI arrives as an uplift on an automation contract, an equipment incumbent can price the intelligence at marginal cost and recover it on the hardware and service. A software-only vendor cannot match that price and still fund validation. This is not a risk to the market; it is a risk to two of its three cohorts.
3. Accountability stalls clinical verification
State practice rules requiring licensed-pharmacist final verification cap the labour displacement available from clinical models. If regulators tighten rather than relax exception frameworks after any high-profile error, the clinical segment of this market stops growing and the growth concentrates further in administrative applications.
4. A model failure event
A single well-publicised verification or dosing error attributed to an AI system would compress adoption timelines across the category regardless of the specific vendor’s record, because hospital procurement is reputationally risk-averse and the validation burden would rise for everyone. The device framework is designed for exactly this and would likely tighten post-market surveillance in response.
5. Site contraction beyond forecast
US independent pharmacy locations fell marginally in 2025, and roughly one in eight US neighbourhoods meets the criteria for a pharmacy shortage area. If closures accelerate – through reimbursement pressure, direct and indirect remuneration reform, or further chain restructuring – the addressable retail base shrinks faster than the model assumes. Note the asymmetry: closures raise throughput per surviving site, which supports AI adoption at those sites while removing sites from the count. Volume and site count move in opposite directions, and the net effect on this market is mildly negative.
6. Foundation-model substitution resets pricing
Substitution risk is rated high in this report even though innovation intensity is also rated high, because they are the same phenomenon observed from opposite ends. A capability that used to require a specialist vendor now requires an API call and an integration. The defensible assets are the integration, the validation history and the installed base – never the model.
What is not a risk
Demand. The labour arithmetic is documented by the regulator and the professional bodies, and the direction of travel – rising prescriptions per site, shortages in pharmacy leadership, a dated prior-authorisation deadline – is not in question. This is a market with a certain demand curve and an uncertain price, which is the opposite of how it is usually described.
Regulatory Landscape
Regulation in this market is not primarily about whether a model is accurate. It is about who signs when it is wrong, and that question is answered by pharmacy practice law and compounding standards long before it reaches device regulation.
Device status depends on function
Software functions that inform clinical decisions on an individual patient – image-based verification of dispensed product, dose checking, clinical decision support – generally fall inside device regulation in the United States and appear on the FDA’s AI-Enabled Medical Device List, the agency’s public register of AI-embedded devices authorised for marketing. Administrative functions such as inventory forecasting, routing or prior-authorisation triage generally do not. The register is the authoritative inventory of what has cleared, and it remains notably weighted toward diagnostic imaging rather than pharmacy-operations functions – a reflection of where the evidence burden falls, not of where demand sits.
CDRH authorised 124 novel medical devices in 2025, one of the highest annual totals in the centre’s history, and during the year convened a Digital Health Advisory Committee focused on generative-AI enabled digital mental health medical devices – a signal that general-purpose models are now treated as a regulatory category rather than a feature. Lifecycle management for AI devices depends on predetermined change control planning, which shifts the compliance burden from each update to the description of the update process. That favours vendors with regulatory affairs capacity and penalises those shipping models continuously without a pre-authorised change protocol.
The binding constraint: accountability
In most US states, final verification of a dispensed prescription remains a licensed pharmacist function, and automation is permitted only within defined technician-checking-technician or exception-based frameworks that a site must have approved. The consequence is that AI can remove labour around the verification step far more easily than the step itself. This is the single most important regulatory fact in the market, because it caps how much labour a verification model can actually displace – and it is why the fastest-growing applications in this report are administrative rather than clinical.
Compounding
Sterile and non-sterile compounding sit under USP General Chapters <797> and <800>. Where AI enters a compounding workflow – gravimetric verification, documentation, environmental monitoring – it enters a regime of prescribed records and named responsible persons. Documentation automation is welcome; autonomous release is not.
Prior authorisation and the 2027 deadline
From 1 January 2027, certain CMS-regulated health plans must implement and maintain standardised APIs including a Prior Authorization API, alongside Patient Access, Provider Directory, Provider Access and Payer-to-Payer APIs. This is a dated compliance obligation on the medical-benefit side and a strong directional signal for pharmacy, where a substantial share of authorisation runs through pharmacy-benefit rails and NCPDP standards rather than the CMS APIs.
Data protection and the EU
Health data processing remains governed by HIPAA in the United States and by a patchwork of state law, with contractual business-associate obligations doing most of the practical work. In the European Union, the AI Act’s high-risk classification captures safety-component software in medical devices, adding conformity assessment, data governance and human-oversight duties on top of the Medical Device Regulation. For a vendor, this means the EU is a slower and more expensive market than the US for the same clinical function – and it is why the site-count expansion in our forecast is weighted toward North America and Asia-Pacific retail rather than European hospital pharmacy.