
Global E-Prescribing Market Report, Size, Share and Forecast 2026–2033: The Prescription Is Now the Smallest Part of E-Prescribing
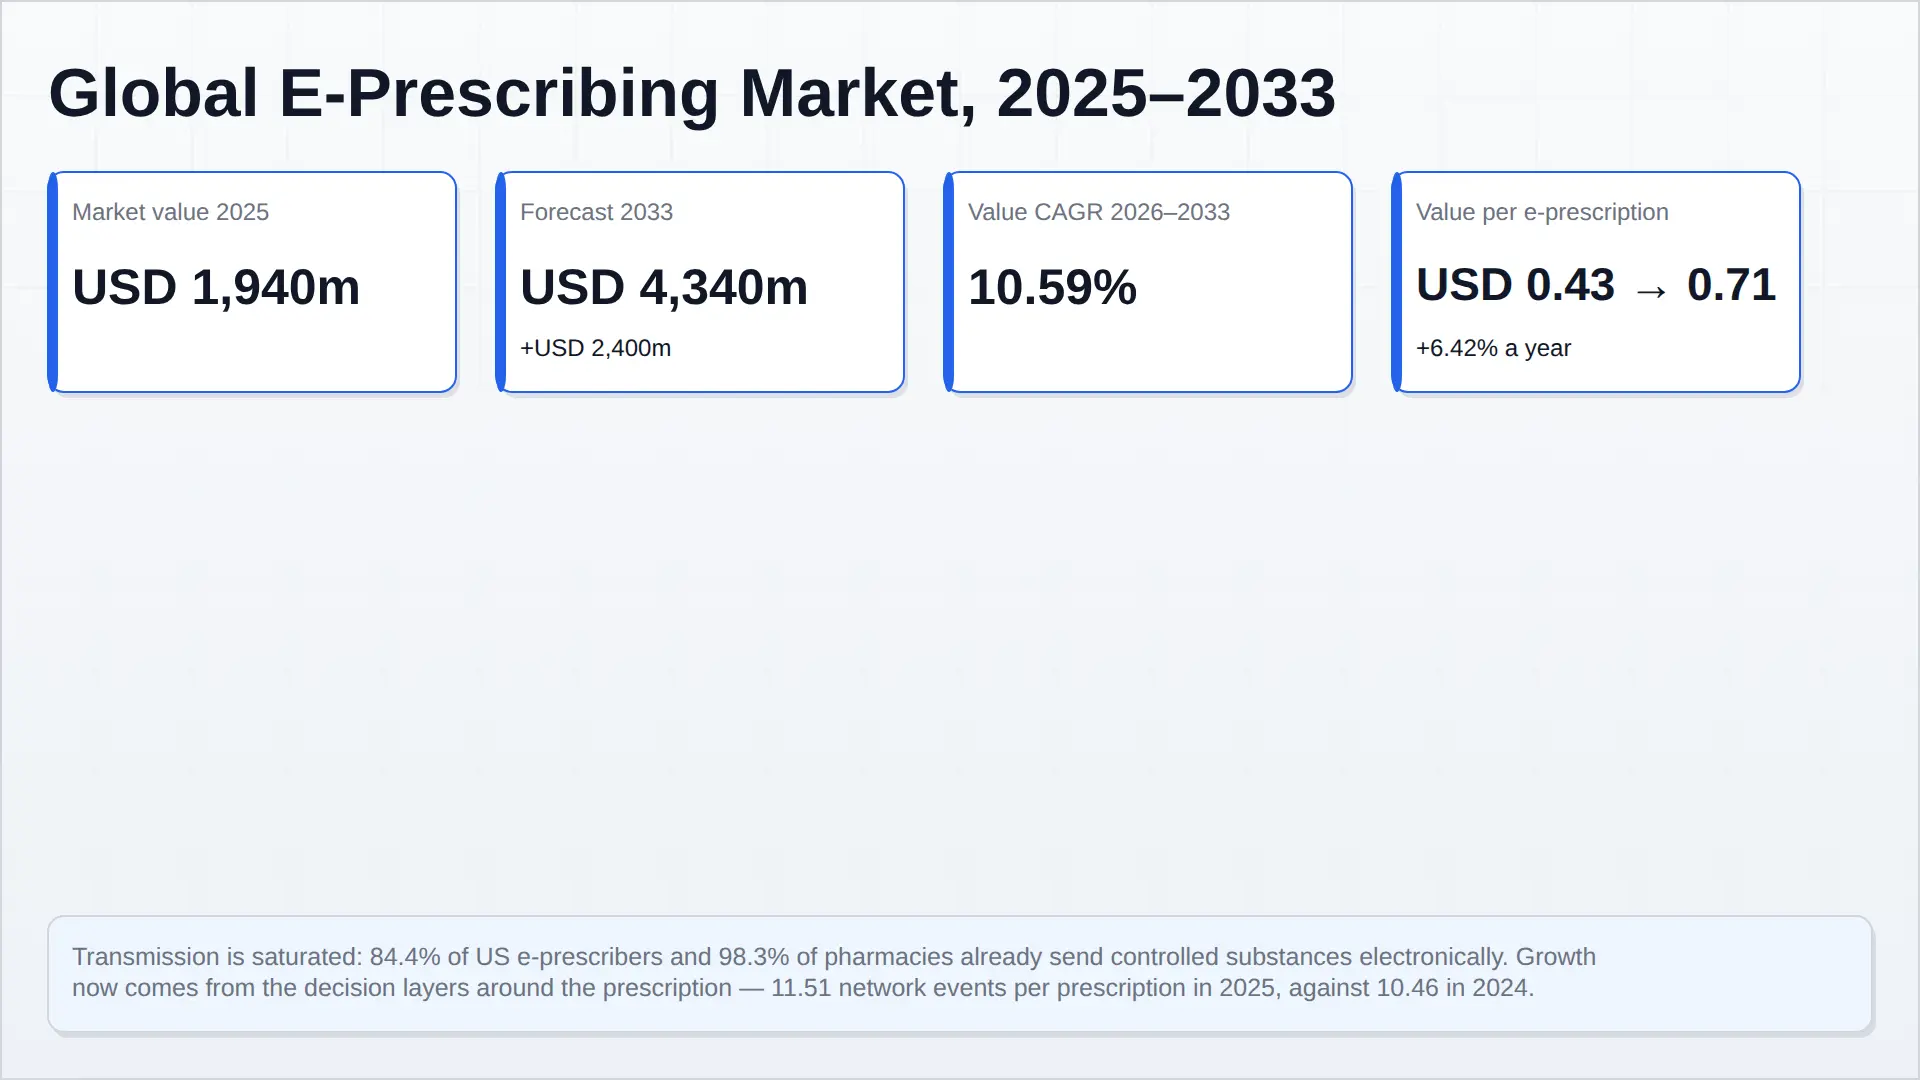
The market is growing twice as fast as the thing it moves. Global e-prescribing value rises from USD 1,940.0 million in 2025 to USD 4,340.0 million in 2033, a 10.59 per cent CAGR and an absolute addition of USD 2,400.0 million (2.24x). Electronic prescription volume over the same period grows 3.92 per cent a year, from 4,500 million to 6,120 million prescriptions. Value per e-prescription therefore rises from USD 0.43 to USD 0.71, a 6.42 per cent annual premium. That premium — not adoption — is what this forecast is really about.
Transmission has become a utility. 84.4 per cent of US e-prescribers are enabled for controlled substances and 98.3 per cent of pharmacies can receive them; 1.39 million prescribers used the network in 2025, up 4.0 per cent. In England, 1.16 billion of 1.19 billion dispensed items — 97 per cent — went through the Electronic Prescription Service. There is almost no adoption left to sell at the transmission layer, and its share of value falls accordingly, from 15.5 per cent of the 2025 base to roughly a tenth by 2033.
Eleven and a half events now ride on every prescription. The Surescripts network exchanged 27.2 billion transactions against 2.6 billion e-prescriptions in 2024 — 10.46 events per prescription. In 2025 transactions grew 12.3 per cent while prescriptions grew low single digits, taking the ratio to about 11.5, an increase of 10.04 per cent. Real-Time Prescription Benefit alone returned 1 billion responses to 973,463 prescribers; Eligibility informed 5.07 billion care events. These are billed per event, and they are why the value line diverges from the volume line.
Value migrates to the decision layers. Benefit and price intelligence plus prior authorisation carry 39.2 per cent of 2025 value and 55.1 per cent of 2033 value. Transmission and prescriber-side software fall from 48.5 per cent to 34.1 per cent. Prior authorisation is the fastest-growing layer at 18.53 per cent CAGR, from USD 290 million to USD 1,130 million, and it is the one layer with a dated legal obligation behind it.
Two regulatory clocks set the shape of the curve. CMS-0057-F requires impacted payers to implement a HL7 FHIR Prior Authorization API with compliance generally beginning 1 January 2027, and adds a prior-authorisation measure to MIPS Promoting Interoperability. The European Health Data Space Regulation entered into force on 26 March 2025, with ePrescription and eDispensation exchange applying from March 2029. The United States therefore drives growth through the authorisation layer on a saturated base, while Europe delivers a step-change late in the period — European value share rising from 21 to 26 per cent as North America's falls from 62 to 55.
Two markets are 84.7 per cent of the world. The United States (approximately 2,650 million e-prescriptions) and England (1,160 million, an official statistic) together account for four fifths of global electronic prescription volume. Every growth assumption outside those two jurisdictions is a bet on national programme construction rather than on conversion of existing paper.
Disclosure is the constraint, and it is disclosed. Only 2.7 per cent of the 2025 base reconciles to a clean public filing — the Pheonix-allocated prescribing share of Veradigm's USD 584–589 million fiscal 2025 revenue. Surescripts is private; Epic, athenahealth and MEDITECH are private or privately owned; Oracle's health disclosure does not isolate prescribing. We therefore model from transaction counts rather than filings, and label every allocation as an allocation.
The forecast's weakest number is the premium, and we say what happens if it breaks. At 4 per cent value-per-prescription growth instead of 6.42 per cent, 2033 lands at USD 3,611.3 million. If prior authorisation grows at 12 per cent instead of 18.53 per cent, 2033 lands at USD 3,622.0 million. Both fragilities converge on a floor near USD 3.6 billion. The direction is not in doubt; the magnitude is a statement about whether the decision layers get priced or bundled away.
The e-prescription already won. In the United States, 84.4 per cent of prescribers who prescribe electronically are enabled to do so for controlled substances, and 98.3 per cent of pharmacies can receive them; 1.39 million prescribers used the network in 2025, a 4.0 per cent increase on 2024. In England, 1.16 billion of the 1.19 billion prescription items dispensed in 2025/26 — 97 per cent — moved through the Electronic Prescription Service. Transmission is no longer the interesting problem, and it is no longer where the money is.
What has become interesting is everything that now travels alongside the prescription. The Surescripts network carried 30.5 billion transactions in 2025, a 12.3 per cent increase on the 27.2 billion it carried in 2024. Over the same period the network filled 2.6 billion e-prescriptions in 2024, and on a prescription count up roughly 2 per cent in 2025 the ratio now sits at about 11.5 network events for every prescription, against 10.46 a year earlier. Coverage checks, formulary lookups, real-time benefit and price responses, prior-authorisation question sets, medication history, cancel and change messages, and clinical document links all now ride on the same order that used to be a fax.
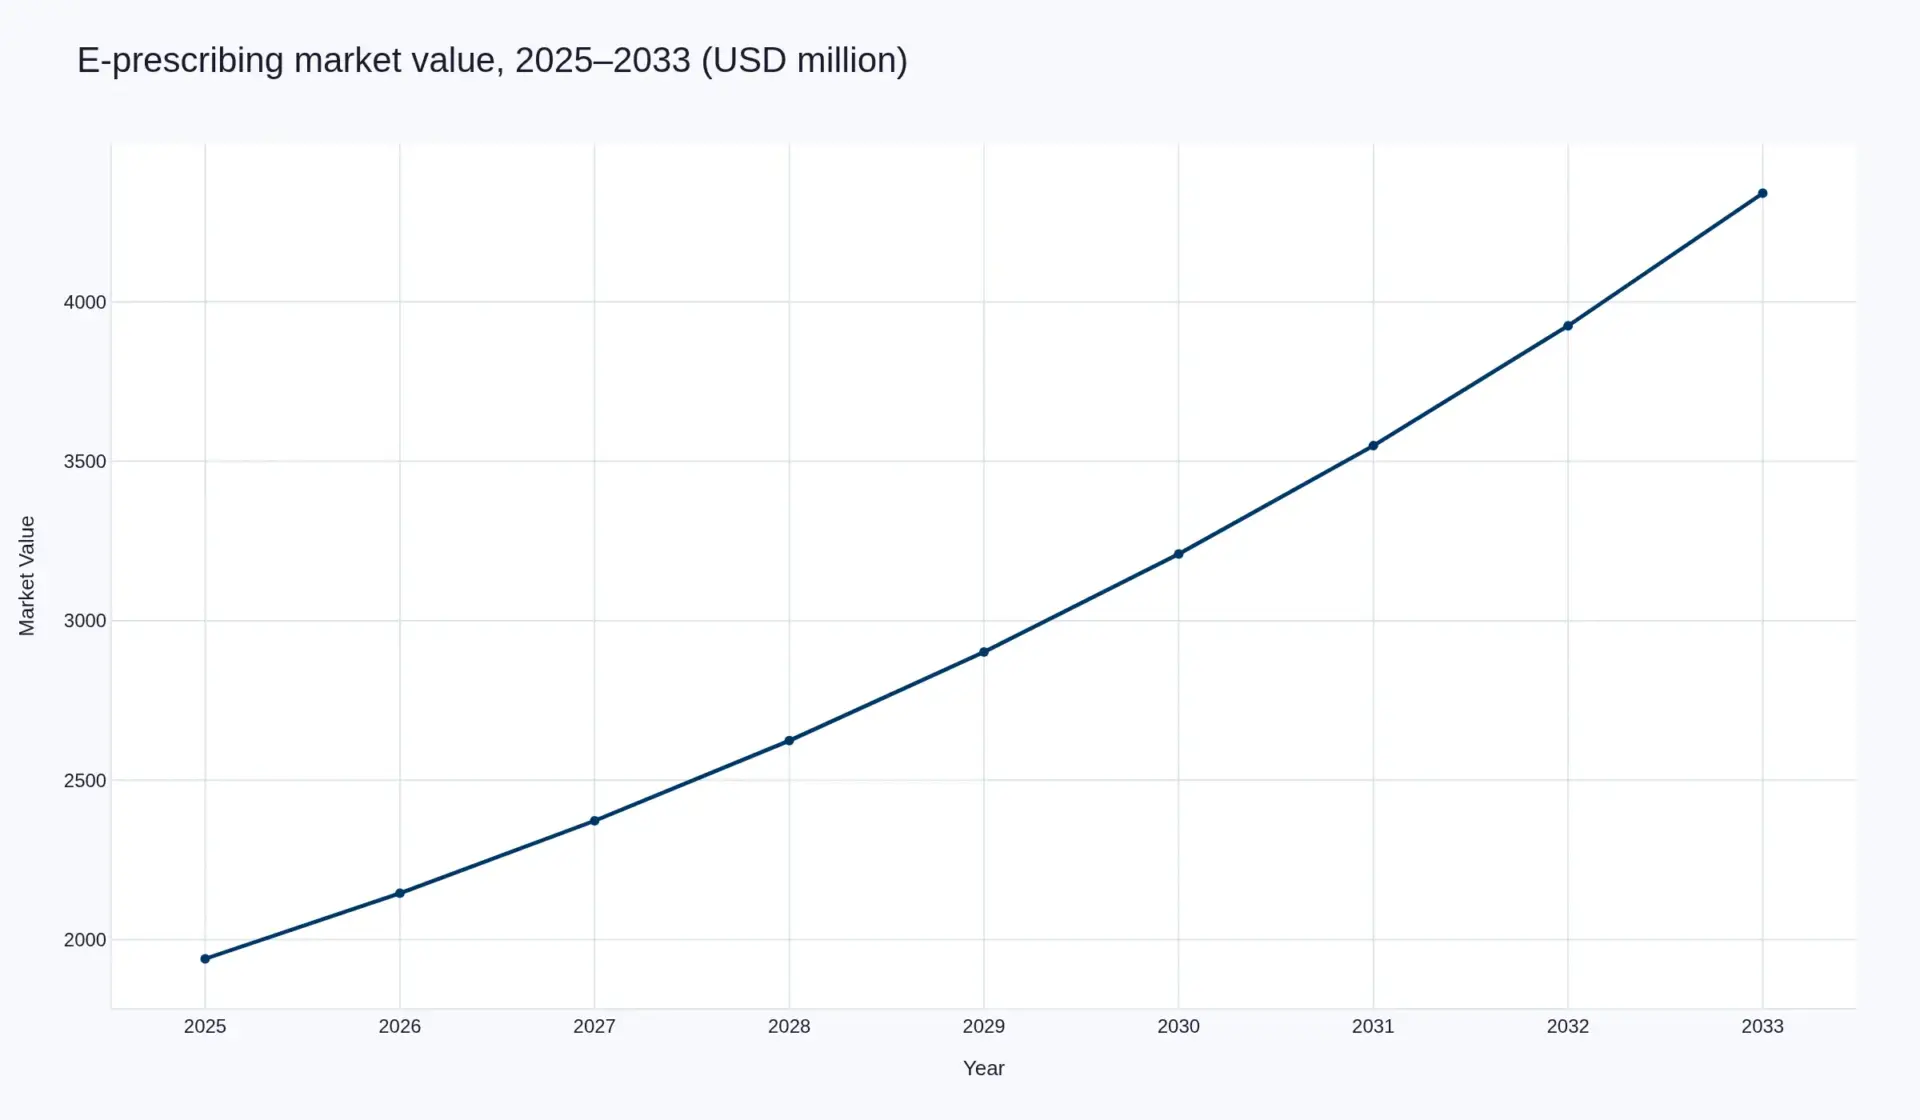
That shift is the argument of this report. The market grows at 10.59 per cent a year, from USD 1,940.0 million in 2025 to USD 4,340.0 million in 2033, while the number of e-prescriptions grows at 3.92 per cent. The gap between those two numbers is not adoption. It is that each prescription carries more paid activity than it did the year before: value per e-prescription rises from USD 0.43 to USD 0.71, a 6.42 per cent annual premium on the same underlying unit.
This is the inverse of what is happening one layer down in the pharmacy. Our pharmacy automation report found a market whose economics were being rescued by rising revenue per surviving installation as the store count fell. E-prescribing has no such scarcity. Prescriptions are abundant and the transmission of them is effectively free. What is scarce is the decision — which drug, at what cost, covered by whom, approved by when — and that is where value has migrated.
What this report measures, and what it deliberately excludes
The scope is prescriber-side software, the networks that carry the transaction, and the decision services attached to the prescription. It excludes pharmacy dispensing systems, automated dispensing cabinets, workflow robots and packaging equipment, all of which sit on the far side of the transaction and are covered in our pharmacy automation and smart pill dispenser reports.
That boundary matters, because it is why the figure here sits below the numbers commonly circulated for this market. Estimates that include pharmacy-side software and dispensing hardware describe a different, larger market. The prescriber-side and network-side market is smaller and more concentrated than it appears, and it is growing for a reason that has nothing to do with more prescriptions being written.
| Metric | 2025 | 2033 | 2026–2033 |
|---|---|---|---|
| Market value (USD million) | 1,940.0 | 4,340.0 | 10.59% CAGR |
| E-prescriptions transmitted (millions) | 4,500 | 6,120 | 3.92% CAGR |
| Value per e-prescription (USD) | 0.43 | 0.71 | 6.42% CAGR |
| Absolute growth | +USD 2,400.0 million, 2.24x | ||
Volume is expressed in millions of electronic prescriptions transmitted. Base-year volume is a Pheonix estimate built from network disclosure: approximately 2,650 million in the United States, 1,160 million in England (an official statistic), and roughly 690 million across the rest of the world. The US and England therefore account for 84.7 per cent of the world's electronic prescriptions — a concentration that shapes almost every conclusion in this report.
Eleven and a half events per prescription
The single most useful number in this market is a ratio, not a total. In 2024 the Surescripts network exchanged 27.2 billion transactions and filled 2.6 billion e-prescriptions — 10.46 events per prescription. In 2025 transactions grew 12.3 per cent while prescription volume grew at roughly a fifth of that rate, taking the ratio to about 11.5, an increase of 10.04 per cent.
A market whose unit count grows at 3.92 per cent and whose value grows at 10.59 per cent is a market where somebody is being paid for the tenth and eleventh event, not the first. The composition of that growth is visible in the network's own disclosure. Real-Time Prescription Benefit returned 1 billion responses to 973,463 prescribers in 2025, saving patients more than USD 55 million at an average of USD 77 per prescription and USD 817 per specialty prescription. Eligibility informed 5.07 billion care events, with 75 per cent of its transactions carrying a primary-coverage indicator. Prior-authorisation automation supported 83 medications, up from 40, returning a median approval in 18 seconds. Electronic prior authorisations grew 19.9 per cent, and 26.1 per cent for specialty medications.
None of those are prescription-transmission revenues. All of them are billed per event, per response, per transaction. That is the market.
Two regulatory clocks, seven years apart
Growth in this market is unusually well scheduled, and the schedule is visible in advance. In the United States, the CMS Interoperability and Prior Authorization final rule (CMS-0057-F) requires Medicare Advantage organisations, state Medicaid and CHIP fee-for-service programmes, Medicaid and CHIP managed care entities and Qualified Health Plan issuers on the Federally Facilitated Exchanges to implement and maintain a HL7 FHIR Prior Authorization API, with compliance dates generally beginning 1 January 2027 and operational provisions generally beginning 1 January 2026. The rule also adds a prior-authorisation measure to the Promoting Interoperability performance category of MIPS and to the Medicare Promoting Interoperability Program for eligible and critical access hospitals — a financial lever pointed directly at prescriber behaviour.
In Europe the clock runs slower and further out. The European Health Data Space Regulation was published in the Official Journal on 5 March 2025 and entered into force on 26 March 2025; the Commission must adopt key implementing acts by March 2027, and the primary-use provisions — including cross-border exchange of Patient Summaries and ePrescriptions and eDispensations — apply from March 2029.
Those two dates explain the shape of the forecast. The United States produces the growth in the middle of the period, through the authorisation layer, on a base that is already saturated at the transaction layer. Europe produces a step-change at the end of the period, from a base that is currently national rather than continental. It is why our European share of value rises from 21 per cent to 26 per cent while North America's falls from 62 to 55, even though North America remains the larger and more profitable market throughout.
| Region | 2025 (USD m) | 2033 (USD m) | Share 2025 → 2033 |
|---|---|---|---|
| North America | 1,202.8 | 2,387.0 | 62% → 55% |
| Europe | 407.4 | 1,128.4 | 21% → 26% |
| Asia-Pacific | 232.8 | 607.6 | 12% → 14% |
| Rest of world | 97.0 | 217.0 | 5% → 5% |
| Total | 1,940.0 | 4,340.0 | 100% |
Where the value sits, and where it is going
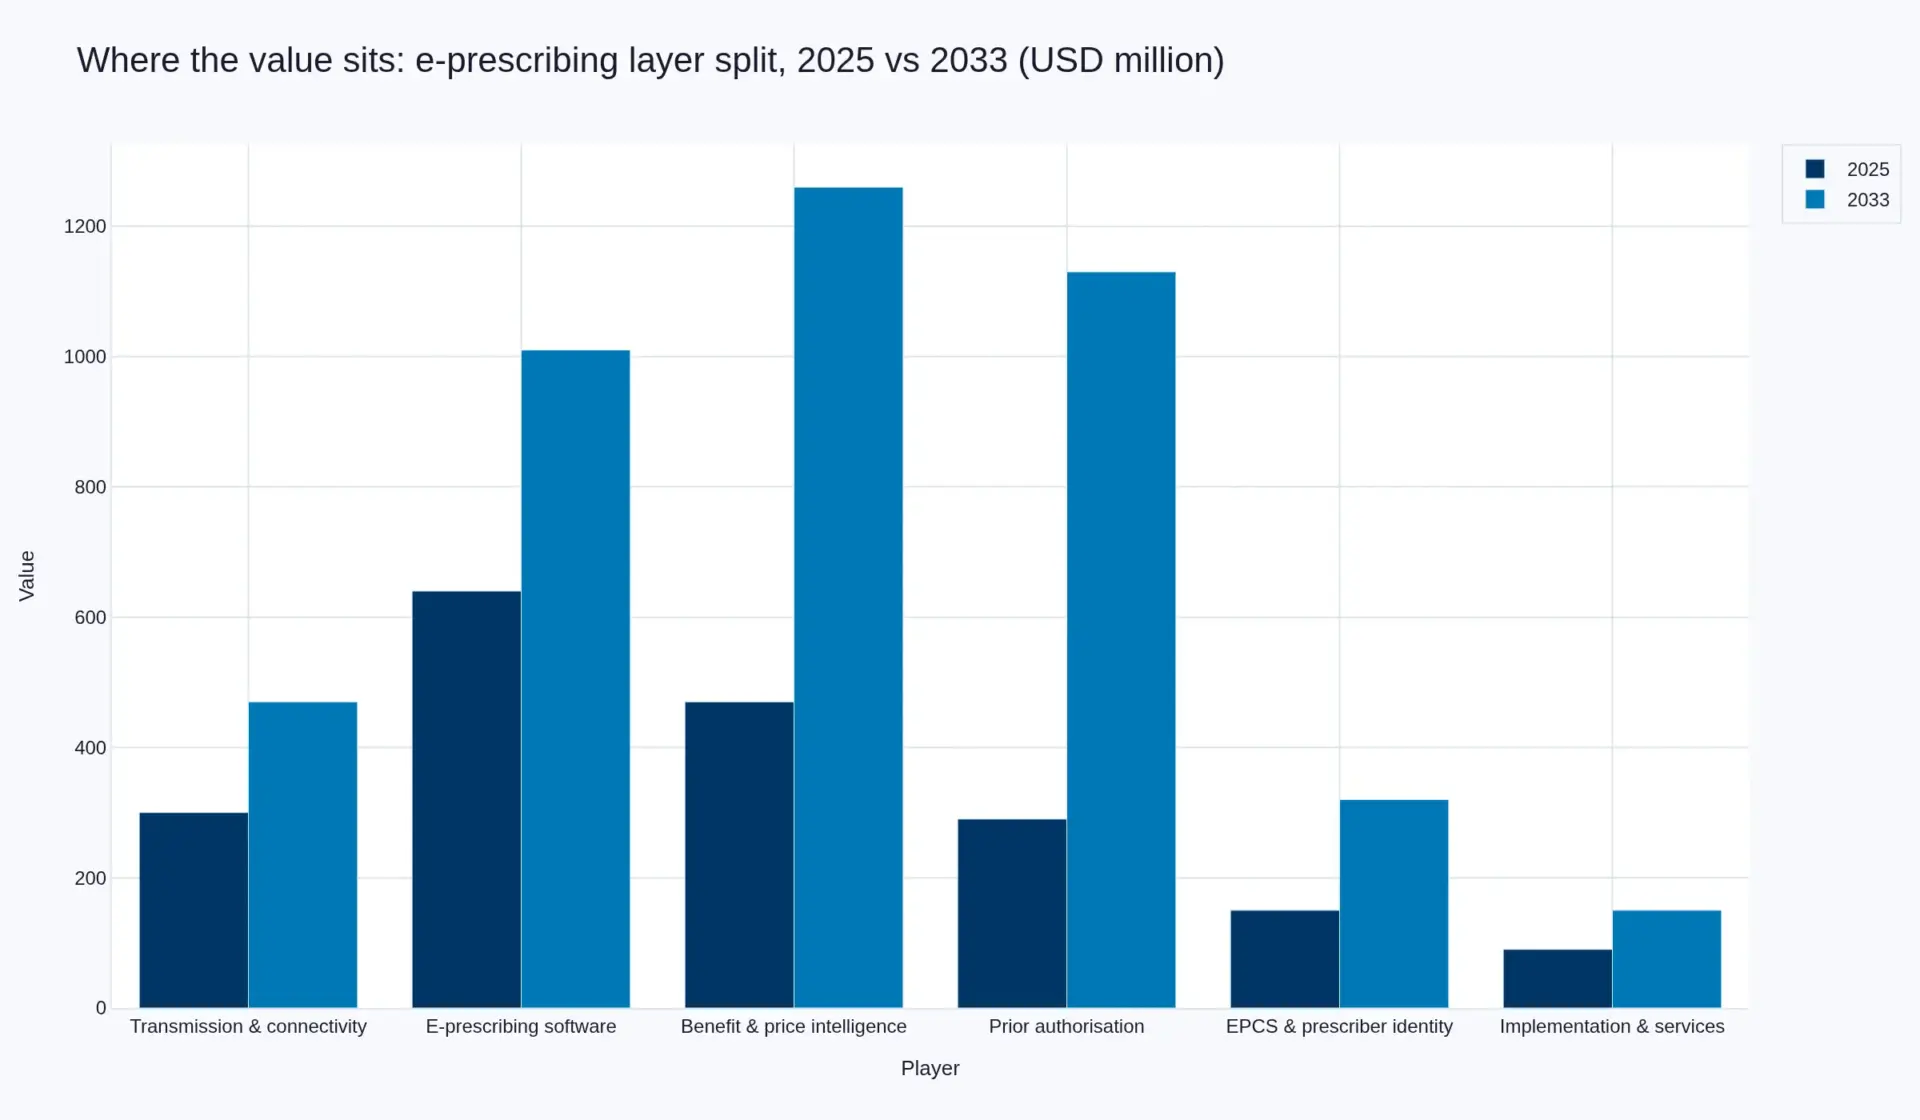
Split the market into six layers and the migration becomes arithmetic rather than assertion. Transmission and connectivity, together with prescriber-side software, carried 48.5 per cent of 2025 value. By 2033 those two layers carry 34.1 per cent. Benefit and price intelligence plus prior authorisation move from 39.2 per cent to 55.1 per cent over the same period.
| Layer | 2025 (USD m) | 2033 (USD m) | CAGR |
|---|---|---|---|
| Transmission & network connectivity | 300 | 470 | 5.77% |
| Prescriber-side e-prescribing software | 640 | 1,010 | 5.87% |
| Benefit & price intelligence | 470 | 1,260 | 13.12% |
| Prior authorisation | 290 | 1,130 | 18.53% |
| EPCS compliance & prescriber identity | 150 | 320 | 9.93% |
| Implementation & support services | 90 | 150 | 6.59% |
| Total | 1,940 | 4,340 | 10.59% |
Prior authorisation is the fastest-growing layer at 18.53 per cent and the one most tightly coupled to a dated obligation. The evidence that it can compress is already public: across Fairview Health Services, Cleveland Clinic and Optum Rx, automated requests ran an 11 per cent lower rate of denials due to lack of information and a 17 per cent lower rate of appeals, and the share of requests abandoned by prescribers fell from 22 per cent to 4 per cent. Fifty-two further health systems were scheduled to go live during 2026. An 18-second decision against a 4 per cent abandonment rate is not a workflow improvement; it is a different product, and it is priced differently.
Articles on this market
- Eleven and a Half Events: The Prescription Stopped Being the Product — why the network now carries about 11.5 events for every prescription, and why the first one is free.
- January 2027 Is the Only Date That Matters in E-Prescribing — CMS-0057-F, the MIPS measure, and why prior authorisation is the only layer with a legal deadline behind it.
Disclosure discipline: 2.7 per cent of this market can be read from a filing
This is the least financially transparent software market in healthcare, and saying so is part of the method. The dominant network operator, Surescripts, is privately held and publishes operational metrics rather than revenue. The dominant EHR vendors — Epic, athenahealth and MEDITECH — are private or privately owned, and Oracle reports health revenue at a level of aggregation that does not isolate prescribing. The nearest clean public read-across is Veradigm, which reported GAAP revenue of USD 584–589 million for fiscal 2025, down about 1 per cent at the midpoint, against a business that spans practice management and revenue cycle as well as prescribing. On a Pheonix allocation of roughly 9 per cent to prescribing workflows, that is about USD 52.8 million — 2.7 per cent of the 2025 base.
We therefore reconcile this market from transaction counts, which are disclosed, rather than from filings, which are not. Every number in the model above is either taken from an official statistic or a company disclosure, or is labelled a Pheonix allocation. Where the two differ in reliability, the arithmetic follows the transaction. Readers who want the filed-revenue view of the software layer underneath e-prescribing will find it in our electronic medical records report.
The most fragile number
The 6.42 per cent annual premium on revenue per prescription is the number this forecast is most exposed to, and it is worth stating what happens if it is wrong. If value per e-prescription grew at 4 per cent instead of 6.42 — that is, if buyers successfully resisted paying for the additional events — 2033 lands at about USD 3,611.3 million rather than USD 4,340.0 million.
The second exposure is the authorisation layer. If prior authorisation grows at 12 per cent rather than 18.53 per cent — roughly the rate you would expect if the 2027 CMS deadline slips a year and the MIPS measure proves weaker than intended — 2033 lands at about USD 3,622.0 million. Both fragilities converge on a floor near USD 3.6 billion, which is a useful way to read the forecast: the direction of this market is not in doubt, and the magnitude is a statement about whether the decision layers are priced or bundled away.
The unquantified risk sits in the controlled-substance channel. The DEA's Special Registrations for Telemedicine and Limited State Telemedicine Registrations rulemaking, docket DEA-407, was published as a proposed rule on 17 January 2025 with comments closing on 18 March 2025 and had not been finalised at the time of writing. Until it is, the telehealth channel for controlled-substance prescribing carries a registration framework that does not yet exist, which affects both the EPCS compliance layer and the specialty demand that flows through it.
How this report was built
The evidence base is weighted 70 per cent secondary and 30 per cent primary, and the two are used for different jobs. Market size, forecast and the layer split are modelled from secondary disclosure and transaction counts — network operating statistics, an accredited official statistic from the NHS Business Services Authority, CMS rulemaking, EU regulation, and company filings. Primary work is used where disclosure stops: the price bands at which decision-layer services are actually sold, the specification chain by which a hospital or large group chooses between an embedded module and a standalone prescribing product, switching costs at renewal, and the payback arithmetic that prescribers apply to authorisation automation.
The primary programme comprises structured interviews with chief medical information officers, pharmacy informatics leads and ambulatory prescribing leads; open-ended interviews with vendor commercial teams across the network, EHR and decision-support layers; conference engagement at ASHP Midyear, HIMSS and the NCPDP annual conference, where NCPDP SCRIPT standard migration is the operative commercial conversation; and a survey of prescribing operations in mixed ambulatory and hospital settings. The full method is set out below.
No competitor research is cited anywhere in this report. Figures that surfaced from third-party market-sizing firms during research were excluded and, where they would otherwise have shaped an estimate, the estimate was rebuilt from the primary disclosure instead. Where our numbers sit below commonly circulated figures for this market, the reason is scope — stated above — and not disagreement about the direction of travel.
Sources
- Surescripts, Annual Impact Report 2025 — network volumes, e-prescriber counts, EPCS enablement, Real-Time Prescription Benefit, Eligibility, prior-authorisation automation, identity verification, CancelRx / RxChange / RxTransfer.
- Surescripts, 2024 Annual Impact Report highlights — 27.2 billion transactions and 2.6 billion e-prescriptions filled in 2024.
- Business Wire, Surescripts Annual Impact Report 2025 release — 12.3 per cent transaction growth, specialty prescription counts, savings per prescription.
- NHS Business Services Authority, General Pharmaceutical Services in England 2016/17–2025/26 (published 15 October 2026) — 1.19 billion items dispensed, 1.16 billion via EPS, 97 per cent electronic.
- Centers for Medicare & Medicaid Services, Interoperability and Prior Authorization Final Rule (CMS-0057-F) — FHIR Prior Authorization API compliance dates, MIPS and Promoting Interoperability measures.
- European Commission, European Health Data Space Regulation — publication 5 March 2025, entry into force 26 March 2025, implementing acts by March 2027, ePrescription application from March 2029.
- Federal Register, Special Registrations for Telemedicine and Limited State Telemedicine Registrations, Docket DEA-407, proposed rule 17 January 2025.
- Veradigm Inc., Business and Strategy Update, 17 February 2026 — preliminary unaudited fiscal 2025 GAAP revenue of USD 584–589 million.
Companies referenced in this report
Surescripts · Epic Systems · athenahealth · Oracle Health · MEDITECH · DrFirst · Veradigm
Part of the Healthcare / Medical Devices segment. Adjacent reports in this cluster: electronic medical records, pharmacy automation systems, artificial intelligence in pharmacy and smart pill dispensers.
Table of Contents
Competitive Landscape
Competitive landscape
The structure is a stack, not a field
E-prescribing does not have a competitive landscape in the ordinary sense. It has four layers with entirely different competitive dynamics, and firms compete within a layer far more than across them.
The network layer is a near-monopoly. Surescripts connects 2.32 million healthcare professionals and provider organisations and virtually every pharmacy, PBM and EHR vendor in the United States, and it handles 30.5 billion transactions a year. There is no second national e-prescribing network of comparable scale. This is not a market share figure — it is a structural fact about how US prescribing is plumbed. The network’s own subsidiary was designated a Qualified Health Information Network under TEFCA in April 2025, which extends the same position into broader health information exchange.
The EHR layer is an oligopoly. Epic, Oracle Health (Cerner), athenahealth and MEDITECH control the surface on which most prescribing happens. Their e-prescribing capability is a feature of a platform sold for other reasons, and their strategic interest is to keep the decision layers inside their own workflow rather than ceding them to third parties. This is the single most important competitive fact in this report: the largest potential competitors to the decision-layer vendors are the platform vendors who already own the screen.
The decision layer is fragmented and contestable. Benefit and price intelligence, prior-authorisation automation and post-transmission collaboration are sold by a mix of network operators, specialist vendors and the platforms themselves. This is where entry is possible, where margins are highest, and where growth is fastest — and, correspondingly, where the incumbents are most likely to absorb functionality into the base platform.
The services layer is regional and low-margin. Implementation, integration and support are delivered locally around national programmes, with little cross-border consolidation and little pricing power.
Why the reported numbers cannot be reconciled into shares
We do not publish vendor market shares for this market, and the reason is methodological rather than coy. Only 2.7 per cent of the 2025 base reconciles to a clean public filing. Surescripts is privately held and publishes operational volumes rather than revenue. Epic, athenahealth and MEDITECH are private or privately owned. Oracle reports health revenue at an aggregation that does not isolate prescribing. The one listed company with a direct read-across, Veradigm, reported GAAP revenue of USD 584–589 million for fiscal 2025 — down about 1 per cent at the midpoint — across a business spanning practice management and revenue cycle, and its own 2025 was dominated by restructuring and remediation rather than growth.
What can be reconciled is behaviour, and it is more useful than a share table. The network grew transactions 12.3 per cent while growing prescribers 4.0 per cent. That gap is the competitive story: value is being added per existing user, not per new user.
The three contestable fronts
Front one: who owns the renewal of the authorisation. Prior authorisation is the largest single value pool in play between now and 2033 at USD 1,130 million, and it sits between the prescriber platform and the payer. Platform vendors want it in the EHR. PBMs want it in their own workflow, with prescribers routed in through portals. Specialist vendors want to mediate. The 2027 CMS API obligation pushes structural power toward whoever holds the FHIR endpoint, which is the payer — but the workflow and the relationship sit with the prescriber, which is the platform. This is unresolved, and it is the most consequential unresolved question in the market.
Front two: whether price intelligence becomes a platform feature. Real-Time Prescription Benefit reached 973,463 prescribers and 1 billion responses in 2025, served by enabled EHRs covering 98 per cent of e-prescribers. That coverage is close to saturation at the platform level, which means the next stage of competition is depth — specialty, cash-pay, therapeutic alternatives — rather than distribution. A capability that ships inside every EHR is a capability whose price converges toward zero unless it keeps adding decisions it alone can make.
Front three: post-transmission, where nobody is entrenched. RxTransfer went from 6 per cent to 24.9 per cent of retail pharmacy locations in a year, and January 2026 exceeded all of 2025. CancelRx and RxChange have low penetration and high stated demand — 98 per cent of pharmacists and 90 per cent of prescribers say change-and-cancel tools would help. No vendor has an unassailable position here, and the switching cost is low because the workflow did not previously exist.
Bid dynamics and lock-in
Our primary interviews with vendor commercial teams and with buying organisations produced a consistent picture of how deals are actually won. Price is rarely the deciding variable. Three things are: whether the capability is native to the workflow the prescriber already uses, whether the vendor can demonstrate a number the buyer’s finance function accepts, and whether the integration is on the buyer’s integration engine or the vendor’s. The third is the real lock-in mechanism. Once a decision-layer service is wired into an EHR’s order-entry flow and the organisation’s interface engine, the cost of removal is an integration project rather than a cancellation, and renewals become near-automatic. This is also why the platform vendors hold the strongest hand: they do not have to be better, only closer.
Consolidation pressure and what to expect
Recent consolidation in this space has been platform-led rather than point-solution-led — the defining transaction being Oracle’s acquisition of Cerner, which moved a major EHR platform into a company with its own cloud and data ambitions. The pressure now runs in one direction: a decision-layer capability that proves it can be priced is a candidate for absorption into a platform, because the platform can bundle it at zero marginal cost to defend its own workflow. The counter-pressure is regulatory: the interoperability and information-blocking regime makes it harder to close a workflow off entirely, which preserves a route to market for specialists that do not own the screen.
For buyers, the practical implication is to contract for portability — data egress, interface documentation and a defined exit — at the point of purchase rather than at renewal, because the bargaining position at renewal is materially worse.
Value Chain
Value chain and cost structure
The e-prescribing value chain has six links, and they are unusual in that the link closest to the patient is the least valuable and the least defensible. Understanding why explains most of the pricing behaviour in this market.
Link one — the prescribing surface
This is the screen inside the EHR or the standalone application where the order is composed. It is the visible product and the least profitable one. It is also, in practice, free: it ships inside practice-management and EHR licences that are sold for other reasons, and standalone prescribing applications at USD 20–40 per prescriber per month compete against a bundled capability that carries no incremental line item. Our primary work with ambulatory prescribing leads found a consistent pattern — no buyer could identify the e-prescribing line in their budget, because there is not one. The cost is absorbed into the platform. This is why the prescriber-side software layer grows at 5.87 per cent, materially below the market, despite being the largest single layer at USD 640 million in 2025.
Link two — identity and compliance
Electronic prescribing for controlled substances is the point at which the free product acquires a cost, because it is the point at which the product must be certified. Two-factor authentication, credential management, DEA-compliant audit trails and institutional identity proofing are mandatory rather than discretionary. The direction of travel is toward stronger, and more expensive, verification: the shift to NIST IAL2 identity assurance, in one network’s case delivered through a partnership with a consumer identity provider, improved verification success from 41 per cent to 80 per cent while making the process 40 per cent faster. Every percentage point of verification success that has to be recovered with a human intervention is a cost in a support queue. At 84.4 per cent EPCS enablement among US e-prescribers, the remaining headroom is roughly a tenth of the base — which is why this layer grows at 9.93 per cent on a small base and settles at USD 320 million by 2033, rather than compounding indefinitely.
Link three — benefit, formulary and price
Before the prescription leaves, it is checked against coverage, formulary status and the patient’s out-of-pocket cost at their chosen pharmacy. This is the first link in the chain where the buyer is not the prescriber. Eligibility informed 5.07 billion care events in 2025 with 75 per cent of transactions carrying a primary-coverage indicator; Real-Time Prescription Benefit returned 1 billion responses to 973,463 prescribers, saving patients more than USD 55 million at USD 77 per prescription and USD 817 per specialty prescription. The economics here are payer- and PBM-funded and priced per response, which is why it grows at 13.12 per cent and why it is the layer least exposed to provider IT budgets.
Link four — prior authorisation
The most expensive link and the fastest growing. Two cost structures coexist. Electronic prior authorisation is a transaction: question sets delivered into the prescriber workflow, answered, returned. It grew 19.9 per cent in 2025 and 26.1 per cent for specialty medications. Automation is a different product at a different price: clinical data from the EHR is matched against the plan’s determination criteria at the moment of prescribing. Median approval time is 18 seconds, the automated approval rate for in-scope medications is 34 per cent, 83 medications were supported in 2025 against 40 in 2024, and 45,275 prescribers were enabled across 20 health systems with 52 more scheduled for 2026. The labour arithmetic is what sells it: prescriber-side abandonment fell from 22 per cent to 4 per cent, denials due to lack of information fell 11 per cent and appeals fell 17 per cent. Each of those is a cost with an owner, and the owner is willing to pay to remove it.
Link five — transmission
The network. It carries the transaction, matches the patient, applies the directory, and returns the response in 39.16 milliseconds at 99.998 per cent average uptime. It is the most important link and the cheapest one: at 300 million dollars against 4,500 million prescriptions, the entire global transmission layer is worth under seven cents a prescription. That is the definition of a utility, and it behaves like one — growing at 5.77 per cent, roughly in line with volume plus a small price effect, and losing share every year.
Link six — post-transmission collaboration
The newest link and the one still being built. CancelRx lets a prescriber stop a medication at the pharmacy. RxChange lets a pharmacist propose a substitution and get approval. RxTransfer moves a prescription between pharmacy locations: 201,999 transactions in 2025, with 24.9 per cent of retail pharmacy locations enabled against 6 per cent in 2024, and January 2026 alone already exceeding the whole of 2025. This is where the prescription stops being a document and becomes a session, and it is the link where a prescriber-side vendor can still build something a competitor cannot instantly copy.
Cost structure of the market as a whole
Capital intensity is low and gross margins are high at every link except services. The dominant costs are connectivity and uptime engineering, directory and data quality, certification and audit, and integration — the last of which is where most implementations fail. Directory quality is not a marketing line: it is the difference between a prescription reaching the right pharmacy first time and a phone call. The market’s structural cost problem is not compute or hardware. It is that the increasingly valuable links are the ones that require cooperation between parties with opposing commercial interests — prescriber, pharmacy, PBM and plan — and cooperation is expensive to organise and slow to price.
Investment Activity
Investment activity
The budget has moved from the platform to the queue
Capital and operating spend in this market follows the value, and the value has moved from buying a platform to removing a delay. The clearest evidence is procedural rather than financial: 52 additional health systems were scheduled to go live on prior-authorisation automation during 2026, against 20 live in 2025. That is a queued, funded implementation programme inside provider organisations, and it is the single largest identifiable investment flow in the market. At an average system scale implied by 45,275 enabled prescribers across 20 systems, the deployment is narrow — 2,264 prescribers per system — which tells you these are targeted launches against the highest-friction medications rather than enterprise rollouts.
Why provider-side investment is accelerating
Three forces are pulling provider capital toward the authorisation layer simultaneously. The first is labour: three in ten prescribers and pharmacists report struggling with limited staff resources, and two-thirds of pharmacists name limited or delayed prescriber response as a main impediment to improving speed of therapy. The second is a measurable financial return: a 22 per cent to 4 per cent collapse in prescriber abandonment, an 11 per cent reduction in denials for lack of information and a 17 per cent reduction in appeals are all direct revenue-cycle effects that a chief financial officer can approve without a strategy debate. The third is the 2027 deadline, which converts a discretionary improvement into a budgeted compliance line.
Payer-side spend is the invisible half
The CMS-0057-F API obligation is a payer capital programme and it is largely invisible in this market’s reported numbers. Impacted payers — Medicare Advantage organisations, state Medicaid and CHIP fee-for-service programmes, Medicaid and CHIP managed care entities and Qualified Health Plan issuers on the Federally Facilitated Exchanges — must implement and maintain HL7 FHIR Prior Authorization and Provider Access APIs, with compliance dates generally beginning 1 January 2027 and operational provisions generally beginning 1 January 2026. That spend lands in payer IT budgets and shows up in this market only as the transaction fees payers subsequently pay. It is, in effect, an unfunded mandate that creates a market: once the endpoint exists, the decision-layer services that use it become purchasable.
Where acquisition money would go
The acquirable assets in this market are not the networks or the platforms — neither is realistically for sale. They are the mid-sized decision-layer specialists with a defensible data position in one narrow problem: specialty authorisation, therapeutic alternative recommendation, prescription transfer, or benefit verification for patient-access programmes. The strategic logic for a platform buyer is defensive — remove a reason for a customer to leave the workflow — and the logic for a payer or PBM buyer is offensive — control the point at which an authorisation decision is influenced.
Two constraints suppress deal activity. The first is valuation: private decision-layer vendors are being asked to price against a market growing 10.59 per cent, which is credible at the total level but not at the growth rate of an individual fast-growing layer, so buyer and seller are usually arguing about which growth rate applies. The second is diligence: with 97.3 per cent of the market built bottom-up rather than filed, a buyer cannot mark a target to a reported market. The diligence has to be done on the target’s own transaction volumes, which is a slower and more bespoke process than a comparable-company analysis.
Research and development direction
Venture and internal R&D spend is concentrated in four areas: automation of the authorisation subset that cannot yet be resolved without human handling; specialty prescribing, where the document burden is heaviest, the transaction values are highest and electronic prior authorisation grew 26.1 per cent in a single year; identity and anti-fraud, driven by the regulator’s focus on diversion; and post-transmission collaboration, where the workflow is genuinely new. Capital intensity across all four is low — this is engineering and data, not infrastructure — which is why the market’s capital intensity reads low and why the barrier to attempting entry is low even though the barrier to succeeding is not.
What the investment case does not support
It does not support building another transmission network. At under seven cents of revenue per prescription across the entire global transmission layer, a new entrant would be competing with an incumbent utility on an asset with near-universal coverage and 99.998 per cent uptime, in order to earn a 5.77 per cent growth rate on 300 million dollars of global revenue. Nor does it support a standalone prescribing application at the prescribing surface, which is free inside platforms that are sold for other reasons. The investable positions are the decision layers, and the strongest of them are the ones attached to a dated obligation.
Technology & Innovation
Technology and innovation
Innovation in this market has moved decisively away from the prescription and toward the three things the prescription triggers: what it costs, whether it will be approved, and whether it should still exist by the time the pharmacist sees it.
The standards migration is the real 2026–2027 event
The commercially significant technical change in this window is not a feature launch. It is the migration of the network to two new NCPDP standards — Real-Time Prescription Benefit Standard v13 and Formulary & Benefit Standard v60 — alongside SCRIPT Standard v2023011, which governs electronic prior authorisation. These upgrades are required for CMS regulatory compliance, but that undersells them. They change what can be said: clearer communication of coverage status and restrictions, refill eligibility date, formulary status, more precise medication specification, and fewer redundant transactions. Every one of those is a reduction in ambiguity that currently costs somebody a phone call. Vendors that complete the migration early get to sell the improved behaviour; vendors that complete it late get to explain a compliance gap at renewal.
Data quality as a billable capability
The least glamorous and most defensible technology in the market is automatic correction of the prescription itself. 12.7 per cent of e-prescribing transactions in 2025 were augmented by machine-learning translation of free-text directions into the Structured & Codified Sig format, and 60 per cent of ambulatory medication-history responses were augmented, up from 52 per cent in 2024. Alongside it, 86 per cent of medication-history responses were augmented with directory and third-party data and 61 per cent were deduplicated. This matters commercially because ambiguity is the mechanism by which an electronic prescription degrades back into a telephone call, and the quantity unit of measure — the field denoting total quantity to be dispensed — is a hard gate: an e-prescription cannot be sent without one, and an ambiguous one sends the pharmacy back to the prescriber. A vendor that removes that failure mode is selling throughput, not software.
Authorisation as a real-time decision engine
Prior-authorisation automation is the most technically ambitious product in the chain and the one with the clearest economics. It works by matching the patient’s clinical data from the EHR against the benefit plan’s determination criteria at the moment of prescribing, and returning a decision without human handling where the match is clean. The published performance — 18 seconds median, 34 per cent automated approval for in-scope medications — is a statement about how narrow the cleanly automatable subset still is. The 66 per cent that cannot be fully automated is the addressable roadmap, and it is the reason the layer is forecast at 18.53 per cent rather than at the rate of a completed technology.
Identity and trust
Prescriber identity has become a security surface. Network operators are moving to NIST IAL2 assurance, adding automated suspicious-activity detection that rejects prescriptions from NPIs generating abnormal transaction patterns, and re-engineering verification so that stronger assurance does not become a support burden. This is defensive work that produces an offensive asset: in a market where fraud and diversion are the regulator’s central concern, verified identity is the precondition for selling into the controlled-substance channel at all.
What is not yet working
Three gaps are worth naming. First, the event count per prescription is rising but the interoperability between those events is not: benefit, authorisation and medication history are still separate round trips against separate endpoints rather than one query. Second, clinical document exchange is growing much faster than the prescribing layer — 5.97 billion clinical document links in 2025, up 40 per cent — and the two streams are not yet joined, so the clinical context that justifies an authorisation often arrives by a different route than the authorisation request. Third, the consumer-facing layer remains thin: patients learn about cost at the counter more often than at the point of prescribing, which is the gap real-time benefit is designed to close and has not yet closed. The network’s own research puts it plainly — nearly all prescribers say out-of-pocket cost is a moderate or major factor in their decisions, while three in four report difficulty determining the total cost to the patient.
Where the next product comes from
The likeliest next commercial product in this market is first-fill abandonment detection at scale — proactive notification when a patient does not collect a new prescription — because it converts an abstract adherence statistic into a specific, assignable, billable intervention. The evidence base already exists: e-prescribing is associated with up to a 10 per cent increase in first-fill adherence against paper, and up to 20.5 per cent when combined with eligibility and formulary insight. Turning that into a paid product is a data-operations problem, not a clinical one, and the operators who already see the fill signal are the ones positioned to sell it.
Market Risk
Market risk
Scenario framework
Three scenarios frame the risk, all anchored on the same 2025 base of USD 1,940.0 million and the same 2033 volume of 6,120 million e-prescriptions. They differ only in what happens to the price of the decision layers.
Base case — USD 4,340.0 million (10.59 per cent CAGR). Value per e-prescription rises from USD 0.43 to USD 0.71 as benefit, price and authorisation events are priced rather than bundled; prior authorisation grows 18.53 per cent on the back of the 2027 US obligation; Europe begins contributing cross-border volume from 2029.
Conservative case — USD 3,611.3 million (8.08 per cent CAGR). Value per e-prescription grows at 4 per cent instead of 6.42 per cent, because platform vendors bundle the decision layers into base licences and buyers refuse to pay separately. Volume is unchanged. This is the single most important sensitivity in the report.
Authorisation-stall case — USD 3,622.0 million. Prior authorisation grows at 12 per cent rather than 18.53 per cent because the CMS compliance deadline slips and the MIPS measure proves too weak to move prescriber behaviour. Volume is unchanged, and benefit and price intelligence is unaffected.
The two downside cases converge near USD 3.6 billion, which is the useful conclusion: the market does not have a volume problem, it has a pricing problem, and the downside is bounded at roughly 17 per cent below base.
Risk one — the platforms absorb the decision layers
This is the largest strategic risk and the one most likely to materialise. Every decision-layer capability sits inside a workflow owned by an EHR platform. If Epic, Oracle Health, athenahealth or MEDITECH decide that price intelligence or authorisation automation is a retention feature rather than a purchased add-on, they can bundle it at zero marginal cost. The 98 per cent EHR coverage of enabled real-time benefit already demonstrates how quickly a decision-layer capability becomes platform infrastructure. The mitigating factor is that the payer side of authorisation is external and cannot be absorbed by a platform, which protects the most valuable layer more than it protects the others.
Risk two — the premium is competed away
The forecast rests on revenue per prescription rising 6.42 per cent a year. Every incentive in the market points the other way: the utility layer is deflationary, the software layer is bundled, and the decision layers are sold to buyers who benchmark every line against a platform they have already paid for. The premium survives only if the decision layers keep adding decisions that the platform cannot make alone — which is a product argument, not a structural one, and it can be lost.
Risk three — regulatory timetable slippage
The forecast has two dated anchors: 1 January 2027 for CMS payer APIs and March 2029 for EHDS ePrescription application. The EU timetable has already been through one long negotiation and depends on implementing acts due by March 2027; slippage in those acts moves the 2029 application date directly. The US timetable is a final rule, which is firmer, but compliance dates that vary by payer type create a staggered implementation in which the last payer sets the effective date for the market.
Risk four — the controlled-substance channel
The DEA’s Special Registrations for Telemedicine rulemaking (docket DEA-407) was published as a proposed rule on 17 January 2025 and had not been finalised at the time of writing. Until it is, telehealth prescribing of controlled substances operates under a registration framework that does not yet exist. This affects the EPCS compliance layer directly — a tenth of the e-prescriber base is not yet enabled and the commercial case for enabling them depends on the channel remaining open — and it affects specialty demand that flows through telehealth channels.
Risk five — concentration in two jurisdictions
84.7 per cent of global e-prescription volume sits in the United States and England. That is a concentration risk of an unusual kind: the market’s growth is not diversified across many national programmes maturing at different times, it is two large programmes, one saturated and one already 97 per cent electronic. Any downside in either is a downside for the whole forecast. The offset is that growth in this market does not come from volume, so saturation in the two dominant jurisdictions is far less damaging here than it would be in a market priced per unit.
Risk six — data quality and the reversion to paper
The electronic prescription is only fully electronic if every field is usable. Ambiguous directions, missing quantity unit of measure, incorrect pharmacy directory entries and duplicate medication-history records each push a transaction back toward a telephone call. The industry’s own numbers show the scale of the remediation effort — 12.7 per cent of e-prescribing transactions needed automated augmentation of directions, 86 per cent of medication-history responses needed augmentation and 61 per cent needed deduplication. A market that cannot keep its data clean eventually pays for it in support cost and in the credibility of its next product.
What would change our view
We would raise the forecast if a platform vendor began pricing decision-layer capability as a separate line item rather than bundling it, which would validate the premium. We would cut it if a major platform announced free, native prior-authorisation automation at enterprise scale, if the CMS 2027 compliance date were formally deferred, or if EHDS implementing acts slipped beyond March 2027.
Regulatory Landscape
Regulatory landscape
E-prescribing is a market created by regulation and shaped by two regulators with entirely different instruments: a US framework that mandates technical endpoints and pays prescribers to use them, and an EU framework that mandates cross-border data exchange on a fixed timetable.
United States — CMS-0057-F and the 2027 API obligation
The CMS Interoperability and Prior Authorization final rule (CMS-0057-F), published January 2024, requires Medicare Advantage organisations, state Medicaid and CHIP fee-for-service programmes, Medicaid managed care plans, CHIP managed care entities and Qualified Health Plan issuers on the Federally Facilitated Exchanges — collectively the impacted payers — to implement and maintain HL7 FHIR APIs covering patient access, provider access, payer-to-payer exchange and prior authorisation. Operational provisions generally begin 1 January 2026; API development and enhancement requirements have compliance dates generally beginning 1 January 2027, varying by payer type. Prior-authorisation information must be added to the Patient Access API by 1 January 2027, and impacted payers must report annual Patient Access API usage metrics from 1 January 2026.
The rule’s commercial significance is in its second mechanism. It adds a prior-authorisation measure to the Promoting Interoperability performance category of MIPS for eligible clinicians, and to the Medicare Promoting Interoperability Program for eligible and critical access hospitals. That converts electronic prior authorisation from a vendor proposition into a scored quality-programme behaviour with payment consequences attached — a far stronger adoption lever than an API mandate alone.
United States — EPCS and controlled substances
Electronic prescribing of controlled substances is governed by a separate federal framework requiring application-level certification, two-factor authentication and audit trails, and by state-level mandates that have made EPCS effectively universal across US retail pharmacy. Enablement now stands at 84.4 per cent of e-prescribers and 98.3 per cent of pharmacies. The remaining gap is the compliance layer’s growth story, and it is sensitive to the telehealth channel: the DEA’s Special Registrations for Telemedicine and Limited State Telemedicine Registrations proposed rule (docket DEA-407, RIN 1117-AB40, 90 FR 6541), published 17 January 2025 with comments closing 18 March 2025, would establish a Special Registration framework with three registration types and heightened prescription, recordkeeping and reporting requirements. It had not been finalised at the time of writing, which leaves the telehealth controlled-substance channel operating under a framework still under construction.
European Union — EHDS and the March 2029 application date
The European Health Data Space Regulation was published in the Official Journal on 5 March 2025 and entered into force on 26 March 2025. Its implementation is staged: the Commission must adopt several key implementing acts by March 2027, and key parts of the Regulation enter into application in March 2029, including, for primary use, the exchange of the first group of priority categories of health data — Patient Summaries and ePrescriptions and eDispensations.
This is the single largest structural change to the European market in the forecast window, and it is why European value share rises from 21 per cent to 26 per cent by 2033. It converts e-prescribing from a set of national systems into a cross-border market with harmonised requirements for EHR systems, and it creates demand for conformance, translation and cross-border resolution services that do not exist at scale today. The risk is timing: the 2029 application date depends on implementing acts due in 2027, and slippage in those acts moves the market directly.
United Kingdom — a completed national programme
England is the reference case for a mature national system. 1.16 billion of the 1.19 billion prescription items dispensed in 2025/26 moved through the Electronic Prescription Service — 97 per cent — across 11,011 community pharmacies, against GBP 10.8 billion of reimbursed drug and appliance cost. There is effectively no transmission market left in England; the regulatory question there is not adoption but the extension of pharmacy clinical services, with 2.49 million items issued through Pharmacy First clinical pathways in 2025/26 representing the direction of travel.
Standards as a regulatory instrument
NCPDP standards carry quasi-regulatory force in this market because CMS compliance depends on them. The 2025–2026 migration to SCRIPT Standard v2023011, Real-Time Prescription Benefit Standard v13 and Formulary & Benefit Standard v60 is therefore a compliance deadline as much as a product upgrade, and it is the operative commercial conversation at the NCPDP annual conference. Vendors that treat it as a compliance cost rather than a capability release will find themselves selling a version behind.
Privacy, security and identity assurance
Prescriber identity is regulated indirectly but firmly: DEA requirements for controlled substances, NIST identity assurance levels now being adopted at IAL2, and state-level prescription drug monitoring programme requirements together make verified prescriber identity a precondition of market access. The trend is toward stronger assurance with lower friction, and vendors that cannot deliver both will lose the controlled-substance channel first and the rest of the workflow afterwards.
What regulation is not doing
No jurisdiction in this forecast window mandates electronic prior authorisation for prescription drugs as such, and no jurisdiction mandates that decision-layer services be priced separately from platforms. That absence is what makes the market’s central question — whether the decision layers get priced or bundled — a commercial question rather than a regulatory one, and it is why the forecast’s downside scenario is a pricing scenario rather than a compliance scenario.
Frequently Asked Questions
How large is the e-prescribing market in 2025?
USD 1,940.0 million in 2025, rising to USD 4,340.0 million in 2033 at a 10.59 per cent CAGR — an absolute addition of USD 2,400.0 million, or 2.24x. Electronic prescription volume grows more slowly, from 4,500 million to 6,120 million prescriptions at 3.92 per cent. The scope covers prescriber-side software, the networks that carry the transaction and the decision services attached to the prescription, and excludes pharmacy dispensing systems, dispensing cabinets and packaging automation. That exclusion is why the figure sits below numbers commonly circulated for this market, which usually include pharmacy-side software and hardware.
Why is the e-prescribing market growing faster than prescription volume?
Because each prescription now carries more paid activity than it did the year before. The Surescripts network exchanged 27.2 billion transactions against 2.6 billion e-prescriptions filled in 2024 — 10.46 events per prescription. In 2025 transactions grew 12.3 per cent to 30.5 billion while prescription volume grew at roughly a fifth of that rate, taking the ratio to about 11.5, an increase of 10.04 per cent. Those additional events are benefit checks, real-time price responses, prior-authorisation requests and medication-history lookups, all billed per event. Value per e-prescription therefore rises from USD 0.43 to USD 0.71, a 6.42 per cent annual premium on a unit whose count grows 3.92 per cent.
What happens to the market when the CMS prior-authorisation APIs go live in January 2027?
Prior authorisation becomes the fastest-growing layer in the market, at 18.53 per cent CAGR from USD 290 million in 2025 to USD 1,130 million in 2033. CMS-0057-F requires impacted payers — Medicare Advantage, state Medicaid and CHIP fee-for-service and managed care, and QHP issuers on the Federally Facilitated Exchanges — to implement HL7 FHIR Prior Authorization APIs, with compliance dates generally beginning 1 January 2027, and it adds a prior-authorisation measure to MIPS Promoting Interoperability. The economics that make it sellable are already published: an 18-second median approval time, a 34 per cent automated approval rate for in-scope medications, and prescriber abandonment falling from 22 per cent to 4 per cent. If the deadline slips and growth comes in at 12 per cent instead of 18.53 per cent, 2033 lands at USD 3,622.0 million rather than USD 4,340.0 million.
How much of this market can be verified from company filings?
Only 2.7 per cent. Surescripts, the dominant network, is privately held and publishes operational volumes rather than revenue. Epic, athenahealth and MEDITECH are private or privately owned, and Oracle's health disclosure does not isolate prescribing. The only clean public read-across is Veradigm, whose preliminary unaudited fiscal 2025 GAAP revenue of USD 584–589 million spans practice management and revenue cycle as well as prescribing; on a Pheonix allocation of about 9 per cent to prescribing workflows, that is roughly USD 52.8 million, or 2.7 per cent of the base. We therefore reconcile this market from disclosed transaction counts rather than filings, and every allocation is labelled as an allocation.