
Press Release
E-Commerce Platforms Took USD 480 Billion of Rent on a USD 7.95 Trillion Market — and the Take Rate Moved 1.54 Basis Points
Platforms kept USD 480 billion of a USD 7.95 trillion market in 2025 — and the take rate moved 1.54 basis points
Pheonix Research today publishes Global E-Commerce Platform Market Report, Size, Share and Forecast 2026–2033: USD 480 Billion of Rent on a USD 7.95 Trillion Market, which sizes what platform operators keep — commission, subscription and platform services booked on someone else’s sale — at USD 480.0 billion in 2025, rising to USD 928.7 billion by 2033 at an 8.60 per cent CAGR, an increment of USD 448.7 billion.
Set against the sales that generate it, the entire platform layer takes 6.04 cents on every dollar of global e-commerce gross merchandise value — a rent line of USD 480.0 billion on a sales line of USD 7,950.0 billion. The two numbers are routinely used interchangeably, and the report’s central argument is that they cannot be: the sales layer grows 7.01 per cent a year to 2033 and the rent layer grows 8.60 per cent, because platforms are charging more per transaction as well as processing more transactions.
| Global e-commerce platform market | 2025 | 2033 forecast | Growth |
|---|---|---|---|
| Platform revenue | USD 480.0 billion | USD 928.7 billion | 8.60% CAGR, 1.93× |
| Increment 2025–2033 | — | USD 448.7 billion | 93.5% of the 2025 base |
| Rent per dollar of e-commerce GMV | 6.04 cents | — | on USD 7,950.0bn of sales |
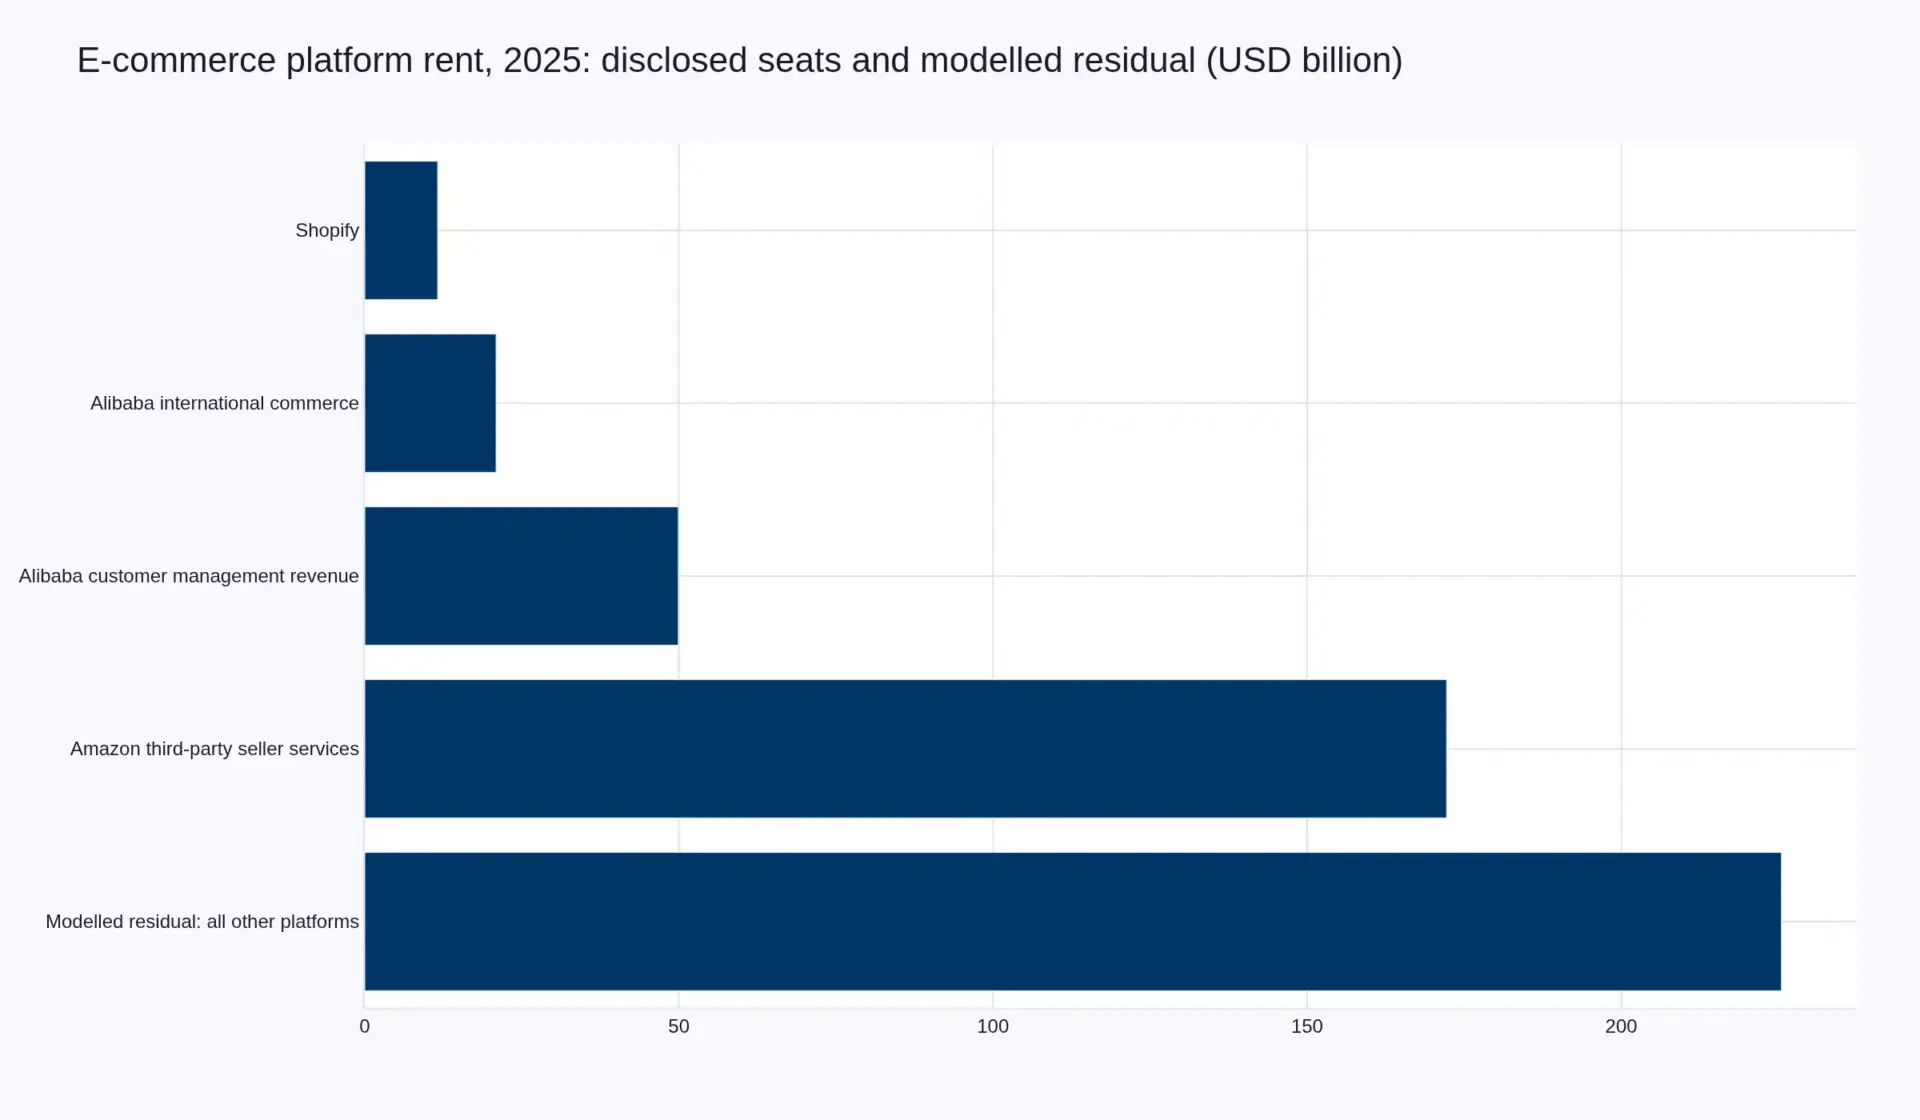
| Disclosed seats, three platforms | USD 254,468m | — | 53.01% of the 2025 layer |
| Growth arithmetic | 7.01% GMV | + take-rate drift | 1.59 points of drift |
A platform is not a retailer, and the difference is USD 544.8 billion
Amazon booked USD 716,924 million of net sales in 2025. The overwhelming majority of it was not platform revenue. USD 269,287 million was Amazon selling its own inventory as seller of record, USD 22.6 billion came from physical stores and USD 128.7 billion from AWS. The line that describes a platform business — third-party seller services, the commissions and related fulfilment and shipping fees earned for enabling someone else’s sale — was USD 172,162 million, or 24.0 per cent of the total.
The report measures the platform layer only as revenue a platform books on someone else’s transaction: commissions, subscription and platform fees, and platform services sold to sellers — fulfilment, logistics-as-a-service, seller-funded advertising and payments the platform processes itself. First-party product revenue is excluded, on the grounds that a platform which buys and resells inventory is not collecting rent, it is carrying inventory risk.
Three platforms disclose 53.01 per cent of the layer
Only a handful of platform companies split the third-party line out of total revenue, which makes the disclosed base unusually concentrated — and unusually hard evidence.
| Platform line, fiscal 2025 | Revenue (USD m) | What it measures |
|---|---|---|
| Amazon third-party seller services | 172,162 | Commissions plus related fulfilment and shipping fees on third-party sales |
| Alibaba customer management revenue | 49,850 | RMB 343,867m; marketing and commission revenue on China retail GMV |
| Alibaba international commerce | 20,900 | RMB 144,170m; cross-border retail and wholesale platform revenue |
| Shopify | 11,556 | Subscription plus merchant solutions on USD 378,441m of merchant GMV |
| Disclosed seats | 254,468 | 53.01 per cent of the 2025 layer |
| Modelled residual | 225,532 | 46.99 per cent of the layer; platforms that do not split out the third-party line |
The residual is modelled, not disclosed, and the report names what sits inside it rather than blending it: PDD Holdings, JD.com’s marketplace line, MercadoLibre, eBay, Sea Limited, Coupang, Walmart’s marketplace, TikTok Shop, Etsy and the commerce-software long tail behind Shopify. A 25 per cent error in that residual moves the 2025 base to USD 423.6 billion or USD 536.4 billion — wide enough to matter, narrow enough that the direction of 2033 does not change. The disclosed seats are treated as a floor and as the only hard evidence in the sizing.
The take rate is the story
Shopify grew merchant GMV 29.48 per cent in 2025, from USD 292,275 million to USD 378,441 million, and revenue 30.14 per cent, from USD 8,880 million to USD 11,556 million. The two rates are almost identical, which is the finding: monetisation barely moved, from 3.0382 to 3.0536 per cent of GMV — an increase of 1.54 basis points.
A basis point and a half is the entire pricing story of the largest independent commerce platform in the world in a year its GMV rose 29 per cent. Competitive pressure, merchant mix and the deliberate choice to leave payments and capital products optional all hold the take rate in a narrow band. The revenue growth is a volume story; the pricing power is a rounding error that compounds.
It is not true everywhere. Alibaba’s customer management revenue rose 5 per cent in fiscal 2026 against total revenue growth of 3 per cent (11 per cent like-for-like), and the company attributes the gap to improvement in take rate — monetisation rising faster than volume, achieved by charging sellers more effectively rather than by selling more. Amazon’s third-party seller services grew 10.26 per cent against 9.01 per cent for first-party online stores, while its seller-facing advertising line grew 22.10 per cent to USD 68,635 million. Two of the three disclose rising monetisation; the third discloses it in advertising rather than in commission.
Why the rent layer outgrows the sales layer
Platform revenue is the product of two variables: third-party GMV and the rate applied to it. GMV grows 7.01 per cent a year over 2026–2033 in Pheonix’s global e-commerce forecast. The platform layer grows 8.60 per cent. The 1.59-point difference is take-rate drift.
The mechanism is unglamorous and visible in every set of results above. When volume growth decelerates, a platform has three options: sell more, charge more per transaction, or capture adjacent lines the merchant used to buy elsewhere — fulfilment, advertising, payments, credit, returns. The first is contested by other platforms. The second is constrained by merchant tolerance. The third is where the growth has actually come from, and it is why a platform’s revenue mix drifts toward services as its marketplace matures.
The constraint is the same everywhere: a merchant who can move to a composable stack, a regional marketplace or a direct storefront will do so once total cost of the channel crosses their own threshold. Take-rate drift is therefore a slow variable with a hard ceiling, and any forecast that accelerates it is really forecasting merchant inertia.
What would change the forecast
- The residual, first. Just under half the 2025 base — USD 225,532 million — is not disclosed by anyone. A reader who distrusts that build should use the disclosed seats as a floor and read the growth rate rather than the level.
- The take-rate ceiling. Commission is the most transparent price a platform charges and therefore the easiest to compare; every basis point above a competitor is a merchant conversation. If the mix shift into services stops carrying the 1.59 points, the layer converges on the sales rate.
- Machine-mediated discovery. If a model assembles the shopper’s shortlist, a marketplace’s search advertising inventory is worth less, and defensibility moves to catalogue completeness and delivery truth. That is a revenue-mix risk that lands on advertising before it lands on commission.
- Subsidised frequency. Quick commerce competition has moved from convenience to price, and the subsidy is funded out of platform revenue — compressing margin before it compresses take rates. Alibaba’s quick commerce revenue rose 47 per cent to RMB 78,520 million in the same year it raised rent on the core marketplace, which is both at once.
About the report
Global E-Commerce Platform Market Report, Size, Share and Forecast 2026–2033 measures platform-attributed revenue — commission, subscription and platform services on third-party and merchant commerce — across market overview, competitive landscape, value chain, investment activity, technology and innovation, market risk and regulatory landscape. It is built on national statistics and company filings in that order of priority: US Census Bureau quarterly retail e-commerce data (USD 340.2 billion in the second quarter of 2026, 17.1 per cent of total retail), National Bureau of Statistics of China online retail of physical goods (RMB 13,092.3 billion, 26.1 per cent of retail), and the Amazon, Alibaba and Shopify filings behind every disclosed seat. No licensed third-party market size is used and no competitor research house is cited. Roughly 70 per cent of the evidence is secondary; 30 per cent is Pheonix primary work — interviews with marketplace commercial teams, merchant finance leads and fulfilment operators, conference-floor conversations and a survey of cross-border sellers — which establishes how take rates are set and capped rather than any magnitude.
Related Pheonix research
The sales layer this rent is charged on is sized in our global e-commerce market report, which puts 2025 at USD 7,950.0 billion. The payment line is covered in our digital payment gateway report, where twenty-six basis points are falling rather than rising, and in our Japan digital payment acceptance report on the last mile of acceptance economics. The subsidised-frequency constraint is examined in our India quick commerce report.
Editorial analysis
On the 1.54 basis points and what a decade of volume growth without pricing growth means: Shopify Grew GMV 29.48 Per Cent and Revenue 30.14 Per Cent. That 0.66 Points Is the Platform Market. On why the disclosed base is only half the layer, and what the other half is worth: Two Countries Are 47.69 Per Cent of Global E-Commerce. The Other 52 Per Cent Is a Model.
About Pheonix Research
Pheonix Research publishes market intelligence built from primary trade, government and company disclosure rather than licensed third-party sizing. Coverage spans industries, segments and country markets, with datasets, forecasts and competitive structure published as a connected graph rather than as isolated reports. pheonixresearch.com