Company Profile
Procter & Gamble
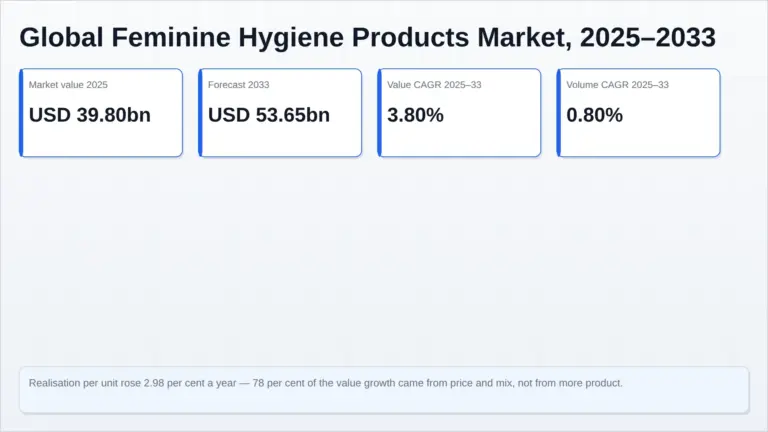
The Procter & Gamble Company (NYSE: PG) is a Cincinnati-headquartered consumer goods company selling in ten product categories across five reportable segments, with operations in approximately 70 countries. Its feminine care brands are Always and Whisper, and its baby care business is built on Pampers. P&G is the largest of the eight owners modelled on Pheonix Research’s Global Feminine Hygiene Products Market report, at 16.4% of a market sized at US$39,800m in 2025.
Identifiers
| Legal name | The Procter & Gamble Company |
|---|---|
| Listing | New York Stock Exchange, ticker PG |
| Headquarters | Cincinnati, Ohio, United States |
| Incorporated | 1890; 136 consecutive years of dividend payments |
| Fiscal year | 1 July to 30 June |
| Wikidata ID | Q212405 — label “Procter & Gamble”, described as an American multinational consumer goods corporation |
| Pheonix entity ID | MIEN-node_5c51ec42 |
| Official website | pg.com |
| Investor relations | pginvestor.com |
| Regulatory filings | SEC EDGAR, CIK 0000080424 |
| Pheonix coverage | Named against this Wikidata identifier on the Global Feminine Hygiene Products Market report, and discussed in The pad got shorter because nobody measures the absorbent core and Seventeen countries removed the tampon tax |
Executive Summary
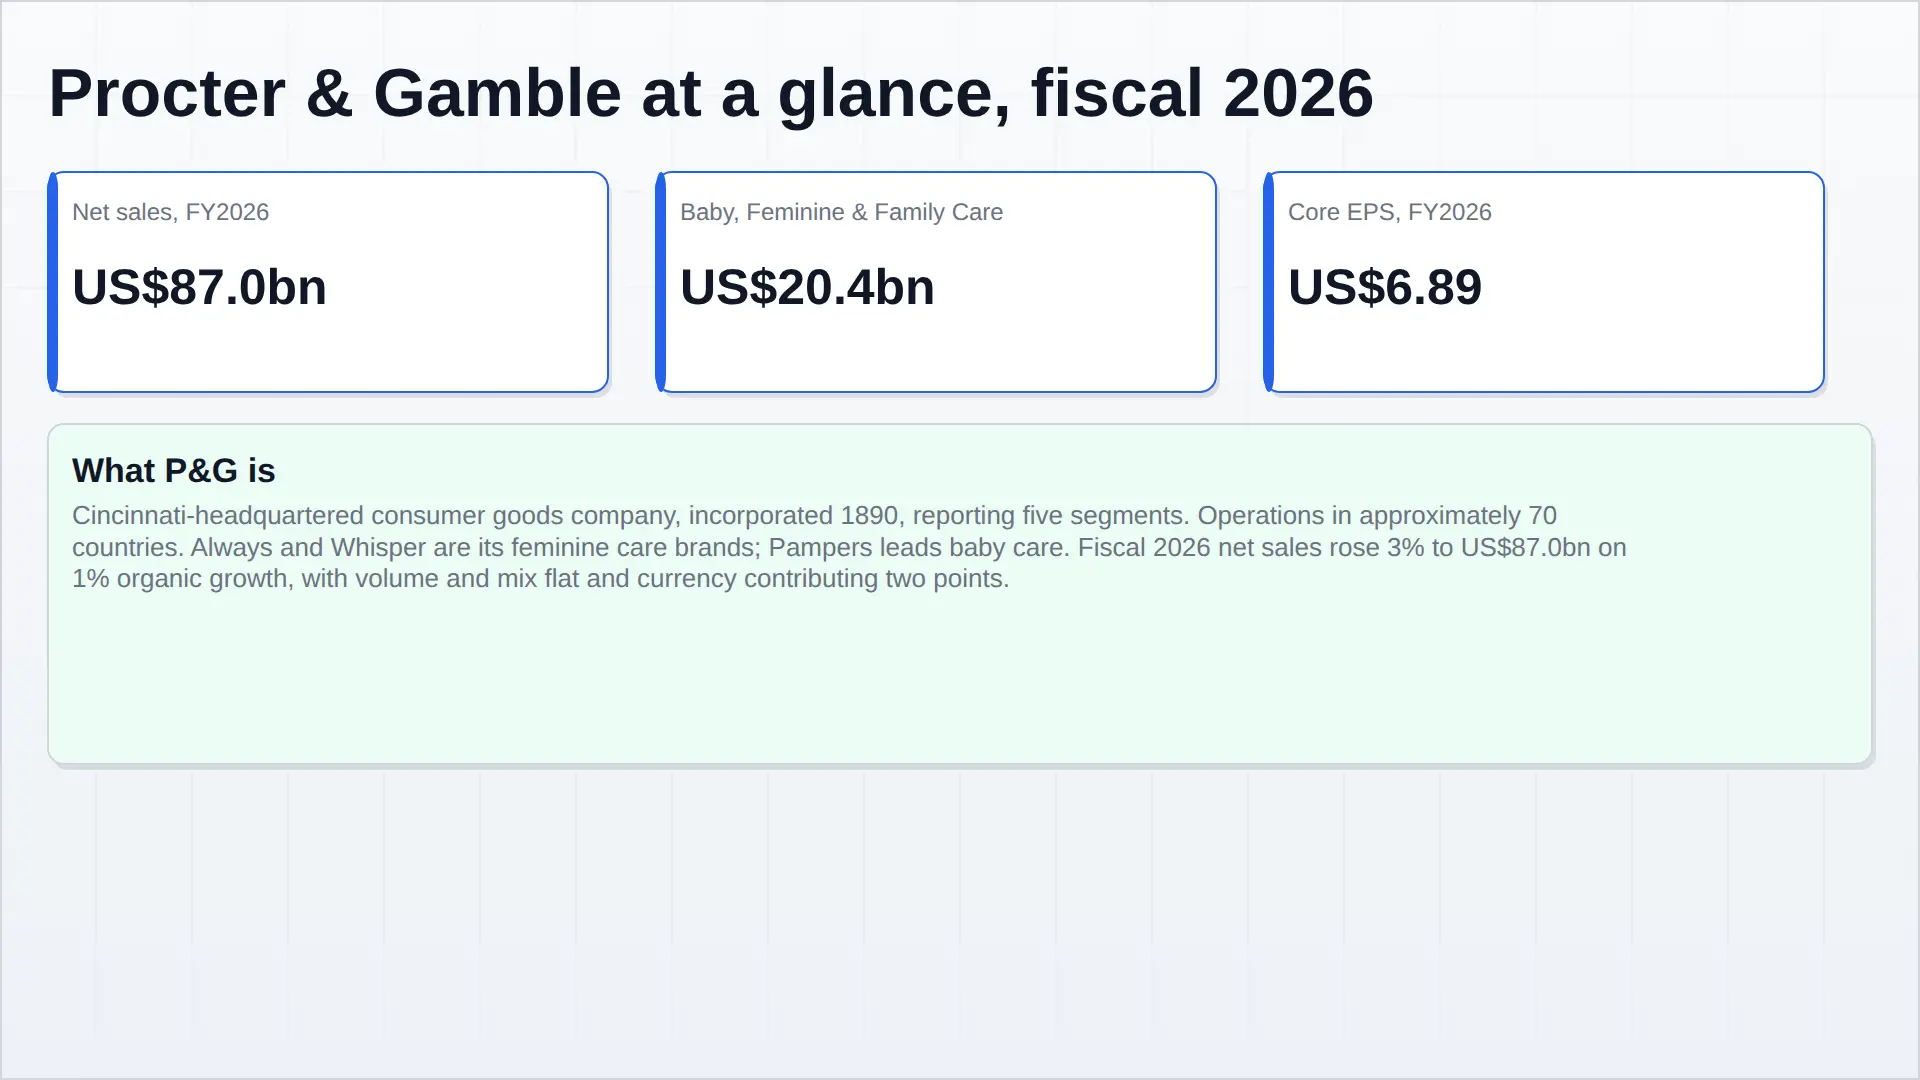
P&G sells in ten product categories — Fabric Care, Home Care, Baby Care, Feminine Care, Family Care, Hair Care, Skin & Personal Care, Oral Care, Personal Health Care and Grooming — organised into five reportable segments. In the fiscal year to 30 June 2026 it reported net sales of US$87,032m, an increase of 3% on the prior year. That increase decomposes into two points of favourable foreign exchange and one point of price, with volume and mix unchanged; organic sales, which strips out currency and acquisitions, grew 1%. Diluted earnings per share were US$6.62, up 2%, and core earnings per share were US$6.89, up 1%. Currency-neutral core EPS was unchanged.
|
US$87.0bn FY2026 net sales, up 3% — of which two points were currency |
US$6.89 FY2026 core EPS, up 1% on a GAAP diluted EPS of US$6.62 |
US$20.4bn Baby, Feminine & Family Care net sales, 24% of the group |
+4% Q1 FY2027 organic sales growth, the strongest quarter since 2022 |
The two halves of the fiscal year moved differently. Organic sales were up one point in the first half and two points in the second, and the fourth quarter — the three months to 30 June 2026 — was flat on an organic basis, with net sales of US$21,203m (+2%), diluted EPS of US$1.26 (down 15%) and core EPS of US$1.43 (down 3%). Baby, Feminine & Family Care organic sales fell 2% in that quarter. The first quarter of fiscal 2027, reported on 22 October 2026, reversed the pattern: net sales of US$23.3bn, up 4%, organic sales up 4% on volume growth of 2.4 points, 0.4 points of price and just over a point of mix, with all ten categories and all six regions growing.
Key Highlights
| Period | Highlight |
|---|---|
| FY2026 | Net sales US$87,032m (+3%), organic sales +1% on price, volume and mix flat. Net earnings US$16,144m at an 18.5% net margin. Diluted EPS US$6.62 (+2%), core EPS US$6.89 (+1%). |
| FY2026 cash and returns | Operating cash flow US$19,556m, capital spending US$4,409m, adjusted free cash flow US$15,835m at 100% productivity. Over US$15bn returned: US$10,232m of dividends and US$5,028m of buybacks. The 70th consecutive annual dividend increase. |
| Q4 FY2026 | Net sales US$21,203m (+2%); organic sales flat; diluted EPS US$1.26 (−15%), core EPS US$1.43 (−3%). Baby, Feminine & Family Care organic sales −2%, with Feminine Care down low single digits on a European volume decline. |
| Q1 FY2027 | Net sales US$23.3bn (+4%); organic sales +4% (volume +2.4, price +0.4, mix +1.1); core EPS US$2.00 (+1%); core gross margin 50.0% (−150 basis points); core operating margin 25.9% (−80 basis points); free cash flow productivity 93%. |
| Restructuring | Portfolio and productivity plan announced June 2025: US$1–1.6bn of before-tax non-core charges over two years, more than half incurred in FY2026, alongside a 15% reduction in non-manufacturing headcount. |
| FY2027 guidance | All-in sales growth 2–4%, organic sales growth 1–3% and core EPS of US$6.89–7.11, absorbing US$1.9bn after tax of input-cost and below-the-line headwinds — US$0.79 per share, or 11% of FY2026 core EPS. |
Company Overview
Business Description
The portfolio is deliberately concentrated in categories where performance is demonstrable to the consumer. Fabric & Home Care is the largest segment at US$30,314m of FY2026 net sales, 35% of the group, carrying Tide, Ariel, Gain, Downy, Lenor, Febreze, Dawn, Fairy, Ambi Pur, Bounty and Charmin. Baby, Feminine & Family Care is second at US$20,401m, or 24%, and contains the three categories most exposed to demography: Pampers in baby care, Always and Whisper in feminine care, and Puffs, Charmin-adjacent family tissue lines in family care. Beauty (US$16,023m, 19%) carries Pantene, Head & Shoulders, Olay and SK-II; Health Care (US$12,456m, 14%) carries Oral-B, Crest and Vicks; Grooming (US$6,918m, 8%) carries Gillette and Venus.
Feminine care is not disclosed as a separate line. It sits inside the second-largest segment, which is also the segment where the group’s growth problem is most visible: Family Care declined in FY2026 and Baby, Feminine & Family Care was the only segment with negative organic sales in the fourth quarter. P&G reports feminine care category growth, not revenue — FY2026 was “in-line to up low single digits”, and Q1 FY2027 was low single digits on favourable product mix and innovation-based pricing in North America, partly offset by a unit volume decline in Europe.
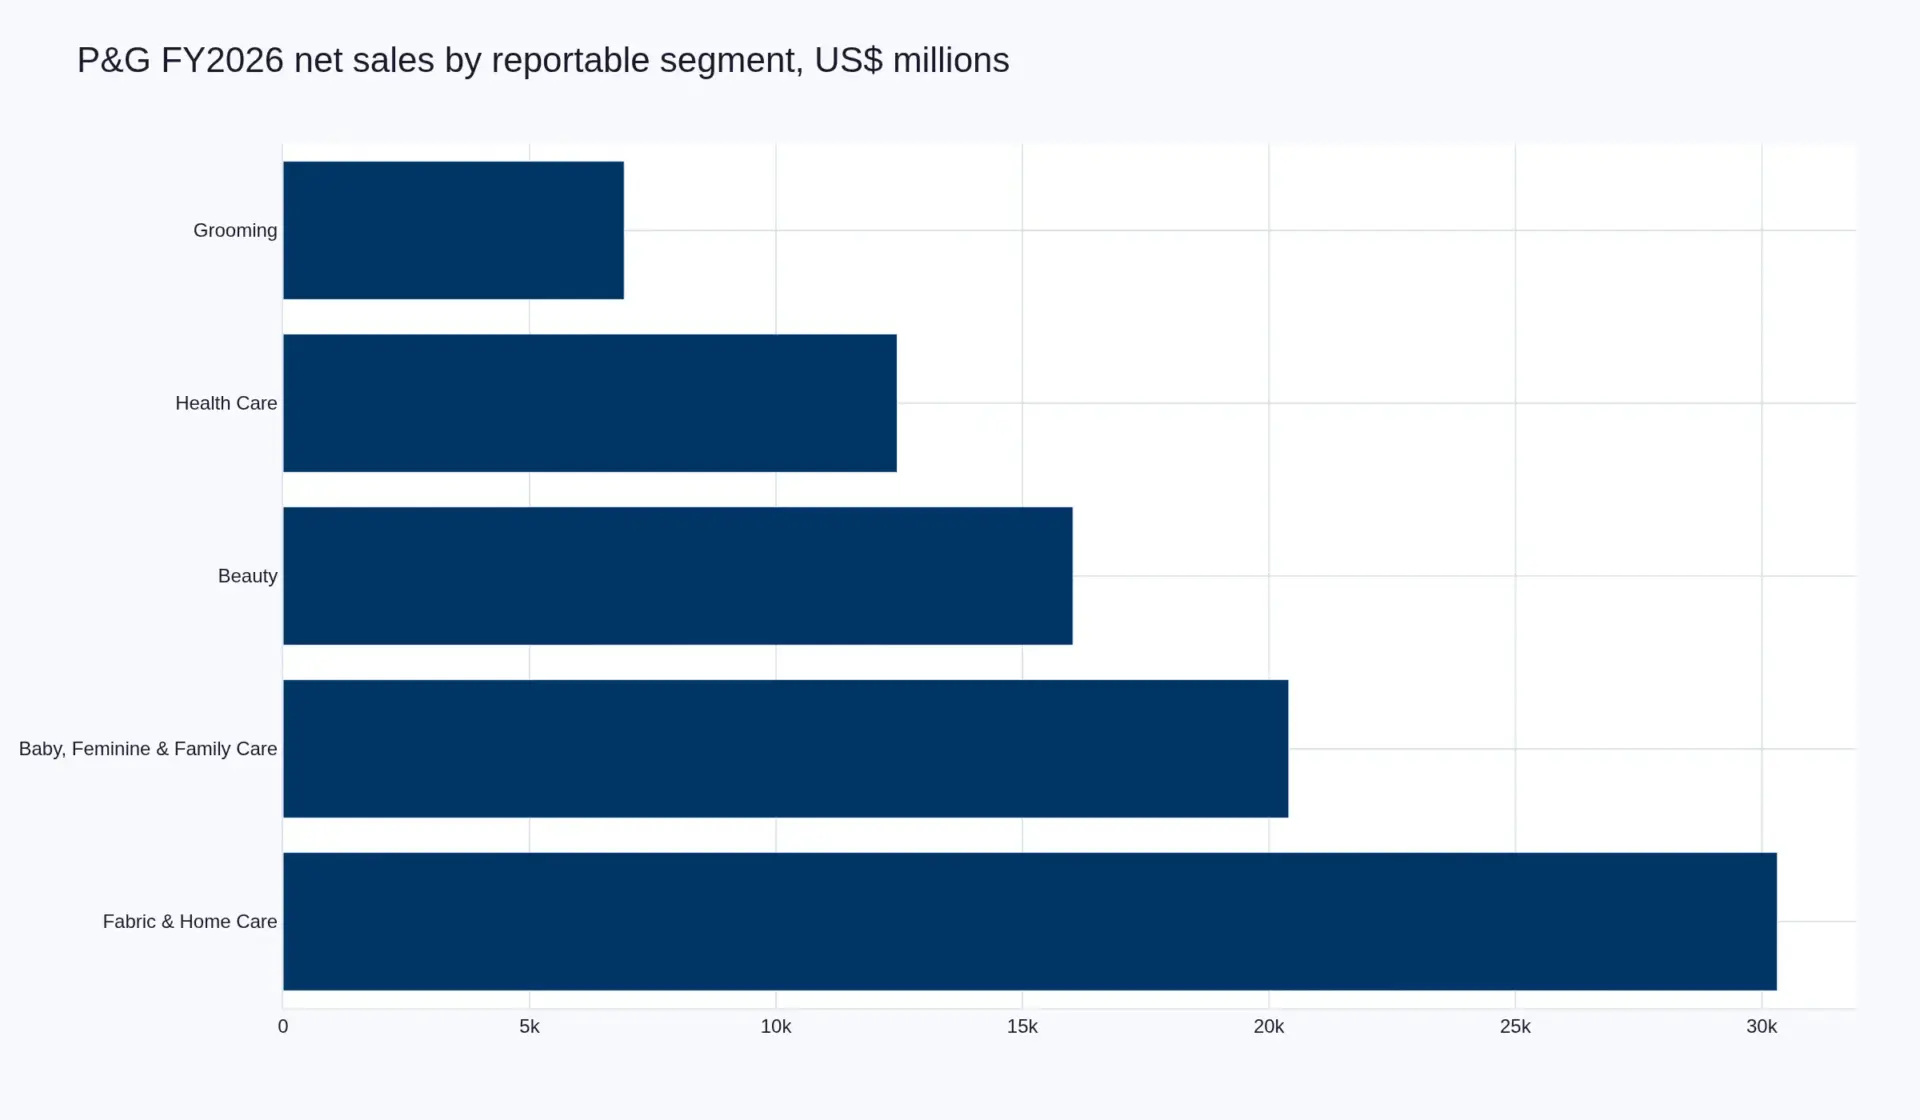
| Segment | Net sales | Share of net sales | Earnings before tax | Net earnings |
|---|---|---|---|---|
| Fabric & Home Care | 30,314 | 35% | 7,290 | 5,632 |
| Baby, Feminine & Family Care | 20,401 | 24% | 5,145 | 3,930 |
| Beauty | 16,023 | 19% | 3,473 | 2,672 |
| Health Care | 12,456 | 14% | 3,163 | 2,404 |
| Grooming | 6,918 | 8% | 1,966 | 1,529 |
| Corporate | 919 | — | (660) | n/a |
| Total | 87,032 | 100% | 20,377 | 16,144 |
Organisational Structure and Footprint
The company reports five segments and six geographic regions, of which North America is 51% of net sales and Europe 23%. Latin America, Greater China and Asia Pacific are each 7% and India, Middle East & Africa 5%. The regional structure changed in fiscal 2027: the enterprise-market grouping is now Latin America, Asia Pacific Enterprise and a newly combined IMEA — India, Middle East, Turkey and Africa — alongside a single Europe region.
| Region | Share of net sales | Q1 FY2027 organic sales |
|---|---|---|
| North America | 51% | +3%, with volume up 3 points in the United States |
| Europe | 23% | +4%, led by the United Kingdom in high single digits |
| Latin America | 7% | +4%, with Mexico up double digits |
| Greater China | 7% | +8%, led by Pampers and SK-II |
| Asia Pacific | 7% | Enterprise Asia Pacific +2%, still affected by portfolio restructuring |
| India, Middle East & Africa | 5% | +8% in the newly combined IMEA region |
Headcount and plant-level detail are not disclosed in the fourth-quarter release. What the filings do show is a deliberately shrinking overhead: the productivity plan announced in June 2025 cuts non-manufacturing headcount by 15%, and management said on the October 2026 call that the reduction has begun to show through in selling, general and administrative expense leverage. Capital spending is guided to 4.5–5.5% of net sales in fiscal 2027, with the increase directed at capacity expansion and supply-chain optimisation rather than maintenance alone.
Financial Performance
Key Financial Highlights
Fiscal 2026 was the fifth consecutive year of net sales growth, but the slowest of the five on an organic basis. Between fiscal 2022 and fiscal 2026 net sales rose from US$80.2bn to US$87.0bn, a compound annual rate of 2.06%, and diluted EPS from US$5.81 to US$6.62. Operating income did not follow: it peaked at US$20,451m in fiscal 2025 and fell 3% to US$19,748m in fiscal 2026.
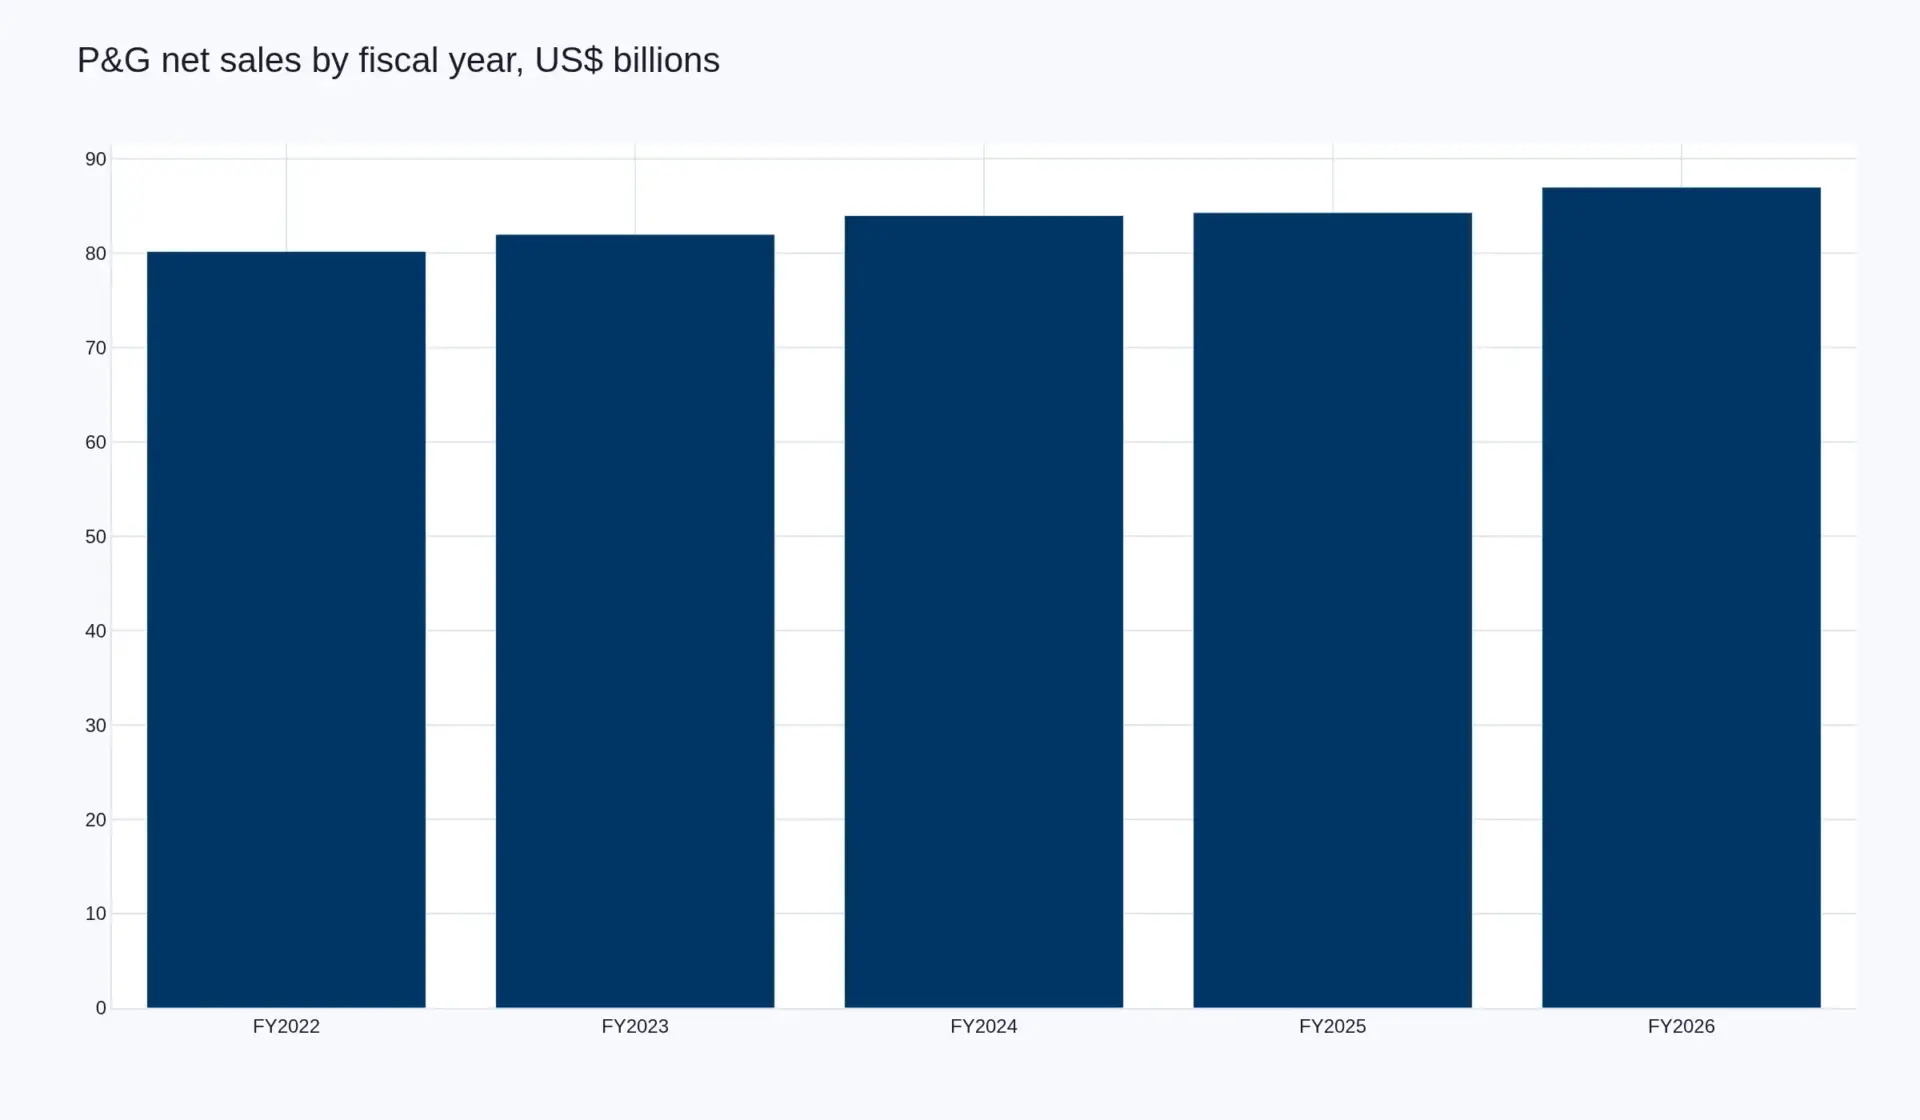
| Measure | FY2022 | FY2023 | FY2024 | FY2025 | FY2026 |
|---|---|---|---|---|---|
| Net sales | 80.2 | 82.0 | 84.0 | 84.3 | 87.0 |
| Operating income | 17.8 | 18.1 | 18.5 | 20.5 | 19.7 |
| Net earnings attributable to P&G | 14.7 | 14.7 | 14.9 | 16.0 | 16.0 |
| Net earnings margin | 18.4% | 18.0% | 17.8% | 19.1% | 18.5% |
| Diluted EPS (US$) | 5.81 | 5.90 | 6.02 | 6.51 | 6.62 |
| Core EPS (US$) | 5.81 | 5.90 | 6.59 | 6.83 | 6.89 |
| Operating cash flow | 16.7 | 16.8 | 19.8 | 17.8 | 19.6 |
| Dividends per share (US$) | 3.52 | 3.68 | 3.83 | 4.08 | 4.26 |
Revenue Breakdown
Two thirds of the company sits in three segments. Fabric & Home Care and Baby, Feminine & Family Care together produced US$50,715m of FY2026 net sales, and with Beauty they accounted for 78% of the group. The balance sheet behind that revenue at 30 June 2026 carried total assets of US$126,521m, shareholders’ equity of US$54,311m, long-term debt of US$22,842m and debt due within one year of US$11,296m. Goodwill of US$41,276m and trademarks and other intangibles of US$21,444m together represent half of total assets — the accumulated consequence of a portfolio built by acquisition.
The revenue mix is also the company’s exposure map. Baby care faces birth rates, family care faces private label and merchandising investment, and feminine care faces a category where unit volumes are flat to down in mature markets and where the growth that does appear comes from price and premium mix. Fabric & Home Care, by contrast, is where volume has been recovering; it grew volume 4.3% in Q1 FY2027.
Profitability Analysis
Gross margin was 50.2% in FY2026, down 100 basis points; on a core basis it was 50.7% against 51.1% in FY2025. Selling, general and administrative expense rose 60 basis points to 27.5% of net sales, and operating margin fell 160 basis points to 22.7%. Core operating margin was 23.6%, down 70 basis points. The fourth quarter was weaker than the year: reported gross margin fell 60 basis points and operating margin 220 basis points, with 120 basis points of unfavourable product mix, 70 basis points of product and package reinvestment and 40 basis points of higher commodity cost partly offset by 160 basis points of productivity savings.
The compression has continued into fiscal 2027. In Q1 the core gross margin fell 150 basis points to 50.0% — 140 basis points of commodity cost and 140 basis points of product reinvestment, offset by 250 basis points of productivity savings — and the core operating margin fell 80 basis points to 25.9%. Management now assumes a US$1.4bn after-tax commodity, energy and freight headwind for the full year on a Brent crude assumption of US$100 a barrel, and expects a materially heavier impact in the second quarter and second half. Adding US$300m of higher net interest, US$150m of lower non-operating income and US$50m of currency, the total below-the-line headwind is about US$1.9bn after tax, equal to US$0.79 per share, or 11% of fiscal 2026 core EPS.
SWOT Analysis
|
Strengths
|
Weaknesses
|
|
Opportunities
|
Threats
|
Recent Developments
| Date | Event |
|---|---|
| 22 October 2026 | Reported Q1 FY2027 net sales of US$23.3bn (+4%) and organic sales growth of 4%, with core EPS of US$2.00. Raised all-in FY2027 sales growth guidance to 2–4% to include Thorne, holding organic growth guidance at 1–3%. |
| 1 October 2026 | Completed the acquisition of Thorne, a supplements business, which will operate as a separate entity while using P&G’s supply chain and marketing capabilities. |
| 29 July 2026 | Reported FY2026 net sales of US$87.0bn (+3%), organic sales growth of 1% and core EPS of US$6.89 (+1%), and guided FY2027 to organic growth of 1–3% and core EPS of US$6.89–7.11. |
| April 2026 | Declared the increase that made fiscal 2026 the 70th consecutive year of dividend increases; dividends per share for the year were US$4.26. |
| January 2026 | The Glad joint venture agreement with Clorox expired; Clorox purchased P&G’s minority interest at fair market value for US$476m, producing an after-tax gain of US$261m. |
| June 2025 | Announced a portfolio and productivity plan to streamline the portfolio and organisation, with US$1–1.6bn of before-tax non-core restructuring costs over two years and a 15% reduction in non-manufacturing headcount. |
Business Strategy
Global Strategy
P&G describes an integrated growth strategy built on five choices: a portfolio in categories where product performance matters to the consumer; superiority across product, package, brand communication, retail execution and value; productivity to fund investment; an empowered and accountable organisation; and what it calls constructive disruption of its own business model. In fiscal 2026 the company restated how it executes that strategy around four interventions — putting the consumer first, transforming brand building for a fragmented media landscape, building holistic partnerships with retailers that are becoming media platforms while media platforms become retailers, and a “stronger core and bigger, more” portfolio.
| Pillar | What it means in FY2027 |
|---|---|
| Superiority | Innovation-led pricing rather than broad price increases: price contributed 0.4 points of the 4% organic growth in Q1 FY2027, against 2.4 points from volume and just over a point from mix. |
| Productivity | 250 basis points of savings in Q1 FY2027 against 140 basis points of commodity cost and 140 basis points of product reinvestment; a 15% cut in non-manufacturing headcount; capital spending guided to 4.5–5.5% of sales. |
| Portfolio | Restructuring charges of US$1–1.6bn before tax over two years, more than half taken in FY2026; the Glad minority interest exited for US$476m; Thorne acquired and closed on 1 October 2026. |
| Cash return | Over US$15bn returned in FY2026 (US$10,232m dividends, US$5,028m buybacks) and about US$15bn planned for FY2027, funded through a US$1.9bn after-tax headwind. |
Focus-Market Strategy
The geographic strategy is weighted to two developed regions and executed separately in three enterprise blocks. North America and Europe are 74% of net sales; in fiscal 2026 focus-market organic sales grew 1%, with each up modestly, while enterprise markets grew 4% led by Latin America at 6%. In Q1 FY2027 the ordering reversed — focus markets grew 4%, enterprise markets 5% — and Greater China grew 8% off a difficult consumer environment, with Pampers volumes up close to 50% on what management described as near-term competitive dynamics rather than a market recovery.
Within the portfolio, Baby, Feminine & Family Care is the segment where the focus-market strategy is most constrained, because two of its three categories — baby care and family care — are tied to household formation and birth rates in exactly the mature markets where P&G has most of its sales. The company’s answer has been to move up the price ladder rather than chase units: Pampers Amoira in the United States, Pampers Prestige in Greater China, and in feminine care a mix of innovation-based pricing and premium product forms in North America while accepting volume decline in Europe. Fiscal 2026 and the first quarter of fiscal 2027 both show the same result — feminine care growing in value on flat to lower units.
Sources
- The Procter & Gamble Company, “P&G Announces Fourth Quarter and Fiscal Year 2026 Results”, 29 July 2026 — pginvestor.com
- The Procter & Gamble Company, 2026 Annual Report — us.pg.com/annualreport2026 and financial statements (PDF)
- The Procter & Gamble Company, fiscal 2027 first quarter results and earnings call, 22 October 2026 — call transcript and CNBC report, 22 October 2026
- Pheonix Research, Global Feminine Hygiene Products Market — market sizing and the 16.4% modelled share
- Wikidata, Q212405
Provenance: this page is bound to Wikidata Q212405 and to the Pheonix entity MIEN-node_5c51ec42. Financial figures are taken from P&G’s own reporting for the periods shown, in US dollars as reported, and are not restated. Feminine care revenue is not separately disclosed by the company; category growth rates are quoted as P&G states them. Last verified 18 November 2026.
Market Presence
Procter & Gamble is mentioned across 3 market reports.
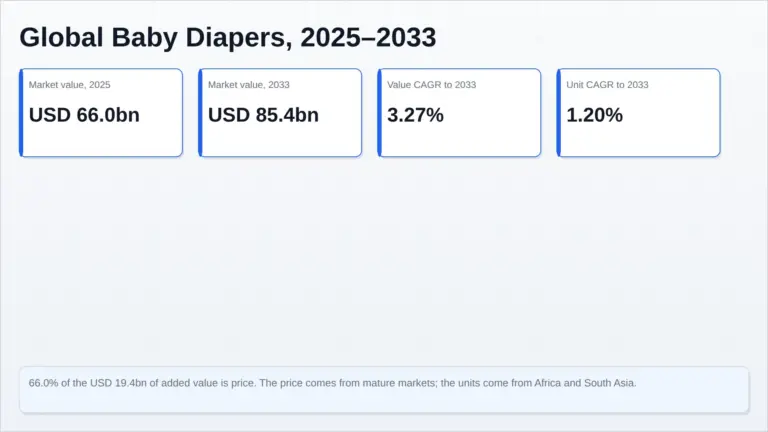
Global Baby Diapers Market Report, Size, Share and Forecast 2026–2033: The Price Comes From One Market and the Volume From Another

Global Household Cleaning Tools and Supplies Market Report, Size, Share and Forecast 2026–2033