
Global Baby Diapers Market Report, Size, Share and Forecast 2026–2033: The Price Comes From One Market and the Volume From Another
Executive summary
| Market value, 2025 | USD 66,000 million |
|---|---|
| Market value, 2033 | USD 85,400 million |
| Value CAGR, 2026–2033 | 3.27% |
| Volume, 2025 → 2033 | 300,000 → 330,000 million units (1.20% CAGR) |
| Realised price | 22.00 → 25.88 US cents per unit (2.05% CAGR) |
| Price share of value growth | 66.0% of USD 19,400 million |
| Fibre per unit | 12.58 → 12.55 grammes (flat) |
| Polymer per unit | 9.45 → 10.79 grammes |
| Polymer-to-fibre ratio | 0.75 → 0.86 |
| Modelled share of the largest eight owners | 54.8% |
| Live births, 2025 | 132.4 million worldwide; Sub-Saharan Africa 35.6% |
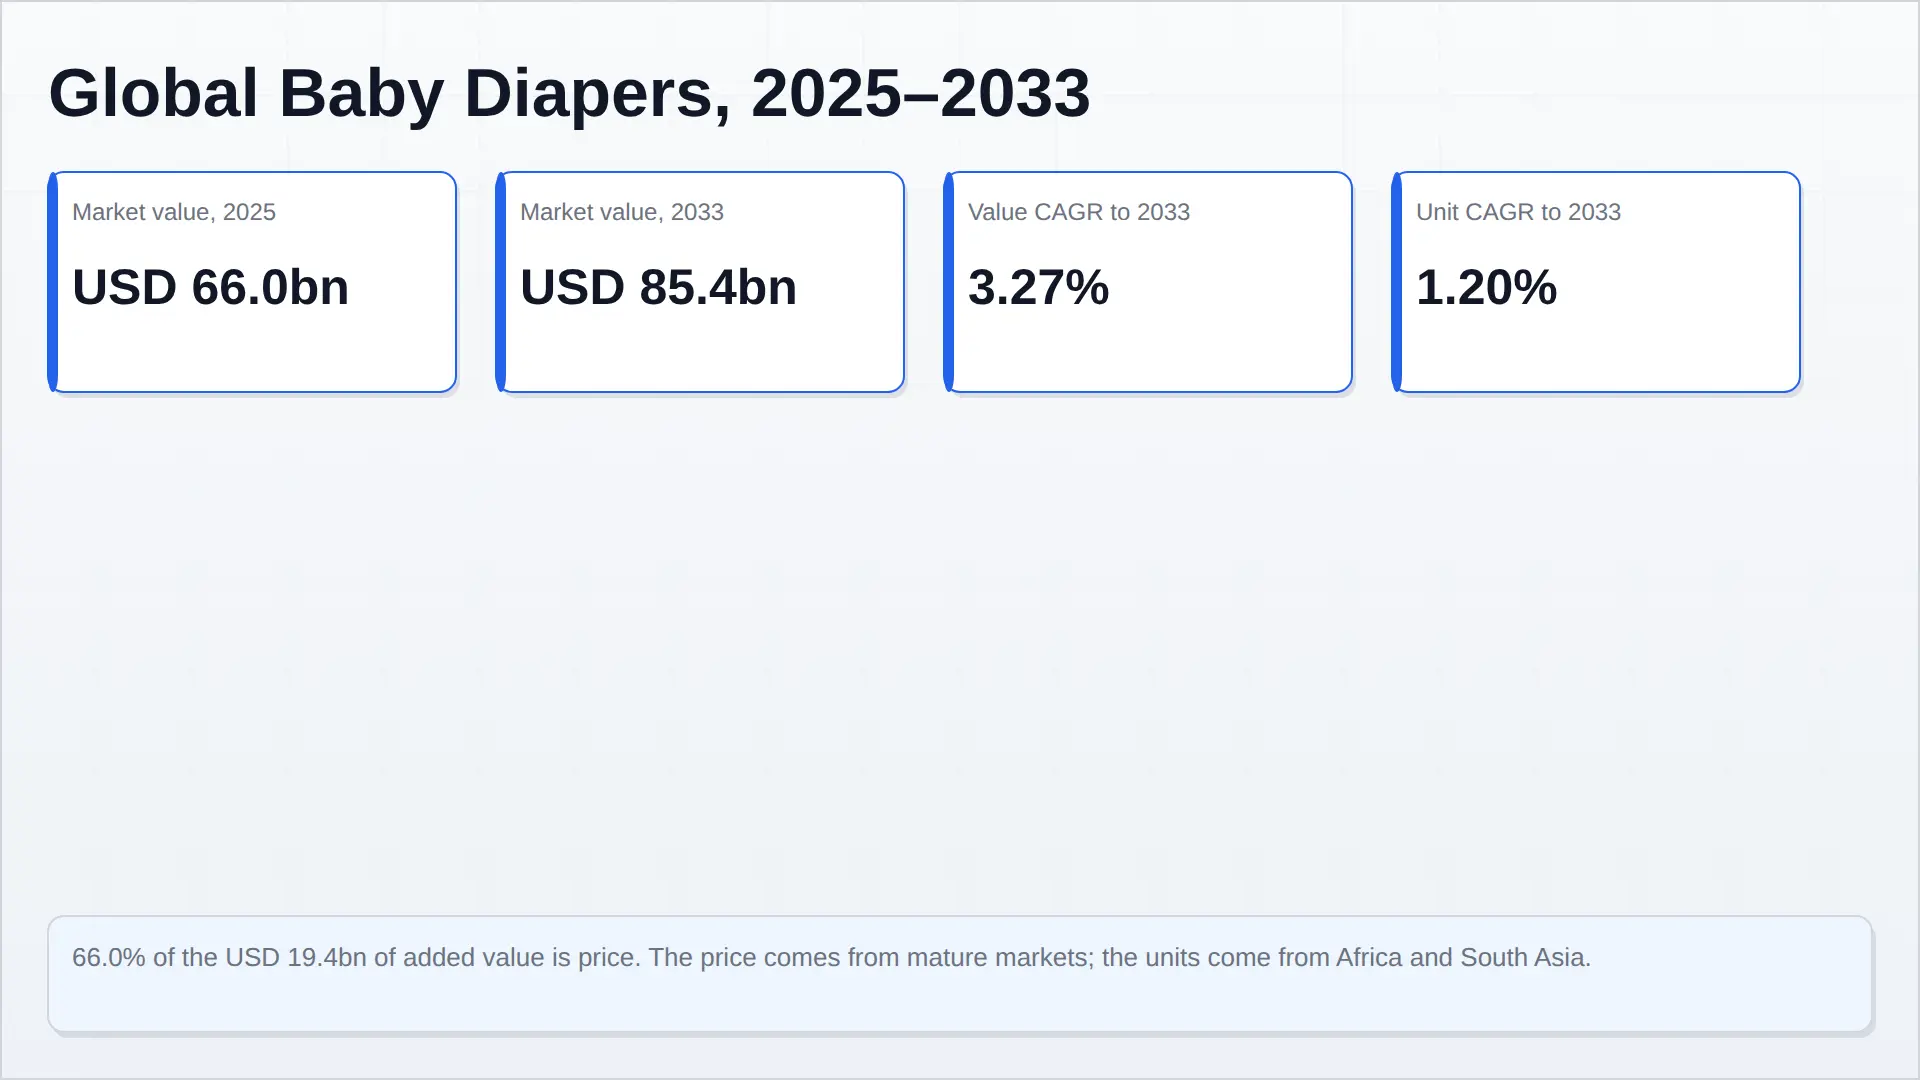
The global baby diaper market is USD 66,000 million in 2025 and reaches USD 85,400 million in 2033 — 3.27 per cent a year. Units move from 300,000 million to 330,000 million, 1.20 per cent a year. Realised price rises from 22.00 US cents a diaper to 25.88, 2.05 per cent a year, and 66.0 per cent of the added USD 19,400 million is price rather than volume.
Those two growth rates are not produced in the same place, and that is the argument of this report. Almost all of the added units come from markets where a diaper is cheapest. Almost all of the added price comes from markets where the birth rate is falling. The world recorded 132.4 million live births in 2025; Sub-Saharan Africa alone accounts for 35.6 per cent of them, India 17.4, China 6.6 and Nigeria 5.8. The first two are markets where a large share of babies still use no disposable diaper at all, or use two or three a day where a German household uses five. The last two are markets where almost every baby is already in one, and where the only remaining volume is more babies — which is not what is happening.
So the market has two engines running at different speeds on different fuels. Unit growth is a penetration story in South Asia and Sub-Saharan Africa. Price growth is a mix and repricing story in North America, Europe and urban China, where the branded owner is trying to recover cost through premium tiers and pant formats while defending against a private label that already holds a large share of the shelf. Neither engine is strong enough to carry the market alone, and neither is where the other one is.
The tonnage tells you which material wins. A diaper in this model carries 12.58 grammes of fluff pulp and 9.45 grammes of superabsorbent polymer in 2025. By 2033 it carries 12.55 grammes of pulp and 10.79 grammes of polymer: fibre flat, gel up. The polymer-to-fibre ratio rises from 0.75 to 0.86. Every gramme of that shift is demand removed from the fluff pulp chain and added to the superabsorbent polymer chain — and it is why pulp’s baby-diaper end use grows 1.17 per cent while diaper units grow 1.20.
And it is small money. At USD 1,290 a tonne for fluff pulp and USD 1,700 for polymer, the fibre in a diaper costs 1.62 US cents and the gel 1.61 — 3.23 cents of a 22.00-cent realisation, or 14.68 per cent. A diaper is not a materials business. It is a converting, distribution and brand business, which is why the competitive chapter of this report is about shelf position and line economics rather than about input cost.
What the owners report is consistent and uncomfortable. Kimberly-Clark’s North America consumer business declined 2.4 per cent with organic growth positive at 1.8, a 3.9-point drag from exiting lower-margin private-label contracts. Unicharm’s Japan business grew sales and held core operating income at ¥67,350 million while China swung from ¥17,530 million of profit to a ¥5,364 million core operating loss. Ontex lost 4.9 per cent like-for-like, and €95 million of the €98 million came from baby care alone. Hengan held price in sanitary napkins at +1.4 per cent and lost it in diapers. Procter & Gamble does not break diapers out of its Baby, Feminine & Family Care segment at all. Four companies, four different geographies, one structural fact: the branded diaper is being repriced upward in mature markets while being displaced downward in growth markets, at the same time, often by the same company.
The report that follows is built from three layers. The secondary record — filings, standards, certification registers, price assessments and United Nations population data — carries about seventy per cent of it. The remaining thirty is Pheonix’s own 2026 field programme: 41 open-ended interviews, four conferences, a 1,247-respondent caregiver survey across five markets, and a 340-SKU shelf audit. Where a number is a Pheonix modelled estimate it is labelled as one. Where it comes from a filing or a standard, the source is in the list at the end. No market-research competitor data is used as an input to this report or cited anywhere in it.
Market definition, size and forecast
This report covers single-use baby diapers in taped and pant formats, measured at manufacturer level — ex-works, before retail margin, freight to store and tax. It excludes adult incontinence products, which are modelled separately in their own report; feminine hygiene, similarly separated; training pants where the trade reports them as a distinct line; cloth and reusable systems; and wipes. That boundary matters because the absorbent core is shared across all of them and the material volumes in this report are drawn from the same end-use splits used in the two material reports, so the three documents reconcile line by line.
| Indicator | 2025 | 2033 | CAGR |
|---|---|---|---|
| Market value (USD million) | 66,000 | 85,400 | 3.27% |
| Volume (million units) | 300,000 | 330,000 | 1.20% |
| Realised price (US cents per unit) | 22.00 | 25.88 | 2.05% |
| Absorbent core mass (thousand tonnes) | 6,608 | 7,702 | +16.6% over the period |
Read the third row against the second. Price grows 71 per cent faster than volume. In a category that people buy for a baby who exists, in a quantity set by physiology rather than by fashion, that gap cannot come from the consumer deciding to use more diapers. It comes from what is in the pack and what the pack costs.
Volume by region
| Region | 2025 (million units) | 2033 (million units) |
|---|---|---|
| Asia Pacific | 130,500 | 145,800 |
| North America | 51,000 | 52,200 |
| Europe | 48,000 | 49,800 |
| South America | 34,500 | 37,200 |
| Middle East & Africa | 36,000 | 45,000 |
| Total | 300,000 | 330,000 |
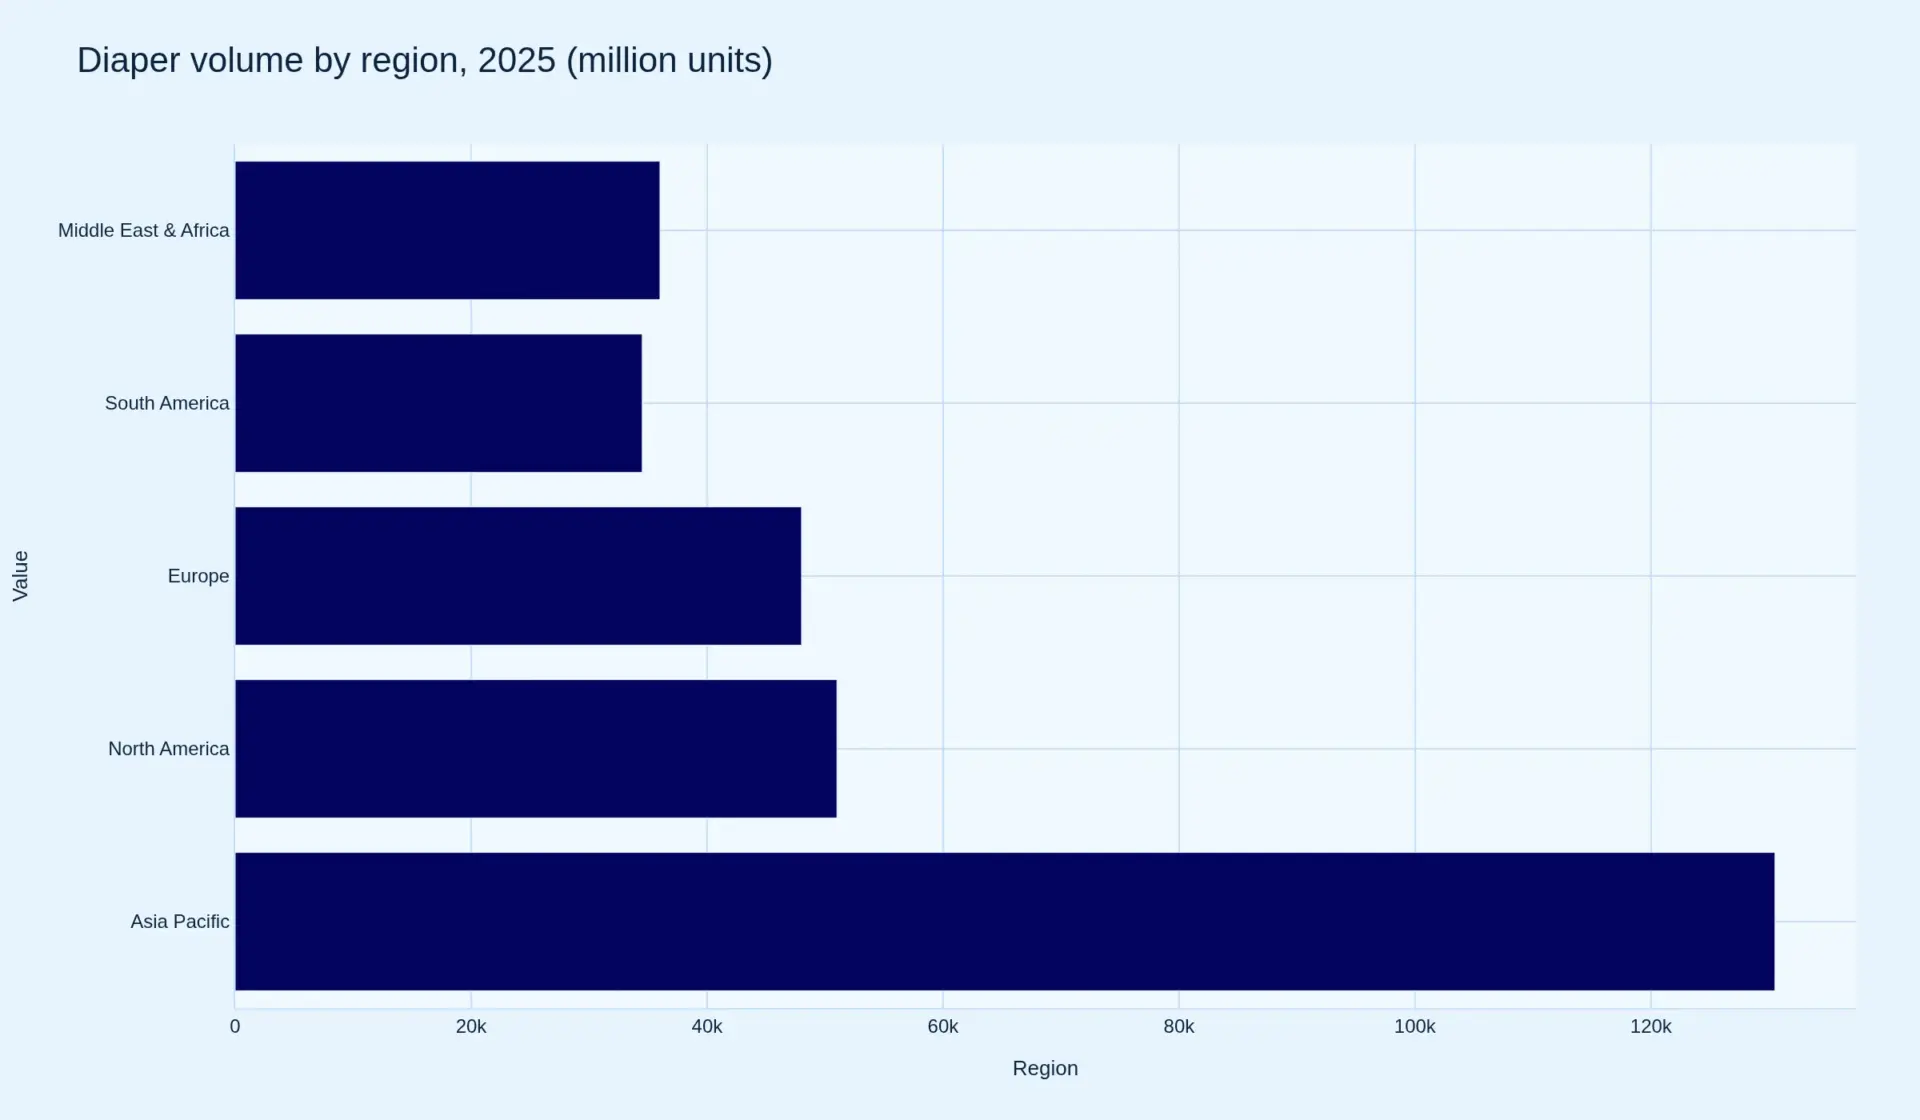
Asia Pacific is 43.5 per cent of world units and adds the most units in absolute terms, but the fastest proportional growth is Middle East and Africa, which moves from 36,000 to 45,000 million units. North America and Europe together still consume a third of world units on roughly a tenth of world births, which is the cleanest single statement of where penetration already sits. In our interviews, two converters who supply both European retail and West African distribution put the gap in plain terms: “The same baby. Four changes a day in Lyon, one and a half in Kano, and the Kano pack is smaller.”
Where the USD 19,400 million of growth comes from
| Component | Contribution (USD million) | Share |
|---|---|---|
| Volume at the 2025 realised price | 6,600 | 34.0% |
| Realised price | 12,800 | 66.0% |
| Total value growth, 2025–2033 | 19,400 | 100.0% |
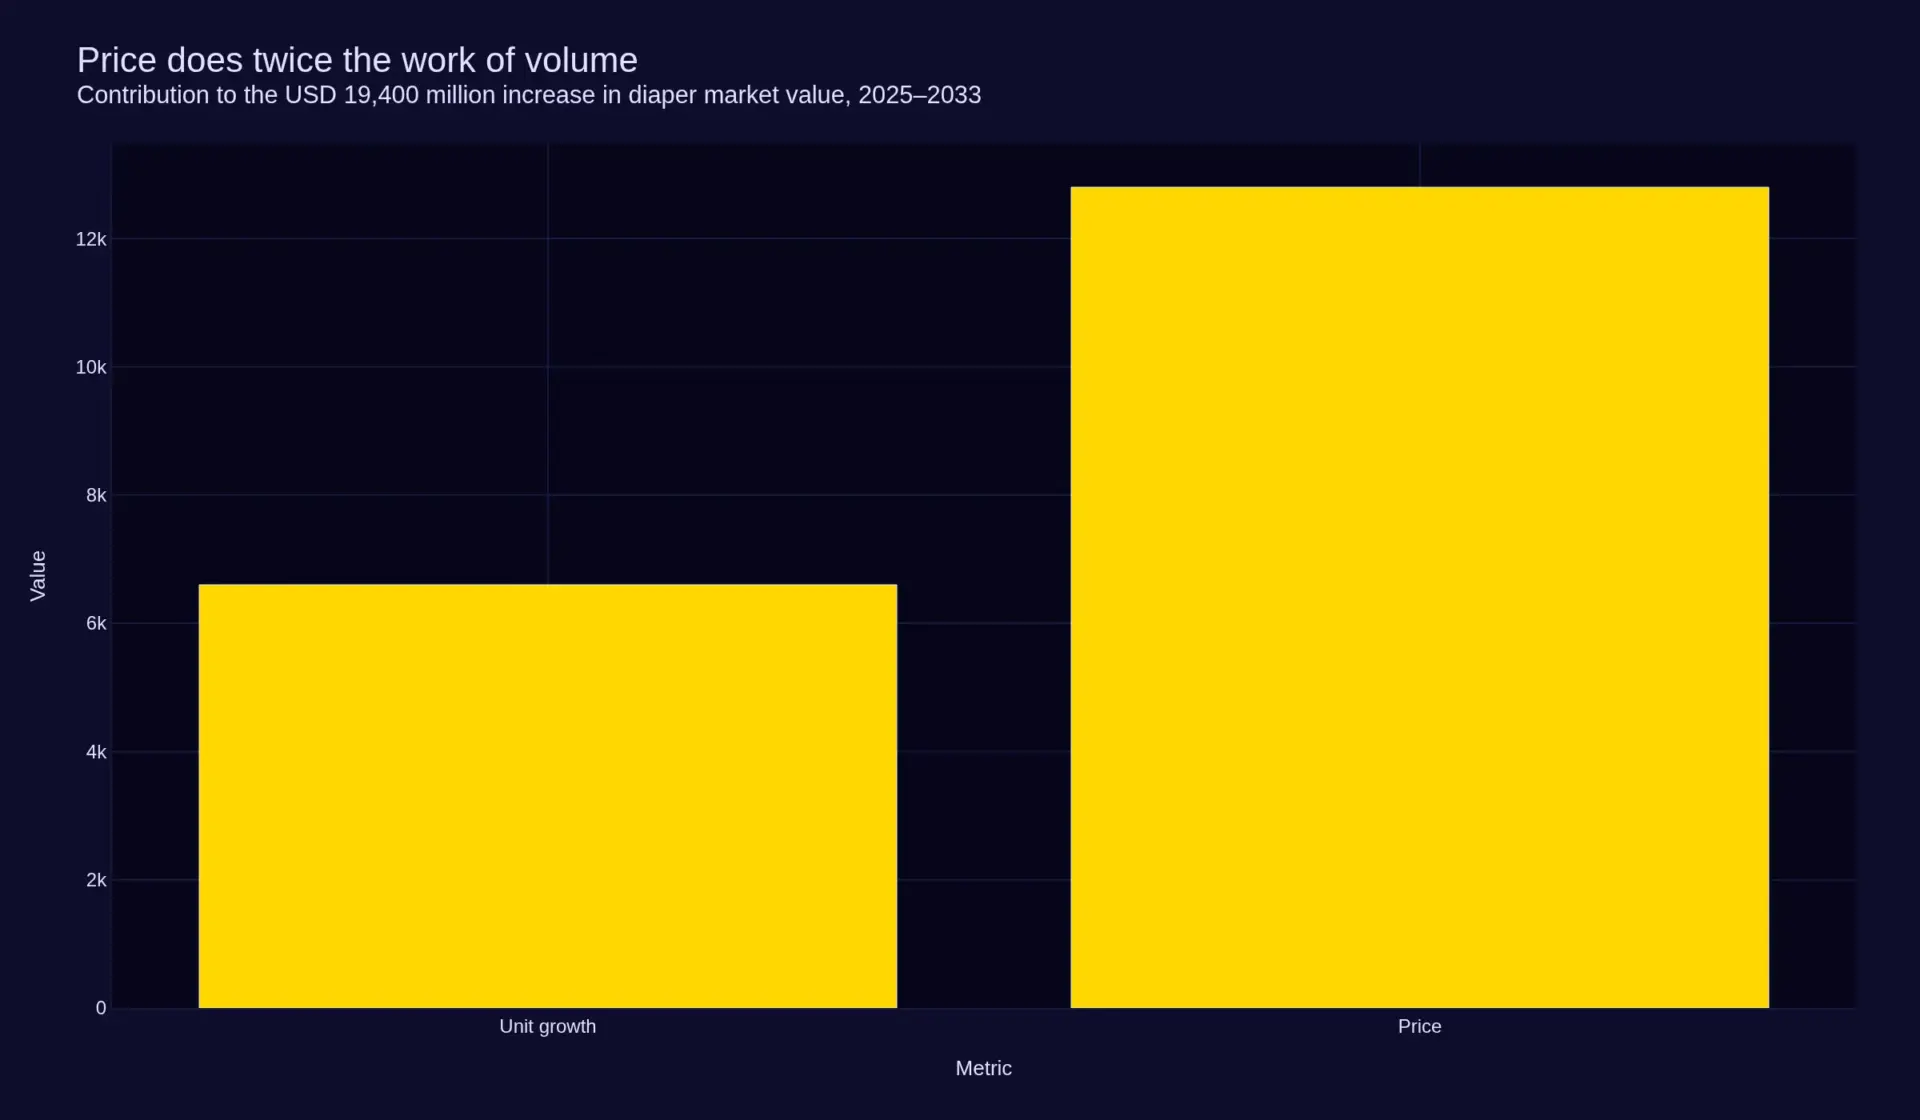
Set the diaper decomposition beside its two neighbours in the cluster and the shelf reads as a single system. Feminine hygiene grows 78.4 per cent on price. Adult incontinence grows 69.9 per cent on volume. Diapers split it 66.0 to 34.0. The absorbent shelf therefore contains one category that can price, one that can only volume, and one that is trying to do both and being undercut in the attempt. Diapers are the contested middle.
What one diaper is made of, and how that changes
| Per unit | 2025 | 2033 | Polymer-to-fibre |
|---|---|---|---|
| Fluff pulp (grammes) | 12.58 | 12.55 | 0.75 → 0.86 |
| Superabsorbent polymer (grammes) | 9.45 | 10.79 | |
| Core mass (grammes) | 22.03 | 23.34 | — |
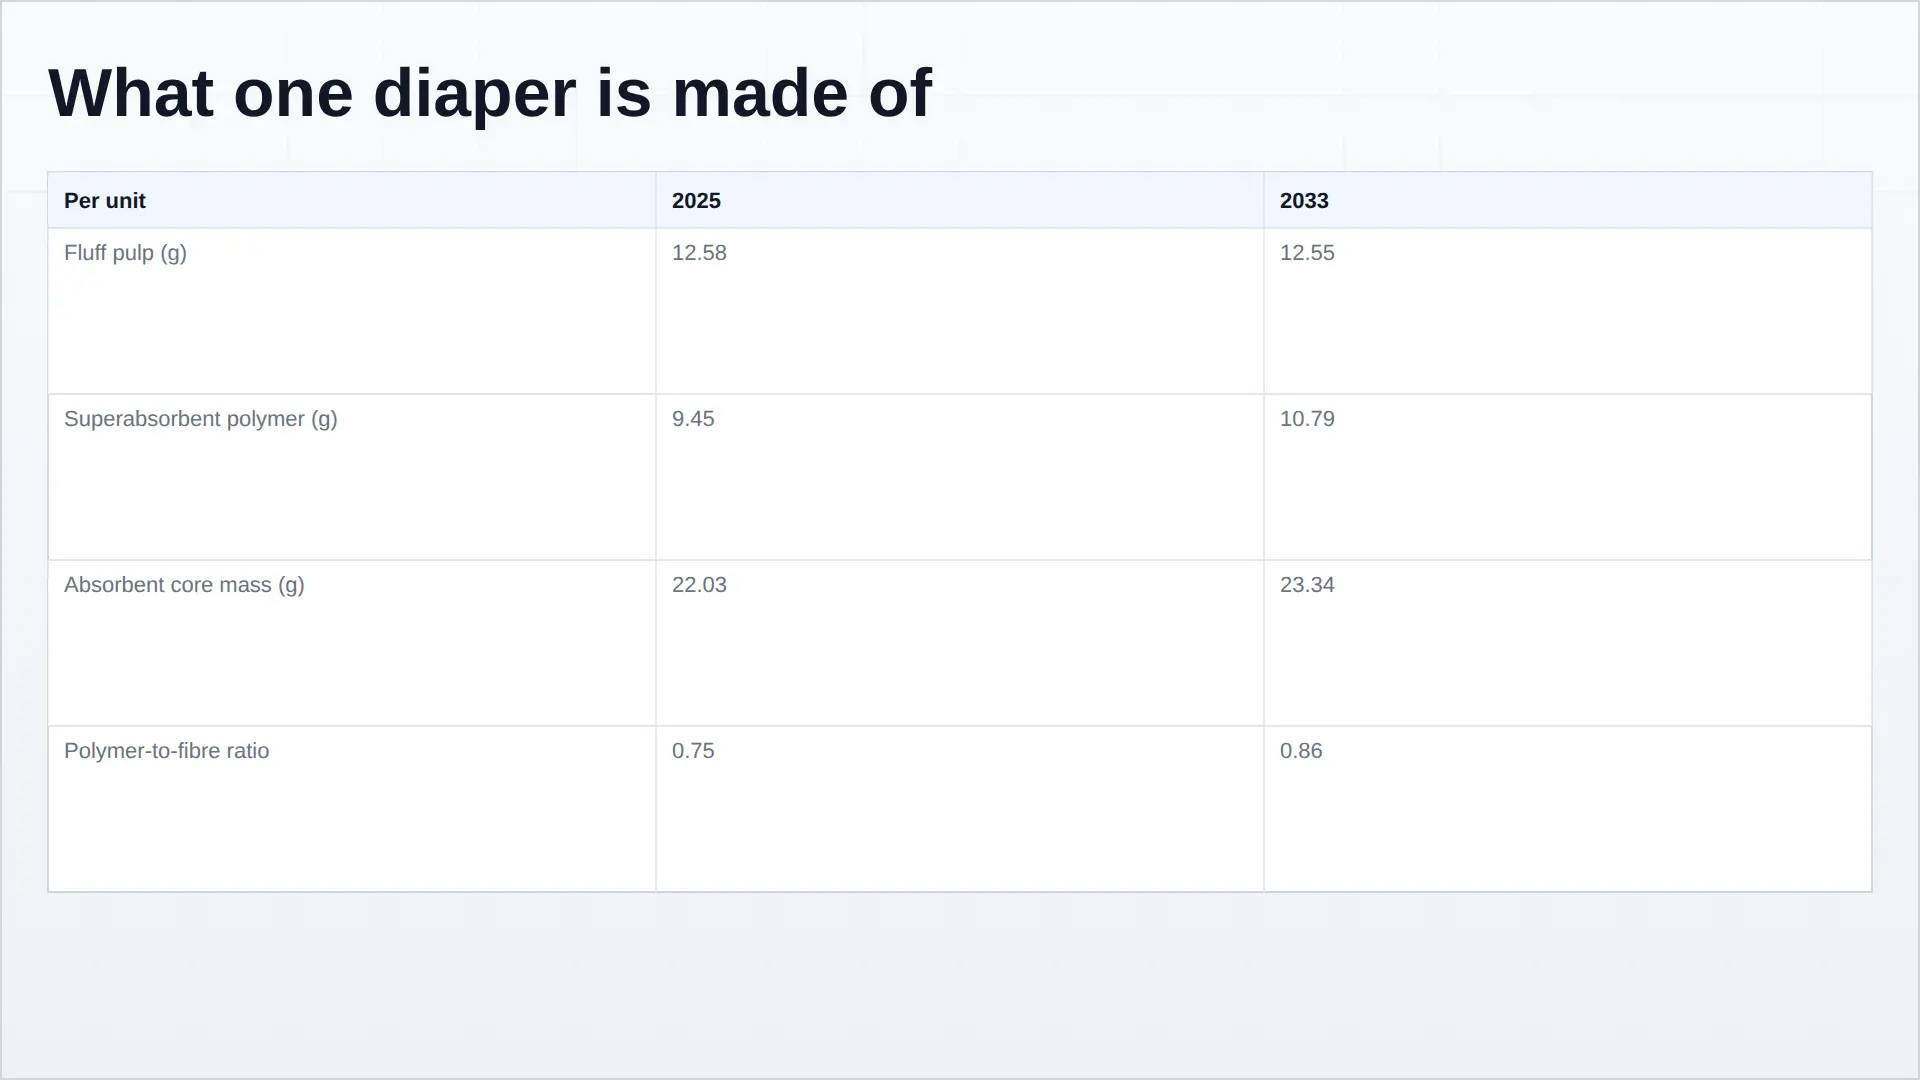
This is the report’s quietest table and its most consequential one. The diaper is not getting dramatically thinner in this model, which is the received story. Fibre per unit is essentially flat and total core mass rises modestly, because the industry has already taken most of the easy fibre out of the ultra-thin designs in mature markets. What is still moving is the composition: polymer loading up while fibre holds, so the core becomes more gel and less wood. For a converter that is a performance gain at almost no material cost — polymer realisation has risen 1.13 per cent a year against pulp at 1.73. For a fluff pulp mill it is the reason its largest end use grows more slowly than the market it serves.
Pheonix field programme, 2026
The primary layer of this report was collected by Pheonix between February and October 2026 and is used to test the secondary record, not to replace it.
- 41 open-ended depth interviews with converting-line managers, brand-owner category directors, private-label buyers, and fluff pulp and superabsorbent polymer sales staff across seven markets.
- Four conferences attended and recorded: EDANA’s Outlook, Hygienix, ANEX, and a Gulf hygiene and nonwovens forum.
- A structured caregiver survey, n = 1,247, in the United States, Germany, Brazil, Nigeria and Indonesia, fielded in Q3 2026, covering usage frequency, size-up behaviour, price sensitivity and private-label switching.
- A shelf audit of 340 SKUs across 12 cities, recording price per pack, price per unit and price per gramme of absorbent core.
Findings are attributed in the text as interviews, survey or audit. They are Pheonix’s own observations and are identified as such wherever they appear.
Three things the fieldwork changed
1. The private-label gap is a pack-count gap, not a price gap. Across the 340 SKUs audited, private label sold 18 to 31 per cent below the leading brand on price per pack. On price per gramme of absorbent core the gap collapsed to 4 to 11 per cent, because the private-label pack carried fewer and smaller diapers. The consumer is being offered a smaller product at a lower total price, which reads as a discount and is not one. Every brand-owner category director we interviewed named this as their single biggest pricing problem.
2. Caregivers size up on leaks, not on weight. In the survey, a night-time leakage event was the trigger for moving to the next size for a clear majority of respondents in all five markets, with growth-chart guidance a distant second. That matters commercially because it makes leakage performance a volume driver, not just a quality one: a diaper that leaks is upgraded early, and the pack is consumed faster.
3. Converters do not describe cost as the binding constraint. They describe changeover. In the interviews, line managers consistently put changeover time and start-up waste ahead of material price when asked what limits their margin, and several described running the same machine for a brand and a private label on the same shift. The cost stack supports them: materials are 14.68 per cent of realisation. What is left is the line, the pack and the brand.
Articles on this market
- The Private Label Is Not Cheaper. It Is Smaller. — the 340-SKU shelf audit behind this report’s pricing argument, and what it implies for the 66.0 per cent of growth that has to come from price.
- Two Grammes of Gel: What Actually Changed Inside the Diaper — the polymer-for-fibre substitution inside the core, and why the material that gained share cannot charge for it.
Sources
- United Nations, Department of Economic and Social Affairs, Population Division, World Population Prospects 2024, twenty-eighth edition — births, live births by country and region, and under-five population — population.un.org
- State Administration for Market Regulation and Standardization Administration of China, GB/T 28004.1-2021, Disposable diapers — Part 1: Disposable diapers for baby, published 13 April 2021, effective 1 May 2022, partially superseding GB/T 28004-2011 — openstd.samr.gov.cn
- EDANA, EDANA’s Position on the EU Harmonised Waste Sorting Labels, 13 August 2025 — position on the PPWR implementing act and the Joint Research Centre user manual — edana.org
- EDANA, Collection and Recycling of Absorbent Hygiene Products — assessment of AHP collection and recycling initiatives and their scalability — edana.org
- European Commission, Directorate-General for Environment, EU Deforestation Regulation (EUDR) — due-diligence obligations on wood fibre placed on the EU market — environment.ec.europa.eu
- Stora Enso Oyj, Skutskär Mill — largest producer of fluff pulp in Europe, 545,000 Adt/a coniferous pulp capacity — storaenso.com
- Domtar Corporation, Plymouth Mill — softwood fluff pulp, 390,000 air-dry tonnes annual pulp production capacity, used in baby diapers and adult incontinence — domtar.com
- Fastmarkets, PPI Europe, Vol. 40 No. 27, 10 July 2025 — NBSK and BEK market pulp price assessments used as the anchor for fluff grade pricing — fastmarkets.com
- Wikidata, diaper (Q187359) — the category identifier this report is bound to — wikidata.org
- Pheonix Research, Global Fluff Pulp Market Report, Size, Share and Forecast 2026–2033 — pheonixresearch.com — used for fibre intensity per unit, the baby-diaper end-use tonnage and the pulp realisation series.
- Pheonix Research, Global Superabsorbent Polymer Market Report, Size, Share and Forecast 2026–2033 — pheonixresearch.com — used for polymer intensity per unit, the realised polymer price and the end-use split.
- Pheonix Research, Global Feminine Hygiene Products Market Report, Size, Share and Forecast 2026–2033 — pheonixresearch.com — used for the price-versus-volume decomposition comparison across the shelf.
- Pheonix Research, Global Adult Incontinence Products Market Report, Size, Share and Forecast 2026–2033 — pheonixresearch.com — used for the same-unit comparison of fibre and polymer cost across categories.
- Pheonix Research, India Baby Care Products Market Report, Size & Forecast 2026–2033 — pheonixresearch.com — used for the country-level penetration comparison.
- Pheonix Research company profiles for Procter & Gamble, Kimberly-Clark, Unicharm, Essity, Ontex and Hengan International — company-reported financials reproduced from the annual and interim filings cited on each page.
No market-research competitor data is used as an input to this report or cited anywhere in it. Population data is taken from the United Nations; product-safety requirements from the Chinese national standard; waste and packaging obligations from the European Commission and EDANA; fibre and polymer intensities from the two Pheonix material reports cited above. Market size, volume, regional split, realised price, cost stack and corporate share are Pheonix modelled estimates, identified as such wherever they appear.
Table des matières
Paysage concurrentiel
Competitive landscape
The diaper market is moderately consolidated at the top and fragmented everywhere below it. Pheonix models the largest eight owners at 54.8 per cent of value in 2025, which sounds concentrated until you notice that no single company holds more than 23 per cent and that the residual 45.2 per cent is private label, regional converters and local brands. There is no price leader. There is a price ceiling, and it is set by the retailers.
| Owner | Modelled share of value, 2025 | Position |
|---|---|---|
| Procter & Gamble | 22.6% | Global brand, taped and pants, strongest in North America and Western Europe |
| Kimberly-Clark | 14.1% | Global brand, strongest in North America; international business now partly divested |
| Unicharm | 8.3% | Asian brand leader; premium in Japan, volume in Indonesia, India and the Middle East, loss-making in China |
| Hengan International | 2.9% | Chinese integrated tissue and hygiene owner; diaper price under pressure |
| Daio Paper | 2.6% | Japanese brand, premium domestic and Asian export |
| Essity | 2.4% | European brand and private-label supplier; buying rather than growing in feminine care |
| Ontex | 1.9% | Converter and retailer-brand supplier to European retail |
| Largest eight | 54.8% | — |
| Private label, regional converters, local brands | 45.2% | The ceiling on branded price in every market audited |
Shares are Pheonix modelled estimates for 2025 at manufacturer level, built from company-reported segment revenue converted at average annual exchange rates and reconciled to the market total in this report. They are not company disclosures, and no company discloses a global diaper share.
Three business models, one shelf
The brand-led global owners hold 45.0 per cent between the first three. Their economics depend on premium mix and on defending shelf space, not on cost: Procter & Gamble does not break diapers out of its Baby, Feminine & Family Care segment, which is a useful signal in itself — the category is managed as part of a portfolio, not as a standalone profit centre.
The category-adjacent integrated owners come at diapers from an adjacent position and carry their own fibre or tissue base. Hengan is the clearest case: tissue is 61.4 per cent of revenue and 26.8 per cent of segment profit, hygiene 28.5 per cent of revenue and 59.9 per cent of profit. Diapers sit inside that hygiene block as the part where price is hardest to hold.
The converters sell capacity rather than a brand. Ontex is the archetype and the most instructive: it lost 4.9 per cent like-for-like, and €95 million of the €98 million came from baby care alone, with an adjusted EBITDA margin of 9.97 per cent subsequently guided down twice in 2026 to €143–148 million. A converter’s exposure is a retailer’s decision, and a retailer’s decision is a planogram.
The ceiling, measured
The shelf audit of 340 SKUs across 12 cities found private label 18 to 31 per cent below the leading brand on price per pack, but only 4 to 11 per cent below on price per gramme of absorbent core. That gap — the difference between the two numbers — is the room a brand has to raise price, and it is smaller than the headline discount suggests. It is also the reason every brand-owner category director we interviewed described private label as their first pricing constraint, ahead of raw material cost and ahead of each other.
In the interviews, buyers described how a listing is actually won: not on price per unit but on rate of sale per linear metre and on the pack architecture that supports it. Several described running a brand and a retailer brand off the same converting line, in the same shift, to the same core specification. When that is true, the brand is not selling a better diaper. It is selling a better-known one.
Chaîne de valeur
Value chain and cost structure
Softwood becomes fluff pulp, propylene becomes superabsorbent polymer, and the two meet inside a converting line where they are joined by nonwoven, film, tape and elastic. The chain is short, the material content is small, and almost all of the margin sits in the two stages furthest from the tree.
| Stage | What happens | Economics |
|---|---|---|
| Fibre | Long-fibre softwood harvested for the kraft mill | Stumpage and freight; competes with lumber and board for the same log |
| Fluff pulp | Kraft process, sheet formation to grade, bale or reel | Realised USD 1,290 a tonne, rising 1.73% a year |
| Propylene to acrylic acid | Refinery by-product oxidised to monomer | Oil-linked; integration decides who survives a monomer spike |
| Superabsorbent polymer | Polymerisation, drying, surface cross-linking, classification | Realised USD 1,700 a tonne, rising 1.13% a year into structural surplus |
| Core and converting | Defibration, core forming, ADL, carrier sheet, lamination, cut, fold, pack | Line-hour economics; changeover and start-up waste dominate |
| Brand and retail | Listing, planogram, promotion, distribution | Where the 22.00-cent realisation is earned and where most of it is spent |
The 100-index on a 22.00-cent diaper
| Component | Index (realisation = 100) | Basis |
|---|---|---|
| Fluff pulp | 7.4 | 12.58 g at USD 1,290/t = 1.62 US cents |
| Superabsorbent polymer | 7.3 | 9.45 g at USD 1,700/t = 1.61 US cents |
| Nonwoven, backsheet film, ADL, tape, elastics | 22.0 | Pheonix modelled estimate |
| Packaging | 7.0 | Pheonix modelled estimate |
| Energy | 4.0 | Line drying, compression, building services |
| Direct labour | 6.0 | Pheonix modelled estimate |
| Depreciation | 7.0 | Line capital recovered over output |
| Freight and logistics | 6.0 | Finished product is mostly air; cube, not weight, is the constraint |
| SG&A and marketing | 18.0 | Brand owner only; a converter carries far less here and far less margin |
| Owner margin | 15.3 | Blended across brand and converter |
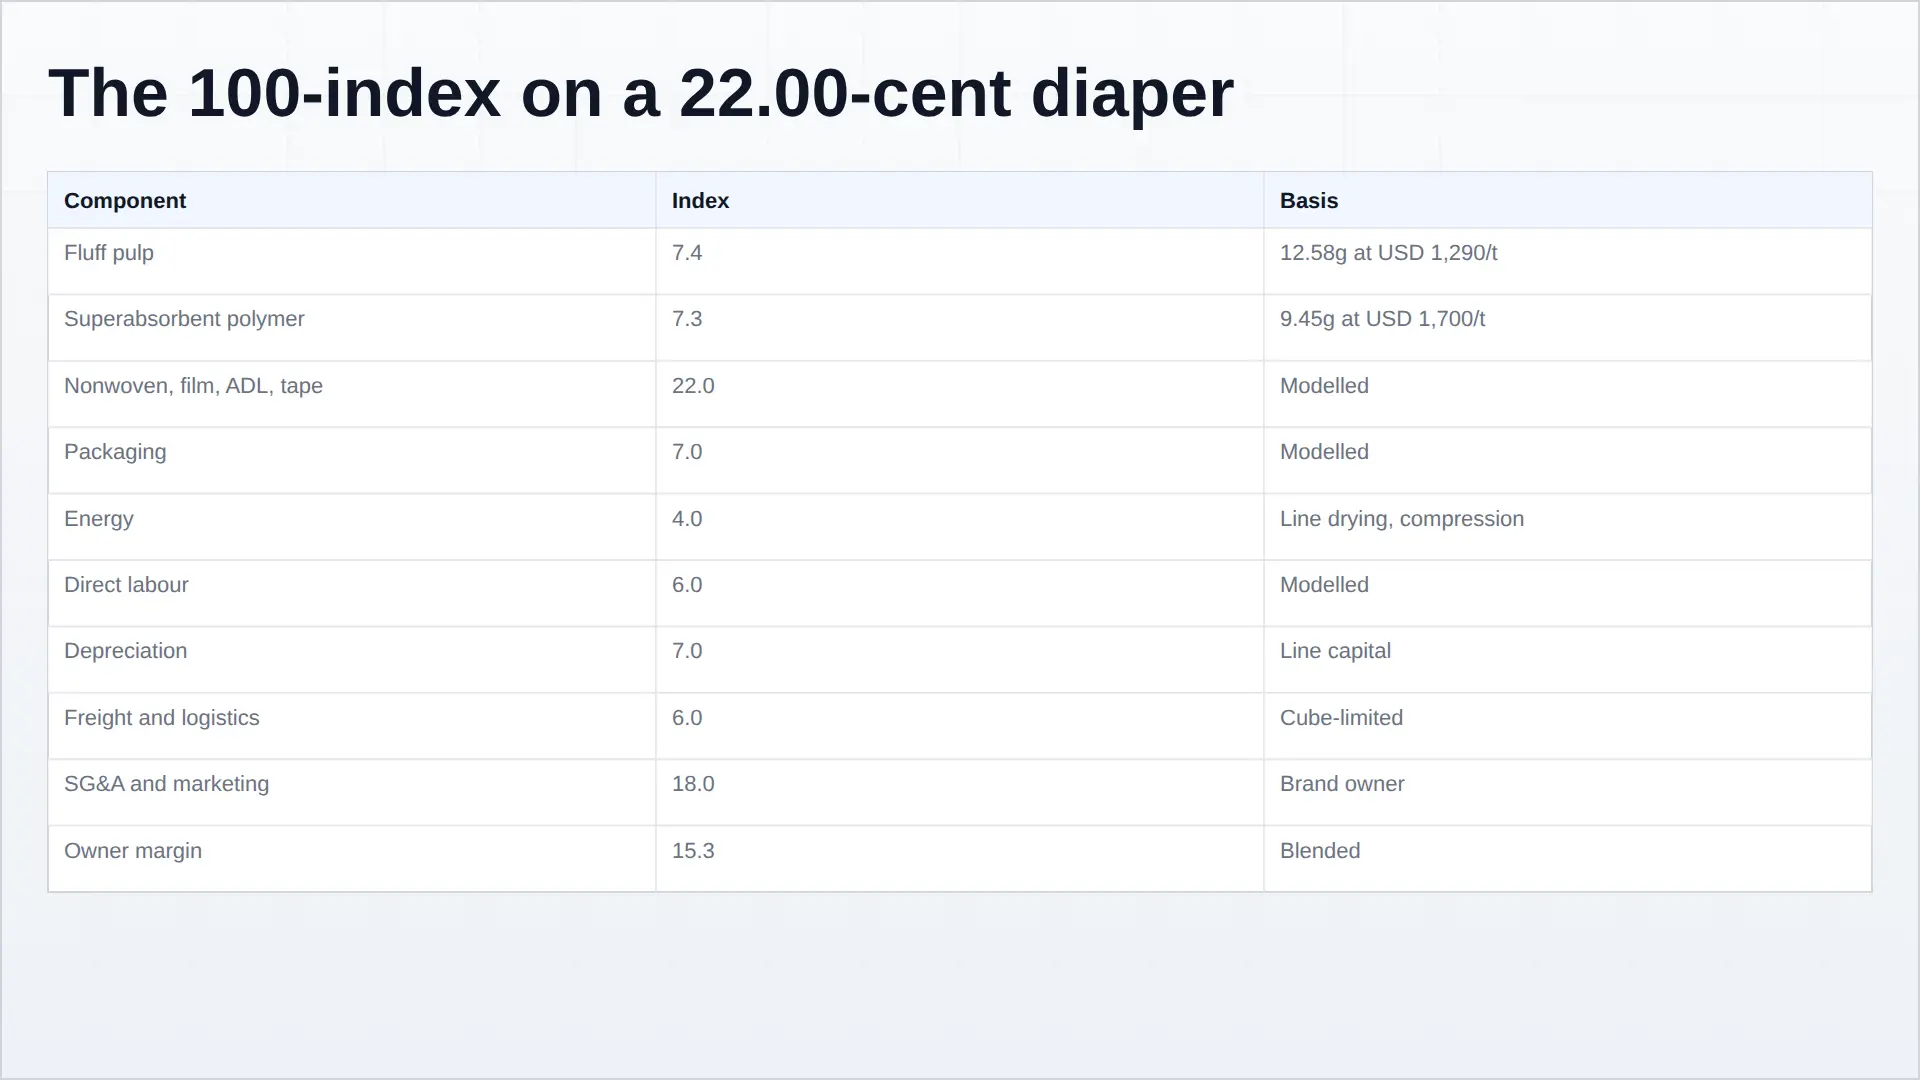
Fibre and gel together are 14.7 index points, or 14.68 per cent of realisation. Nonwoven, film and tape cost more than both absorbent materials combined, and marketing costs more than the entire absorbent core. This is the single most important fact in the report for anyone upstream of the converter: a diaper is not a commodity whose price is anchored to its materials. It is a manufactured consumer product whose materials are a rounding item, which is why input inflation has been passable and why input deflation has not been passed back.
The direction of the material share is also settled. Realisation rises 2.05 per cent a year, pulp 1.73 and polymer 1.13, while mass per unit is broadly flat. Both inputs therefore grow more slowly than the price of the thing they are in, so the material share of a diaper has been drifting down, not up, for the whole forecast window. The converter’s margin problem, to the extent it has one, is not being caused by fibre or gel.
Where the money actually leaks: changeover
In the 41 interviews, line managers were consistent about what limits their margin, and it was not material price. They described changeover time between sizes and between customers, start-up waste while a line re-establishes specification, and the scheduling problem of running brand and private-label volumes on the same asset without losing hours. One converting manager put the trade-off directly: “Give me polymer ten per cent cheaper and I gain a fraction of a cent. Give me twenty minutes off a changeover four times a day and I gain the year.”
That is what a 14.68 per cent material share does to an industry’s attention. It moves the competitive question from procurement to throughput, and it explains why the companies that have struggled most in this cluster — the pure converters — are the ones whose asset base is exposed to a retailer’s listing decision rather than to a pulp index.
Who carries the risk at each link
The pulp mill carries price risk and almost no volume risk, because hygiene demand is inelastic and its customers cannot easily reformulate away from fibre entirely. The polymer producer carries the opposite: volume risk in a market with Chinese surplus capacity, and a price it cannot defend. The converter carries listing risk. The brand owner carries demand risk and, increasingly, regulatory risk. The retailer carries none of it, which is why the retailer sets the ceiling.
Activité d'investissement
Investment activity
Capital in this market is moving in two directions at once, and the split is the clearest evidence for the report’s central argument. Brand owners are buying and selling portfolios. Converters and regional players are building lines. Almost nobody is building a new branded diaper business from scratch, because the shelf does not have room for one.
| Date | Transaction | What it says |
|---|---|---|
| 2025 | Kimberly-Clark sells a 51 per cent stake in its international family care and professional business to Suzano for approximately USD 1.7 billion | Exits the geographies where its brand carries least pricing power, keeps a minority interest in the volume |
| Announced 2025 | Kimberly-Clark agrees to acquire Kenvue at USD 48.7 billion enterprise value | Moves the company’s centre of gravity away from diapers toward consumer health — a portfolio answer to a category problem |
| February 2026 | Essity acquires Edgewell’s feminine care business at 1.30 times revenue | Buys North American distribution rather than building it; the acquired unit was 11.76 per cent of Edgewell’s sales and earned USD 15.6 million |
| Q3 2026, closing Q2 2027 | Essity agrees to acquire Kenvue’s feminine care business in Brazil | The same strategy run twice in twelve months: buy share where organic growth is 0.1 per cent |
| 2026 | Ontex guides adjusted EBITDA down twice, to €143–148 million | The converter model absorbs retailer pressure first |
The pattern in the deal flow
Three of the five transactions above move ownership of a distribution position, not of a factory. Essity paying 1.30 times revenue for a business earning USD 15.6 million on 11.76 per cent of a seller’s sales is not a bet on diaper demand growth; it is a bet that owning the shelf in a mature market is worth more than the growth it cannot find organically. Kimberly-Clark’s two moves say the same thing differently: sell the geographies where the brand is a price-taker, and buy a business in a different category entirely.
This matters for the forecast. If the value growth in this market is 66.0 per cent price, then the way to capture it is to own the price-setting position — the brand on the shelf — and the way to do that is to buy it. That is precisely what the transactions do, and it is why deal multiples in absorbent hygiene have held up in a category growing 1.20 per cent in units.
Where the lines are going
The capex that is being committed to physical capacity is going somewhere else: into converting lines in growth markets, close to demand, and into polymer capacity in China. The superabsorbent polymer report records a Chinese capacity build of 1,260,000 tonnes against a domestic market that could not absorb it, which is why polymer realisation rises only 1.13 per cent a year. The fluff pulp report records the opposite concentration at the mill end: Stora Enso’s Skutskär at 545,000 air-dried tonnes and Domtar’s Plymouth at 390,000, two assets that are 13.6 per cent of a 6,860,000-tonne world market.
So the capital asymmetry is complete. The material that goes into the diaper is being built in surplus; the diaper’s shelf position is being bought at a premium; and the converting asset in between is being depreciated toward the next changeover.
What the interviews added
Converters described a funding gap rather than a demand gap. Several said the constraint on adding capacity in West Africa and South Asia is not whether the diapers would sell but whether a retailer or a brand owner will underwrite a line’s utilisation before it is built. Where that underwriting exists, lines go up quickly; where it does not, capacity follows the brand rather than the birth rate. That is a mechanical reason why unit growth in the fastest-growing regions has been slower than the birth numbers imply, and it is the assumption in this model most likely to be wrong in either direction.
Technologie et innovation
Technology and innovation
The technology in a diaper has been mature for two decades and is still the only lever that moves both cost and performance at once. That combination — a mature process with an unmatured formulation space — is why innovation intensity in this category is high while patent activity is only moderate: the work is in core design and line throughput, not in new chemistry.
What is actually changing in the core
The composition shift quantified earlier in this report is the innovation: polymer from 9.45 to 10.79 grammes per unit while fibre holds at 12.58 to 12.55, taking the polymer-to-fibre ratio from 0.75 to 0.86. Three design changes produce it.
- Higher polymer loading in the core. More gel per unit of absorbency, which allows a thinner product for the same protection and reduces the fibre bill.
- Debonded and treated pulp. Fibre that opens more readily and wicks faster, so less of it does more work. This is the mechanism by which fluff pulp demand can stay flat while diaper units grow.
- Acquisition and distribution layers. A separate nonwoven layer that takes the liquid in quickly and passes it down, which improves leakage performance without adding absorbent mass — and which is why nonwoven and film are a larger line item than the entire absorbent core.
The commercial result is that the industry can improve the product without paying more for materials, because polymer realisation has risen 1.13 per cent a year against pulp at 1.73. Innovation in this category is, in cost terms, a switch from the input that is getting more expensive to the one that is not.
Format is the bigger shift
The pant is taking share from the taped diaper in every mature market, and it changes the bill of materials more than any core redesign. A pant carries more elastic and more nonwoven, is harder to make, requires a different converting line, and commands a higher price per unit. In our interviews, brand-owner category directors described pant conversion as the single largest capital decision in front of them — not because the pant is cheaper to make, but because it is the easiest way to raise realised price on a consumer who is already buying the category.
That is a price story dressed as a product story, and it is consistent with the decomposition: 2.05 per cent a year of realisation on a market adding 1.20 per cent of units. Where taped diapers are commoditising, pants are the escape route.
Fit, sizing and the leak trigger
The survey of 1,247 caregivers produced the finding with the most direct commercial consequence: size-up is triggered by a leakage event, not by weight. A night-time leak, not a growth chart, moves a household to the next size. That makes leakage performance a volume driver twice over — a leaking diaper is upgraded early, and households that experience leaks use more units per day because they change more often.
Sizing architecture is therefore a margin instrument. More sizes means better fit, less leakage, fewer premature upgrades and higher price per unit — and it also means more changeovers, which is exactly the cost the converters told us binds them. The industry is optimising two things that pull in opposite directions, and the winner is whoever reduces changeover time fastest.
Traceability is the new engineering requirement
Two regulatory threads have become technical specifications. The EU Deforestation Regulation requires due diligence on the wood fibre in a diaper, which turns a bale of fluff pulp into a document chain reaching back to a forest plot. The Packaging and Packaging Waste Regulation adds digital product information obligations that the industry expects to be delivered by data carrier rather than print. Both are being designed into the line, not bolted on afterwards, and both favour operators with integrated mill-to-converter documentation.
Where the innovation budget is going
In the interviews, R&D priorities ranked consistently: leakage at night, thinness and comfort, material cost, then sustainability. Sustainability came last in every market except Germany, where it ranked second. That ranking is the honest answer to why the bio-based and recyclable diaper has not scaled: the consumer says it matters and buys on the third night of a leak-free week instead.
Risque de marché
Market risk and scenarios
The base case is 3.27 per cent a year to USD 85,400 million in 2033 on 1.20 per cent unit growth. The scenarios below widen and narrow the two components of that model rather than applying a blanket discount, because the risks in this market do not hit price and volume equally.
| Scenario | Value CAGR | 2033 value | What has to be true |
|---|---|---|---|
| Conservative | 2.20% | USD 78,551 million | Private label passes 50 per cent of value in two major markets; branded pricing stalls at roughly the rate of input inflation; African and South Asian penetration grows but at lower price points than assumed |
| Base | 3.27% | USD 85,400 million | Price does two-thirds of the work and penetration does the rest; pant conversion continues in mature markets; no material regulatory cost lands on the product itself |
| Optimistic | 4.30% | USD 92,431 million | Penetration in Sub-Saharan Africa and South Asia accelerates as local converting capacity is underwritten; branded premium mix holds; polymer and pulp both stay cheap |
Scenarios are Pheonix constructs built around the modelled base case, not third-party forecasts.
The risks that matter, ranked
1. Births fall faster than the United Nations projection. The model already assumes flat-to-falling births in mature markets and growth only through penetration. If the 132.4 million annual birth figure declines more quickly than projected, unit growth of 1.20 per cent is unreachable and the whole value bridge moves onto price, which is already carrying 66.0 per cent and cannot carry much more.
2. Private label extends past the ceiling. It holds 45.2 per cent of value today. Because the real gap between private label and brand is 4 to 11 per cent on price per gramme of core rather than the 18 to 31 per cent it appears to be on the pack, there is less brand premium available than the shelf suggests. A retailer that moves from pack comparison to unit-cost comparison would compress branded realisation quickly.
3. A polymer price shock. Polymer is 7.3 index points of a diaper and its price has been anchored by Chinese surplus capacity. A propylene spike, an anti-dumping action, or a plant outage would move that line for the first time in a decade, and because material is only 14.68 per cent of realisation the pass-through would be manageable — but it would remove the cost tailwind that has funded the premium tier.
4. Trade policy on finished diapers. Diapers cross borders as finished product far more than as material, and they are bulky, so tariffs and freight both bite harder than they would on a dense good. Any tariff action affecting Chinese or Southeast Asian finished diapers would reprice the value tier in importing markets rather than relocate production quickly.
5. Currency. The four largest modelled owners report in dollars, yen, euros and renminbi. Unicharm’s China swing from ¥17,530 million of profit to a ¥5,364 million core operating loss and Ontex’s euro-denominated margin are both, in part, translation stories. A model stated in dollars carries that exposure silently.
6. Regulatory cost landing on the product. The packaging regulation is being written without a proven end-of-life route at volume. If extended producer responsibility reaches the diaper itself rather than the pack, the cost is per unit and falls on the value tier hardest — which is the tier where the volume growth is supposed to come from.
What would falsify this report
Three observations would show the model is wrong rather than merely imprecise. If unit growth in Middle East and Africa comes in well above the 45,000 million modelled for 2033 without a matching fall in realisation, then penetration is cheaper to serve than assumed and the conservative case is too pessimistic. If branded realisation in North America and Europe stops rising while private-label share holds flat, then the price engine has failed for a reason other than private label and the base case has no second driver. And if polymer loading per unit stops rising, the entire material substitution argument in the two companion reports loses its mechanism, because the diaper would no longer be trading fibre for gel.
None of the three is currently visible in the filings, the standards or our own fieldwork. All three are observable within two reporting cycles, which is the point of stating them.
Paysage réglementaire
Regulatory landscape
A diaper is a standardised commercial product, not a licensed one: there is no pre-market approval to sell it in any major market. Regulation arrives instead through three doors — product safety standards, waste and packaging law, and fibre due diligence — and the compliance burden is asymmetric in a way that favours scale.
Product safety: China’s standard is the most specific
GB/T 28004.1-2021, Disposable diapers — Part 1: Disposable diapers for baby was published on 13 April 2021 and took effect on 1 May 2022, partially superseding GB/T 28004-2011; the companion Part 2 covers adult products. It is the most detailed public specification of what a baby diaper must be, and it is a useful proxy for where any serious regulator will end up.
| Test group | What is specified |
|---|---|
| Absorption performance | First and second absorption speed, rewet, and leakage volume |
| Chemistry | pH; heavy metals including lead, arsenic, mercury and cadmium; migratable fluorescent substances; acrylamide; formaldehyde; phthalates including DBP, BBP and DEHP; carcinogenic aromatic amines |
| Microbiology | Total bacterial count, coliform, Pseudomonas aeruginosa, Staphylococcus aureus, haemolytic streptococcus, total fungi |
Enforcement is by market surveillance rather than by approval, and the sampling rules show how it works in practice: a 2025 municipal implementing rule for diaper quality supervision takes ten packs per batch, nine for testing and one held, requiring at least twelve pieces per pack. A brand that fails a batch loses the batch and the listing. That is a materially different compliance model from the European one, and it explains why the acrylamide and fluorescent-substance tests are treated by Chinese converters as design constraints rather than paperwork.
Waste and packaging: the European constraint
The Packaging and Packaging Waste Regulation is the live issue. As the European Commission prepares the implementing act on harmonised waste sorting labels, with the Joint Research Centre producing the user manual, EDANA set out its position on 13 August 2025: allow black-and-white or transparent labels without mandatory colours, avoid any obligation to print material composition on the label, permit flexible label placement, encourage voluntary QR codes for language-specific information, exempt very small packaging, and phase implementation in with clear pictograms. The industry argument is that extra colour inks can contaminate substrate and reduce recyclate quality — a packaging argument, not an avoidance one.
Underneath the labelling question sits the harder one. EDANA’s own assessment of absorbent hygiene product collection and recycling concludes that many initiatives are not mature enough to scale, not sufficiently developed to move to pilot, or lack the economic data to be assessed. There is, in other words, no proven end-of-life route for the product at volume, and the regulation is being written anyway. That is the largest unquantified cost in this report, and the reason the risk chapter treats regulatory cost as a scenario variable rather than a line item.
Fibre due diligence
The EU Deforestation Regulation puts a due-diligence obligation on wood fibre placed on the European market, which reaches every bale of fluff pulp a European converter buys. For an integrated mill with chain-of-custody certification this is an extension of what it already does. For a converter buying on the spot market it is a new documentation function, and it is one more reason the supply relationship in this chain is consolidating toward named mills.
What it costs, and who it advantages
Nobody in our interviews could give a per-SKU compliance cost, and several said the honest answer is that it is absorbed into the regulatory affairs function rather than costed. What they described consistently is that each new obligation — a labelled pack, a documented bale, a tested batch — is a fixed cost per SKU, and fixed costs per SKU fall hardest on the operator with the fewest SKUs. Regulation in this category is therefore mildly regressive: it costs the private-label converter more per unit than the brand owner, which is the opposite of its stated intent.