
Global Airport Baggage Handling Systems Market Report, Size, Share and Forecast 2026–2033: A Sixteen-Kilometre Factory Under the Floor — the Market Is Paid for Steel and Loses the Bag at the Handover
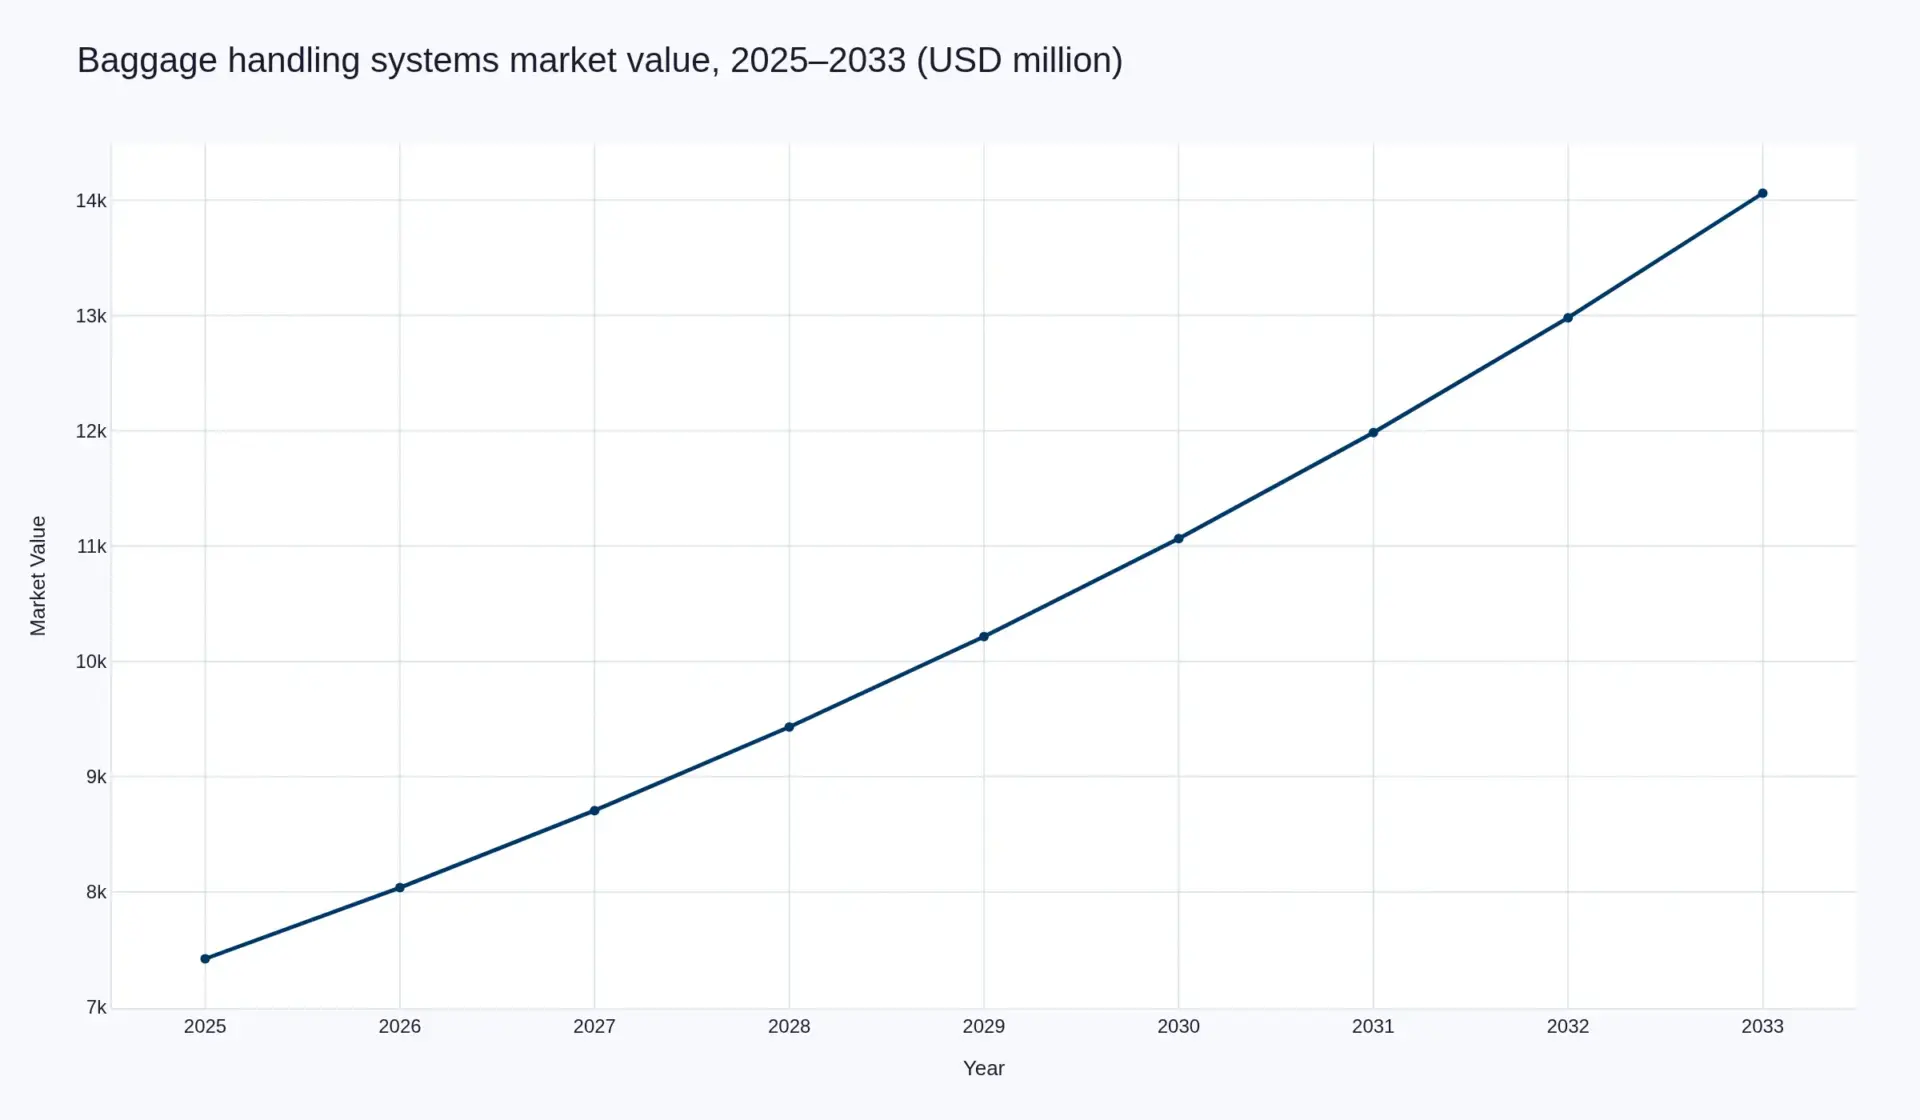
Airport baggage handling systems are a USD 7.42 billion market in 2025 — the base year — reaching USD 8.04 billion in 2026 and USD 14.06 billion by 2033, an 8.32 per cent compound annual growth rate. Baggage items handled grow at only 3.81 per cent a year over the same period, from 4.33 billion to 5.84 billion, so spend per bag rises from USD 1.71 to USD 2.41. This is a content market, not a volume one: the bag count barely moves, and what each bag costs to move, screen and account for rises 4.38 per cent a year.
The content being bought is still overwhelming steel. Movement — conveyance, sortation, tray systems and the engineering around them — is 47.6 per cent of 2025 value and 46.2 per cent in 2033. Assurance, meaning hold baggage screening and the maintenance annuity, falls from 28.0 to 25.0 per cent. Intelligence — controls, reconciliation, tracking and bag drop — rises from 24.4 to 28.7 per cent and does not overtake the steel inside the window.
The failure, meanwhile, sits where the money is not. Forty-one per cent of mishandled bags are lost at transfer, a handover between systems rather than a mechanical fault, and the industry's own bill for that is USD 5 billion a year — USD 149.70 for every bag that goes wrong, or two-thirds of the size of the entire capital market meant to prevent it. The market is paid to move the bag and loses it at the handover.
1. Market Snapshot
Airport baggage handling systems are a USD 7.42 billion market in 2025 — the base year for this forecast — and USD 8.04 billion in 2026, its first forecast year. By 2033 the market reaches USD 14.06 billion, a compound annual growth rate of 8.32 per cent measured from that 2025 base. The volume line underneath runs at less than half that rate: 4.33 billion baggage items pass through airport systems in 2025 and 5.84 billion in 2033, 3.81 per cent a year. Spend per bag therefore rises from USD 1.71 to USD 2.41, 4.38 per cent a year. A market whose unit count grows at 3.81 per cent and whose revenue grows at 8.32 per cent is not selling more bags. It is selling more per bag, and the whole forecast turns on identifying what that extra content is.
Those two opening figures are the same line one year apart, not two estimates. USD 7,420 million grown at this report's own 8.32 per cent is USD 8,037 million. The stat block at the head of this page prints the base-year value — USD 7,420 million on 4.33 billion bags handled — while the tables and the narrative below are stated on 2026, the first forecast year, unless the text says otherwise. Nothing forward-looking moves with the choice of base year: the 2033 value, the product-line split in section 5 and the regional split in section 6 are 2026-onward figures either way. The base is a bottom-up construction assembled from disclosed contract values, installed-system replacement cycles, screening retrofit programmes and the maintenance annuities attached to them — not a borrowed headline. Where a figure is a Pheonix estimate rather than a disclosed one, the text says so at the point of use.
| Indicator | 2025 (base year) | 2026 | 2033 | Change, 2025–2033 |
|---|---|---|---|---|
| Gross market value, USD million | 7,420 | 8,037 | 14,060 | +89.5% · 8.32% CAGR |
| Baggage items handled through airport systems, billion | 4.33 | 4.50 | 5.84 | +34.9% · 3.81% CAGR |
| Spend per baggage item, USD | 1.71 | 1.79 | 2.41 | +40.9% · 4.38% a year |
| Movement layer share of value | 47.6% | — | 46.2% | −1.4 points |
| Assurance layer share of value | 28.0% | — | 25.0% | −3.0 points |
| Intelligence layer share of value | 24.4% | — | 28.7% | +4.3 points |
| Forecast period | 2026–2033 | 8 years from base | ||
Source: Pheonix Research model on the 2025 base year. Value and volume are constructed in sections 3 and 5. The three layers are defined in section 3: movement is conveyance, sortation, tray systems and the engineering and installation around them; assurance is hold baggage screening plus operations and maintenance; intelligence is controls, baggage reconciliation, tracking and the passenger-facing bag drop estate. Baggage items handled is throughput through airport systems, not a unit count of equipment sold.
What is counted here matters more than usual, because baggage handling has no shipment count and no trade association publishing one. This report counts spend on the systems and services that move, screen, sort, store, track and account for checked baggage inside an airport: conveyors and sortation, individual carrier systems and their trays, early bag stores, hold baggage screening machines and their in-line integration, controls and baggage reconciliation software, self-service bag drop, autonomous airside transport, and the engineering, installation and maintenance contracts attached to all of it. It does not count ground-handling labour, airline-side lost-baggage recovery services of the WorldTracer type, or airport IT that is not baggage-specific. That boundary is why this figure sits below some broader statements about "the baggage market": those usually absorb handling labour and airline recovery, which are service businesses running on entirely different economics. Section 3 sets the boundary out in full and shows the component build behind the number.
Two physical facts explain most of the commercial behaviour in this market, and neither of them is about software. The first is that the baggage hall, not the runway and not the departure lounge, is frequently the binding constraint on an airport's capacity. Warsaw's Chopin Airport states the case in its own procurement documents: the terminal's long-term capacity is capped by its baggage sorting area at 1,800 departure and 2,200 arrival items an hour — equivalent, the airport says, to the capacity of no more than seven wide-body Boeing 787s. The second is scale. The baggage system for Poland's new CPK airport will occupy around 80,000 square metres of terminal space and run more than 16 kilometres of conveyor, for a supply-and-installation price of EUR 115 million net. Sixteen kilometres is not a fit-out. It is a factory, built under the floor, procured as a construction package, and then operated for twenty years as plant.
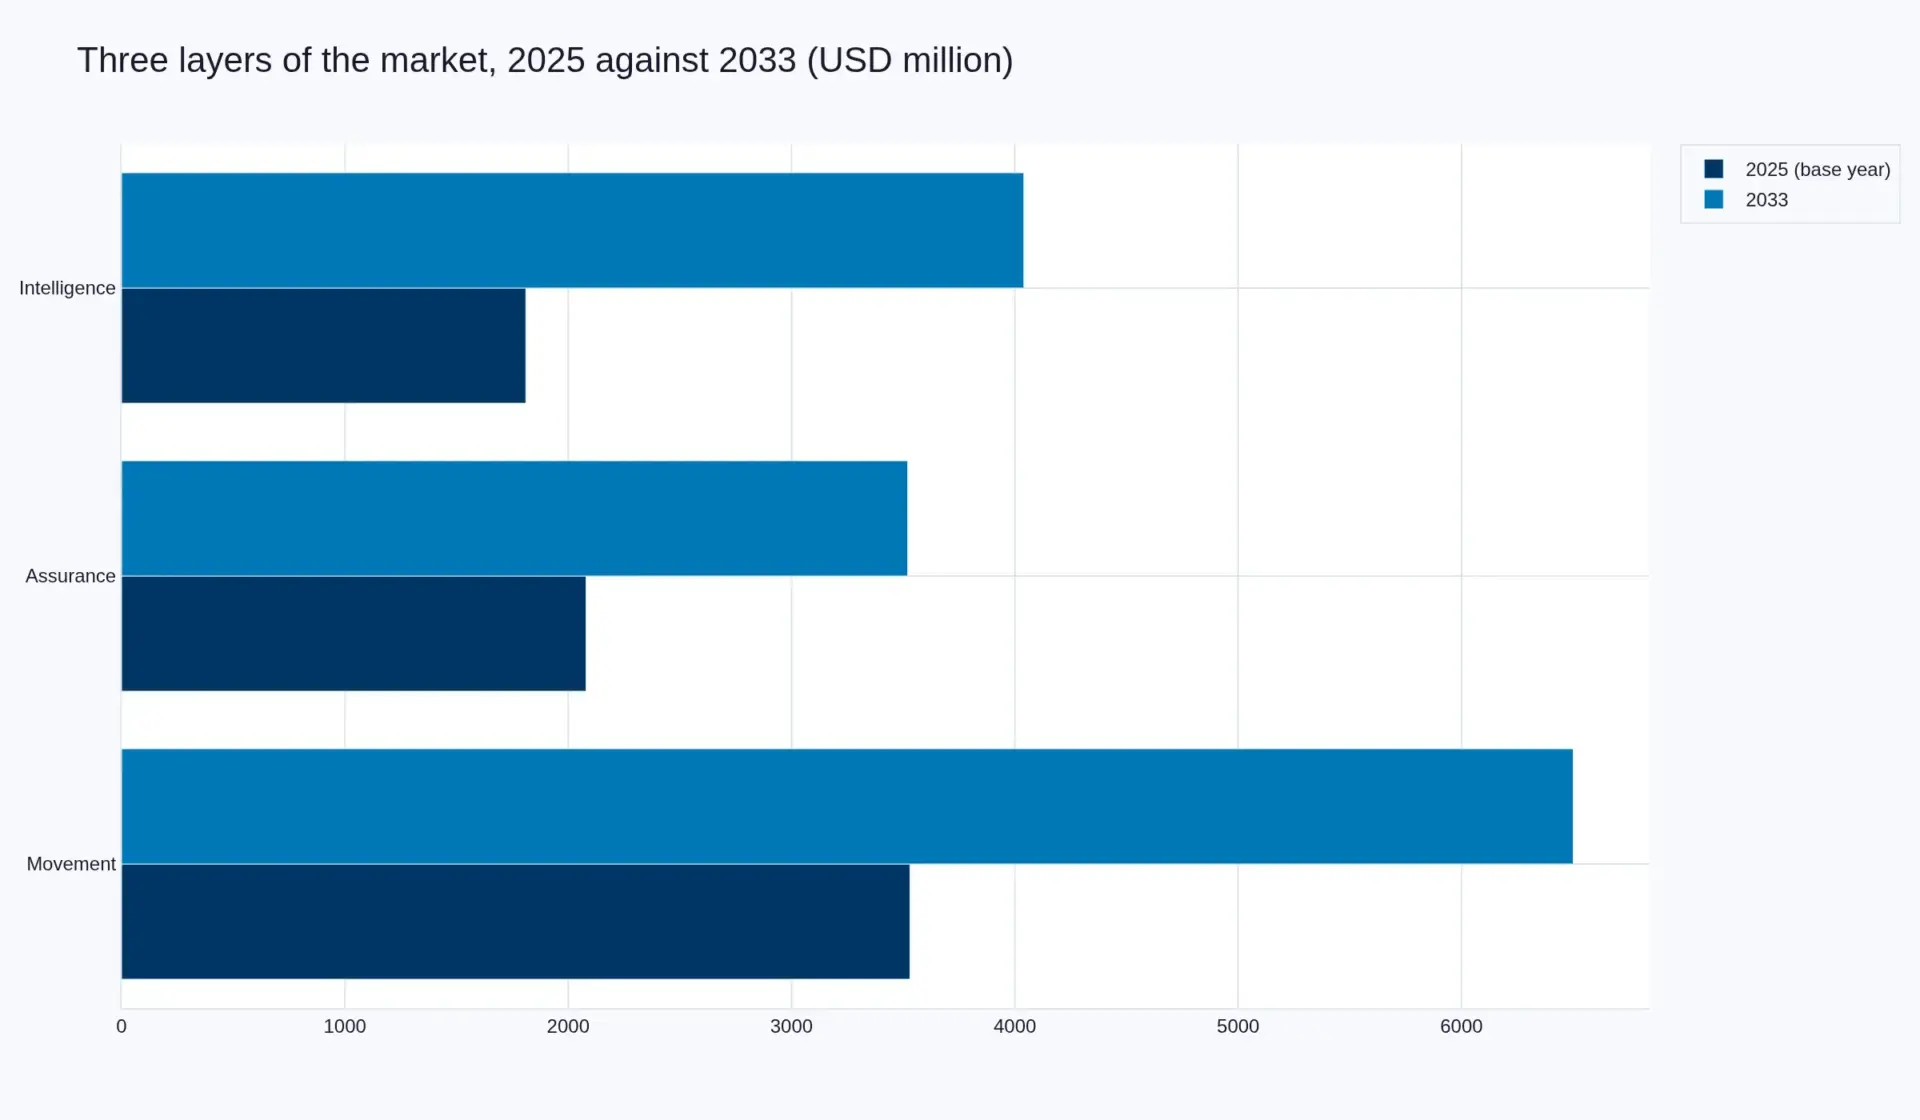
Split by what the money actually buys, the market has three layers. Movement — conveyance, sortation, tray systems and the engineering and installation wrapped around them — is USD 3,530 million in 2025, 47.6 per cent of the total. Assurance — hold baggage screening plus the operations and maintenance annuity — is USD 2,080 million, 28.0 per cent. Intelligence — controls, baggage reconciliation, tracking and the passenger-facing bag drop estate — is USD 1,810 million, 24.4 per cent. By 2033 the order is unchanged and the proportions have moved: movement USD 6,500 million at 46.2 per cent, assurance USD 3,520 million at 25.0 per cent, intelligence USD 4,040 million at 28.7 per cent. Intelligence grows 10.56 per cent a year against 7.93 for movement and 6.8 for assurance, and still does not overtake the steel inside the forecast window. Anyone planning on the assumption that the software layer wins by 2033 is planning on a market that does not exist in these numbers.
The argument of this report is that the money and the failure sit in different places. SITA's Baggage IT Insights 2025, built on the WorldTracer data of 280 airlines and weighted to IATA traffic, puts the 2024 mishandling rate at 6.3 bags per 1,000 passengers — down from 6.9 in 2023 and 67 per cent below 2007 — on 33.4 million mishandled bags against a record 5.3 billion passengers. The industry's own estimate of what that costs airlines is USD 5 billion a year, which is USD 149.70 per mishandled bag. That bill is two-thirds the size of the entire capital market meant to prevent it. And 41 per cent of the mishandling happens at transfer, where the conveyor is working perfectly and two systems fail to tell each other what they know. Under a quarter of the value is spent on the layer that would fix it. Section 4 takes that apart.
Two adjacent markets are worth reading alongside this one, because the bag journey now starts before the terminal. The bay the passenger leaves the car in is covered in our airport parking and pre-booked reservation platforms report; the sensing layer that tells an operator where assets actually are, rather than where they were recorded as being, is in parking occupancy sensing and space guidance; and the kerbside that feeds both is in curb and kerbside management. Baggage is the same problem one building further in — a physical asset, a flow, and a data layer being retrofitted underneath it.
2. Executive Summary
One: this is a mature capital market with a services tail, not a growth market. The largest automation vendor in the world, Daifuku, reported calendar-2025 orders of JPY 672.6 billion and net sales of JPY 660.7 billion, up 2.6 per cent, with an operating margin above 15 per cent for the first time. Its own commentary separates the drivers: intralogistics and cleanroom systems drove the increase, while orders for airport systems "remained steady". The world's leading baggage vendor grew everywhere except in baggage, in a year when global passengers rose 8.2 per cent. That is what a replacement-and-retrofit market looks like from the inside, and it is the correct starting assumption for anyone modelling this segment.
Two: the growth is in content, not in bags. Baggage items handled rise 3.81 per cent a year; market value rises 8.32. The difference is entirely what gets built around each bag: screening that meets a new standard, controls that can produce an auditable record at four handover points, tray systems that give a hundred per cent read rate, cameras that read a tag the barcode missed, and a maintenance contract that keeps all of it running for a decade. Spend per bag goes from USD 1.71 to USD 2.41. If a model in this market assumes volume-driven growth it will overstate 2033 by a wide margin; if it assumes the steel disappears it will understate it just as badly.
Three: the handover is where the bag is lost, and the handover is the least-funded part of the chain. Forty-one per cent of mishandling happens at transfer. A further 17 per cent comes from tagging, ticketing and security errors, 16 per cent from loading failures and 10 per cent from operational causes such as weather, customs and capacity — as close as the industry gets to an honest breakdown of an annual USD 5 billion bill, or USD 149.70 for every bag that goes wrong. The physical system at a transfer airport is usually functioning. What fails is the custody record: which system knew the bag existed, when, and whether it told the next one. IATA's Resolution 753 made four tracking points mandatory; the industry's Modern Baggage Messaging standard is expected to cut mishandling a further 5 per cent on its own, which is a larger effect than most hardware upgrades claim.
Four: procurement, not technology, sets the price. At CPK Warsaw two qualified bidders priced the same specification, in the same tender: EUR 198 million net from BEUMER Group Poland, EUR 115 million net from the Vanderlande consortium that won. The spread is 72.2 per cent. Nothing about conveyor changes by 72 per cent between two firms that have each commissioned a system at an airport of 30 million passengers or more. The difference is risk allocation, scope edges, the value of the reference, and how much of the ten-year maintenance annuity a bidder will buy into with price. This is the most important number in the report for anyone forecasting revenue from a pipeline of projects: the pipeline tells you the count, not the value.
Five: the market is consolidating into three qualified suppliers, and the qualification is the moat. Vanderlande completed its acquisition of Siemens Logistics' German headquarters and operations outside the United States on 2 May 2025, with the US clearance still running at the time of writing; its own website now greets visitors with "Siemens Logistics is now part of Vanderlande". CPK's tender admitted only bidders that had commissioned a baggage system at an airport of at least 30 million annual passengers within the previous 25 years — a condition that thins the field structurally rather than by preference. Beyond the big three of Daifuku, Vanderlande and BEUMER, the credible challengers are national champions with a home-hub reference: Leonardo, which sold its 50th MBHS cross-belt sorter with the Malta International Airport award of March 2026, and Pteris Global, Fives and a handful of regional integrators. Software and controls are the one part of the chain where the field is wide.
Regionally, the market moves to where the terminals are. Asia-Pacific is 27.5 per cent of 2025 value and 33.0 per cent of 2033, growing 10.8 per cent a year on the back of greenfield capacity — Changi Terminal 5 at roughly 50 million passengers, CPK at 40 million, the Indian pipeline. Europe is the largest region today at 29.0 per cent and shrinks to 25.3 per cent at 6.5 per cent growth, because its spending is a compliance retrofit cycle rather than a construction boom. North America goes from 26.0 to 23.4 per cent at 6.9 per cent, and is the market where individual carrier systems are finally being adopted at mid-sized airports. Those three numbers, more than any technology trend, decide which vendors have a decade.
What would change the forecast. Two things, and neither is a product. First, a step change in transfer performance: if Modern Baggage Messaging and optical tracking together deliver more than the 5 per cent currently claimed, the case for hardware investment weakens and the intelligence layer grows faster than modelled. Second, a capacity shock: a sustained deterioration in airline profitability would delay greenfield terminal openings, and baggage systems are ordered against terminal dates. IATA's December 2025 outlook has the industry earning a 3.9 per cent net margin and a 6.8 per cent return on invested capital against an 8.2 per cent cost of capital in 2026 — a sector that does not cover its cost of capital has a structural reason to press airport charges, and airports fund baggage systems out of those charges. The base case assumes neither happens; section 11 prices both.
3. What This Market Actually Sells
The unit of sale is not a conveyor. It is a building inside a building: a controlled environment in which 1,800 to 5,000 bags an hour are inducted, screened, identified, stored, sequenced, sorted, loaded and later returned. The clearest recent illustration is Malta International Airport, which in March 2026 contracted Leonardo for a replacement system capable of processing 5,000 bags an hour, with an advanced reception and storage element sized specifically for the cruise passengers who home-port through the island at peak. That last clause is the point. The system is not sized to the airport's average traffic. It is sized to a demand shape created by a different industry's timetable.
Because the object is a building, the contract is a construction contract with a software business hidden inside it. CPK's procurement split the price into three explicitly separate amounts: a net price in euros for supply and installation, a five-year operations and maintenance price in zloty, and an option on a further five years, also in zloty. The winner, a Vanderlande consortium, bid EUR 115 million net for supply and installation and PLN 97 million for the first five years of operation and maintenance, with PLN 93 million for the extension. BEUMER Group Poland bid EUR 198 million net for the same scope and PLN 116 million for the same five years. The equipment price differed by 72 per cent; the five-year service price differed by 20 per cent. That asymmetry is the most diagnostic fact in this report: the capital price is negotiable because scope edges and risk allocation are negotiable, while the running cost of a built system is a known quantity that no bidder can move far.
| Product line | What is actually bought | 2025, USD m | Share | 2033, USD m | CAGR |
|---|---|---|---|---|---|
| Conveyance and sortation | Belt and queue conveyors, tilt-tray and cross-belt sorters, individual carrier systems and trays, diverters, early bag storage | 2,480 | 33.4% | 4,620 | 8.09% |
| Hold baggage screening integration | Explosive detection and CT machines, in-line integration, screening hall works, standard upgrades | 1,360 | 18.3% | 1,980 | 4.81% |
| Controls, software and tracking | BHS controls and supervisory software, baggage reconciliation, RFID and vision capture, messaging, analytics | 1,190 | 16.0% | 2,860 | 11.58% |
| Engineering and installation | Design, systems integration, installation, commissioning, throughput testing | 1,050 | 14.2% | 1,880 | 7.55% |
| Operations and maintenance | Resident service teams, spares, planned and corrective maintenance, performance guarantees | 720 | 9.7% | 1,540 | 9.97% |
| Bag drop and passenger handling | Self-service and biometric bag drop, integrated tote induction, off-airport and advance acceptance | 620 | 8.4% | 1,180 | 8.38% |
| Total | 7,420 | 100% | 14,060 | 8.32% |
Source: Pheonix Research model on the 2025 base year, built from disclosed contract values with five and ten year service components separated, disclosed vendor and airport capital programmes, screening retrofit timetables by jurisdiction, and installed-base replacement cycles at an assumed 20 to 25 year economic life. Shares and CAGRs are computed on the unrounded components; the totals shown are the model's own and will not reconcile to the rounded rows in every case.
The boundary of the market is a judgement, and this report states it rather than burying it. Excluded: ground-handling labour, which is the largest single cost in the bag journey and belongs to a different industry with different contracts; airline lost-baggage recovery platforms, which are sold to carriers rather than airports and priced per bag traced; and airport-wide IT that happens to touch baggage. Included: everything a capital projects director or a baggage operations head signs for. The consequence is a market of USD 7.42 billion rather than the larger figures that circulate when labour and recovery are folded in. That is deliberate, because a forecast that mixes a capital package and a per-bag service fee cannot be used to size either.
Within that boundary the interesting question is what each line is really being paid for. Conveyance is paid for capacity — kilos and bags per hour against a peak, with a redundancy requirement attached so that a single diverter failure does not stop the hall. Screening is paid for compliance, and compliance is a step function with a date on it, which is why the line grows at 4.81 per cent against 8.09 for conveyance: the retrofit wave completes inside the forecast window and then reverts to replacement. Engineering and installation is paid for risk, priced as a percentage of the equipment and defended with programme schedule. Controls, software and tracking is paid for evidence — the ability to say where a specific bag was at four points in its journey and prove it later. And maintenance is paid for uptime, on a contract that outlives the political cycle of the airport that signed it.
That last distinction is why this market behaves better than its order book suggests. A greenfield contract is lumpy, competitive and exposed to a terminal opening slipping by two years. The maintenance annuity on the same system is none of those things. It begins at commissioning, renews on a five-year cycle, is rarely re-tendered to a competitor who did not build the machine, and grows with the system's own expansion. When CPK prices ten years of it before the first bag has moved, it is doing what every sophisticated buyer in this market now does: treating the equipment sale as the entry ticket and the service contract as the actual business.
Two consequences follow for anyone entering this market. The first is that a challenger cannot win on equipment price alone, because the incumbent's advantage is not in the equipment price — it is in the reference at a comparable airport, the local service team that already exists, and the willingness to carry a twenty-year performance obligation. The second is that the software layer can be attacked separately. Baggage reconciliation, tracking, analytics and messaging are bought on a different cycle, from a different budget line, and increasingly from vendors who have never welded a conveyor. The vendors that grew fastest in 2025 and 2026 were, almost without exception, in that second category.
4. Demand Drivers and Structural Forces
Six forces set the shape of demand through 2033, and they pull in different directions. Getting the balance right between them is what separates an 8.32 per cent forecast from a 5 per cent one or a 12 per cent one.
Passenger growth is the base rate, and it is steady rather than spectacular. IATA's December 2025 outlook puts global passengers at 5.2 billion in 2026, up 4.4 per cent on 2025, with a record load factor of 83.8 per cent. ACI World's Airport Traffic Forecasts use a 4.1 per cent compound annual growth rate for 2025 to 2040, and the industry expectation quoted across the baggage literature is 8 billion passengers by 2037. Applied to 2025's 4.98 billion passengers, a 4.1 per cent rate gives 6.87 billion by 2033. Bags grow slightly slower than passengers, and that is the first thing most models get wrong. At 0.87 bags per passenger in 2025 falling to 0.85 by 2033 — the effect of low-cost short-haul passengers travelling hand-luggage only — baggage items reach 5.84 billion. The bag count is a passenger derivative with a negative drift, and no amount of automation changes it.
Transfer complexity is the demand driver nobody forecasts, and the one that matters most commercially. Forty-one per cent of mishandled baggage goes wrong at transfer. That is a hub phenomenon: it scales with the number of handovers per journey, not with the number of passengers, and it is growing as alliance and interline networks deepen. Star Alliance's Baggage Hub tracked more than 180 million interline bags in 2025. Every one of those bags crossed at least one custody boundary between systems that were installed by different vendors, in different decades, to different data conventions. This is why the intelligence layer grows at 10.56 per cent while the bags it serves grow at 3.81: the problem is not throughput, it is that the throughput changes hands.
Labour availability is turning automation from a business case into an operating necessity. Baggage work is repetitive, physically demanding and time-boxed by the turnaround, which makes it an unusually clean target for robotics. Changi Airport Group put two fully driverless tractors into live service in January 2026 to move bags between Terminal 1 and Terminal 4, with six more due on a Terminal 2 route during the year and a fleet of 24 planned by 2027; each carries more than ten sensors and cameras and is supervised from a control room. Avinor's robot loading project with BEUMER and AAT is installing in the new Terminal 1 sortation system, with first live-bag test loading expected before summer 2026. What is being automated is not the sortation — that was automated decades ago — but the handler processes at either end: induction, container build, loading and unloading.
Regulation arrives as step functions, not trends. Four compliance events drive the curve. The IATA Resolution 753 tracking requirement creates a data obligation at four handover points and therefore a scanner, a reconciliation layer and a messaging standard at each. The European hold baggage screening standard creates a machine replacement cycle with dates attached. Modern Baggage Messaging version 2 creates a data quality upgrade expected to cut mishandling by a further 5 per cent on its own. And border and customs regimes create arrival-side processing that did not exist a decade ago. None of these is smooth, and all of them are budgeted in advance. The screening line in Table 2 grows at 4.81 per cent precisely because its compliance wave is a lump that finishes.
Capacity ceilings force replacement before failure, which is a form of demand that survives recessions. The Chopin example is not unusual; it is simply the one an airport has written down. When the sorting hall caps terminal throughput at 1,800 departure items an hour, the baggage system stops being an operating cost and becomes the constraint on the airport's entire growth case. Airports in that position buy, because the alternative is to hand traffic to a competitor. This is why the market's worst years are shallower than the aviation cycle: a system that is physically full cannot wait for the cycle to turn.
Space, meanwhile, is pushing the factory out of the terminal. Western Sydney International's baggage systems lead makes the argument plainly: where space permits, locating baggage operations in an adjacent facility rather than inside the terminal is both cheaper and more suitable, and individual carrier systems make the transfer between buildings fast enough to be operationally invisible. That is a quiet structural shift with a real consequence for the market — an adjacent building has different fire, structural and environmental requirements from a terminal basement, a shorter programme, and a lower cost per square metre. It also changes who the customer is, because a stand-alone baggage facility can be procured and financed separately.
Set against those six, one force pulls the other way, and it is the reason the volume line is so flat. Passengers are shifting toward hand luggage, and low-cost carriers have trained a generation of short-haul travellers to travel without checking a bag. Every bag not checked is a bag not screened, not sorted, not stored and not reclaimed. The market's answer is not to chase the bag count but to raise what it charges for the bags that remain — which is exactly what the 4.38 per cent growth in spend per bag represents, and exactly why the content of the system, not the count of bags, is where this forecast lives.
5. Segment and Product Split
Table 2 in section 3 gives the six product lines. This section does something different with the same money: it groups the lines into the three layers that behave differently in a downturn, in a tender and in a renewal, because those are the distinctions a buyer or an investor actually acts on.
Movement is conveyance and sortation plus the engineering and installation that delivers it: USD 3,530 million in 2025, USD 6,500 million in 2033, 7.93 per cent a year, and a share that slips from 47.6 to 46.2 per cent. It is the largest, the slowest-growing, and by far the most cyclical layer, because it is bought against a construction programme. Assurance is hold baggage screening plus the operations and maintenance annuity: USD 2,080 million to USD 3,520 million, 6.80 per cent, share falling from 28.0 to 25.0 per cent. This is the layer that looks defensive and is not, because half of it — screening — is a compliance cycle that finishes, while the other half — maintenance — is the most reliably recurring revenue in the market. Blending two such different businesses into one layer is a reminder that segment averages hide more than they reveal. Intelligence is controls, reconciliation, tracking and the bag drop estate: USD 1,810 million to USD 4,040 million, 10.56 per cent, share rising from 24.4 to 28.7 per cent.
| Layer | What is in it | 2025, USD m | Share | 2033, USD m | Share | CAGR | Share change |
|---|---|---|---|---|---|---|---|
| Movement | Conveyance, sortation, tray systems, engineering and installation | 3,530 | 47.6% | 6,500 | 46.2% | 7.93% | −1.4 points |
| Assurance | Hold baggage screening, operations and maintenance | 2,080 | 28.0% | 3,520 | 25.0% | 6.80% | −3.0 points |
| Intelligence | Controls, reconciliation, tracking, bag drop | 1,810 | 24.4% | 4,040 | 28.7% | 10.56% | +4.3 points |
| Total | 7,420 | 100% | 14,060 | 100% | 8.32% |
Source: Pheonix Research model on the 2025 base year. Layer definitions are load-bearing: an operations and maintenance contract is assurance because it is bought to keep a certified system certified, not because it is a service. Screening sits in assurance for the same reason. Splitting maintenance out of assurance would move roughly USD 720 million in 2025 and USD 1,540 million in 2033 into a recurring-services category that grows at 9.97 per cent.
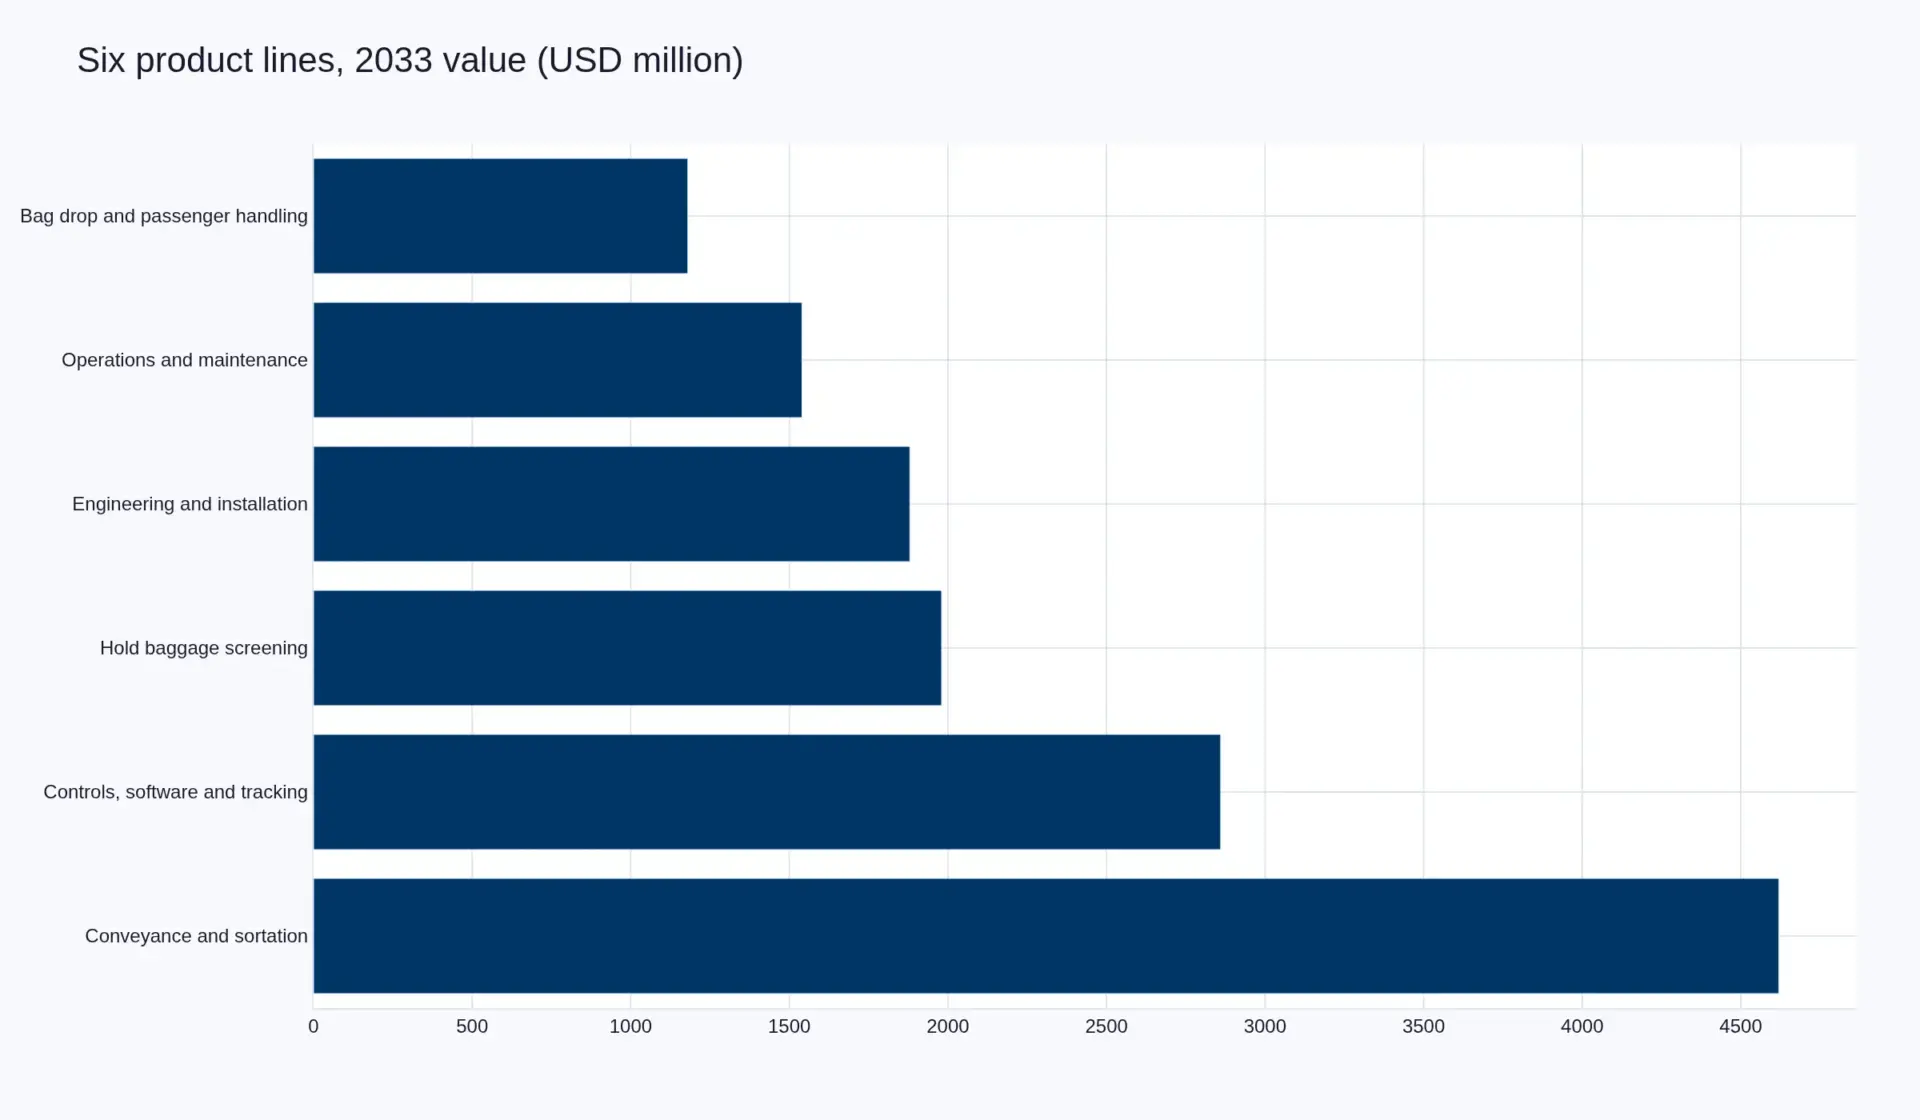
Read the six lines individually and each one has a different story. Conveyance and sortation grows 8.09 per cent, faster than the bags it carries, because capacity is added ahead of demand and because individual carrier systems — which are more expensive per metre than belt conveyors — are steadily displacing belt on new build. CPK says its system will guarantee a hundred per cent tracking and sorting accuracy because every bag travels in its own tray; that is a technology choice with a price, and the price is being paid across a growing share of the world's new terminals. Engineering and installation grows 7.55 per cent and behaves like a construction line: it is priced as a percentage of the equipment package and defended on programme.
Hold baggage screening integration is the slowest line in the table at 4.81 per cent, and the reason is arithmetic rather than weakness. A compliance standard is a fixed number of machines in a fixed number of halls by a fixed date. Once the hall is rebuilt, the machines are bought, and the only remaining demand is replacement at end of life plus whatever capacity growth requires. Europe has been running that wave for most of a decade; the growth in the line after 2028 comes from Asia-Pacific and the Middle East following the same standard later, not from Europe buying more. Treating a screening retrofit boom as a growth market is the most common error in the category.
Controls, software and tracking is the fastest line at 11.58 per cent and the one that most repays attention, because it is where the failure is. Four tracking points, a reconciliation record that survives an audit, a message format that other carriers can read, an optical read when the printed barcode is damaged, and an analytics layer that says which flight and which connection produced the exception — none of that is optional under the standards now in force, and all of it is software. It is also the only line in the table that a new entrant can attack without a fabrication facility, a reference airport of 30 million passengers, or a twenty-year maintenance balance sheet. That is why the share shift is real and why it is still bounded: software attach rates rise against an installed base that is expensive to replace.
Operations and maintenance at 9.97 per cent is the quiet engine of the whole market. It starts the day a system is commissioned, it is priced before the first bag moves, it renews on a five-year cycle, and it is the reason a vendor will accept a thin equipment margin to win a site. CPK's ten-year service package — five years plus a five-year option, priced in zloty against a euro equipment price — is the template. Bag drop and passenger handling at 8.38 per cent is the smallest line and the most visible one: 66 per cent of airlines already offer automated bag drop, a further 16 per cent plan to by 2027, and 65 per cent of airports plan biometric self-service bag drop by the same year. It grows because the unit is being replaced, not because it is being invented.
The forecast's central claim about mix is deliberately modest: intelligence gains 4.3 points in eight years and does not overtake movement. Any narrative that has software overtaking steel inside this window is contradicted by every disclosed contract value in the public record, including the EUR 115 million CPK award where the entire system — hardware, software and integration — was cheaper than a single competitor's hardware bid. What changes is not which layer is biggest. What changes is where the growth rate sits, and that is enough to matter: on an 8.32 per cent market, the difference between participating at 6.8 and at 10.56 is the difference between standing still in share and gaining a third of the market.
6. Regional Analysis
The regional split is the softest number in this report, and it should be treated as such. Contract values are disclosed in some jurisdictions and not others; maintenance is often bundled and undisclosed; and a system installed in Asia-Pacific may be engineered in Europe and manufactured in three other places. What follows allocates value to the region where the airport buying the system is located — the destination of the spend, not the origin of the supplier — and the margins of error are wider here than anywhere else in this document.
| Region | 2025, USD m | Share | 2033, USD m | Share | CAGR | Character of demand |
|---|---|---|---|---|---|---|
| Europe | 2,150 | 29.0% | 3,560 | 25.3% | 6.5% | Compliance retrofit and mid-life replacement of a dense, mature estate |
| Asia-Pacific | 2,040 | 27.5% | 4,640 | 33.0% | 10.8% | Greenfield terminals and first-generation replacement at scale |
| North America | 1,930 | 26.0% | 3,290 | 23.4% | 6.9% | Ageing belt systems being replaced by tray and cross-belt, airport by airport |
| Middle East | 790 | 10.6% | 1,530 | 10.9% | 8.6% | Hub programmes sized to transfer, not origin and destination |
| Latin America | 330 | 4.4% | 690 | 4.9% | 9.7% | Concession-driven upgrades on a low base |
| Africa | 180 | 2.4% | 350 | 2.5% | 8.7% | Gateway hubs and donor-funded modernisation |
| Total | 7,420 | 100% | 14,060 | 100% | 8.32% |
Source: Pheonix Research model. Allocation is to the purchasing airport's region. Shares and CAGRs are computed on unrounded values and will not reconcile exactly to the rounded rows. This is the least reliable table in the report: see the note at the end of this section.
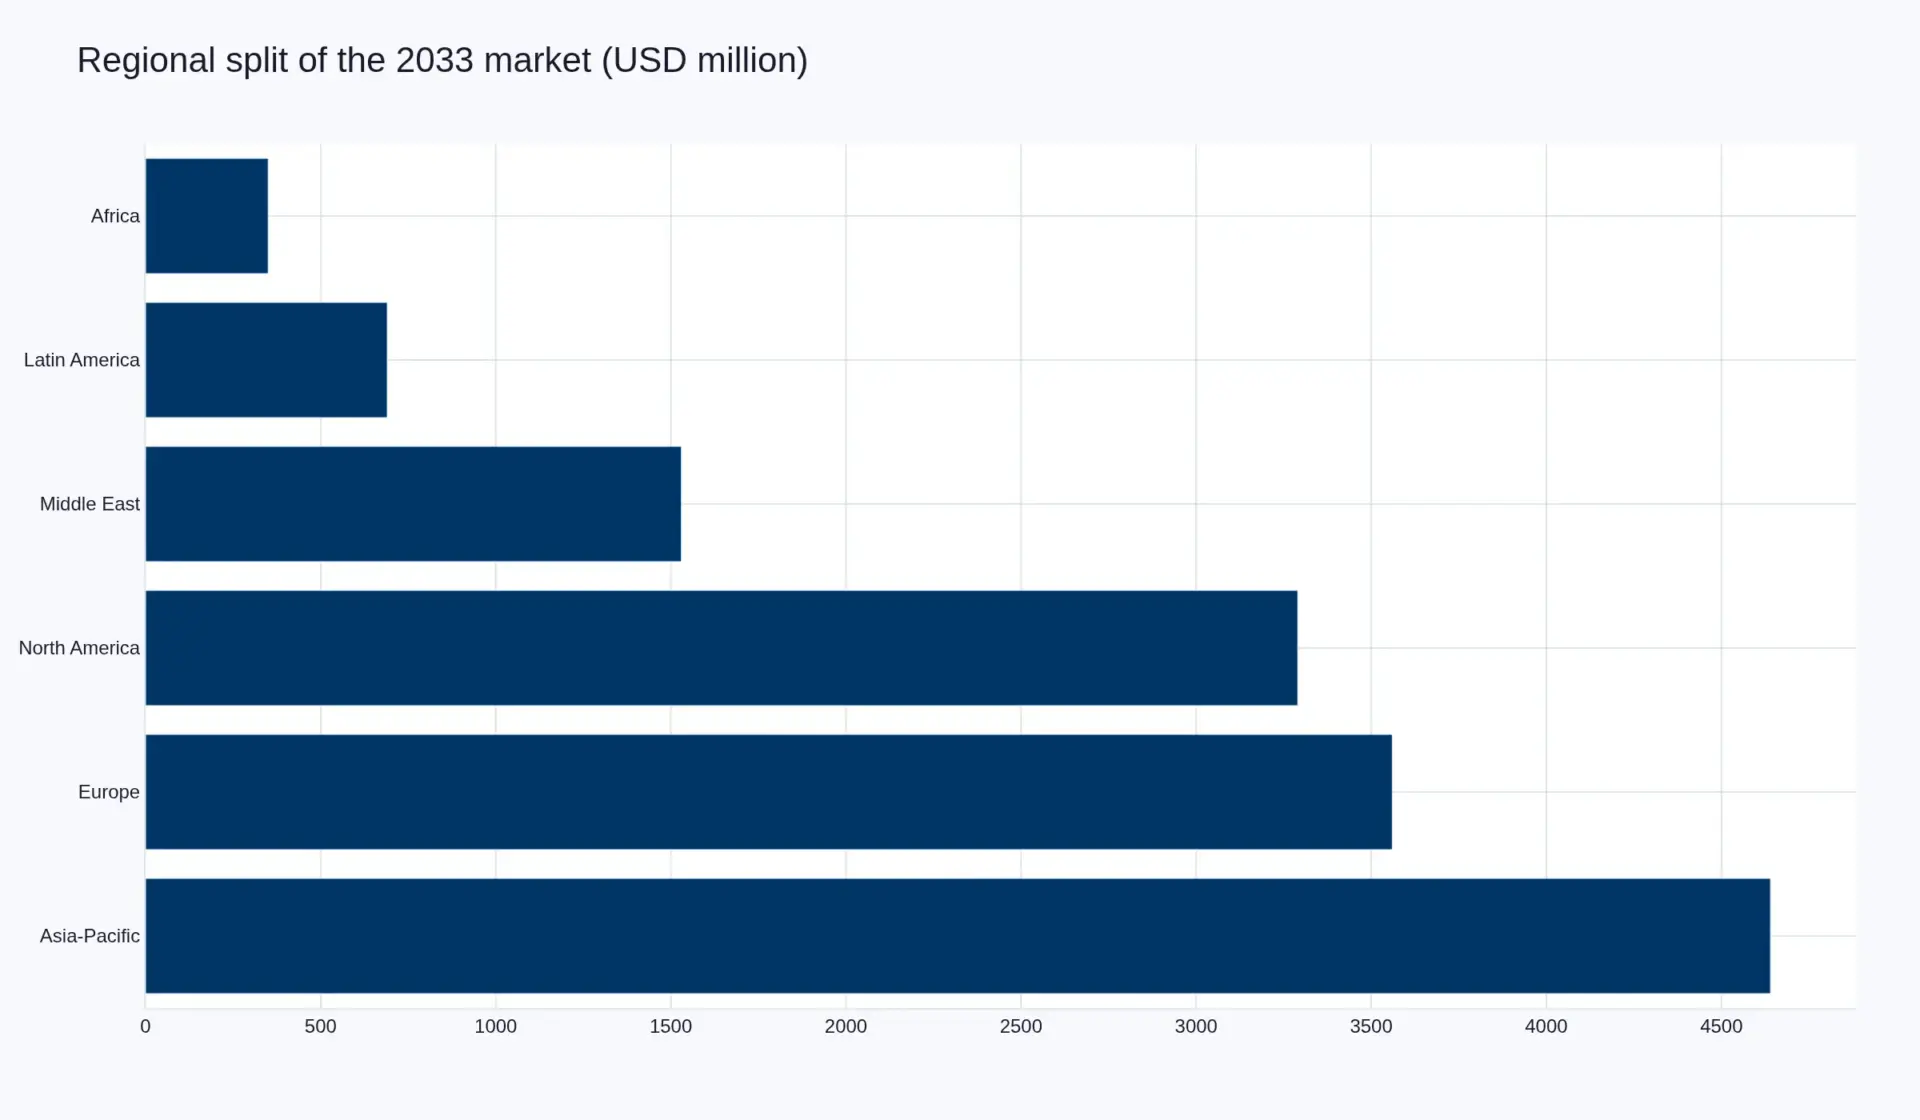
Asia-Pacific is where the market is going. At 10.8 per cent it is the fastest large region by a wide margin, and its share rises from 27.5 to 33.0 per cent. The drivers are concrete and dated: Changi Terminal 5, designed for roughly 50 million passengers with construction under way after substructure and airside contracts worth about SGD 4.75 billion were awarded in May 2025; CPK at 40 million passengers and a 2032 opening; a dense Indian pipeline of new and expanded terminals; and a first replacement cycle now arriving at airports built in the 1990s and 2000s. Greenfield demand is the most valuable demand in this market because it carries the full stack — conveyance, screening, controls, bag drop, installation and a maintenance contract — on a single purchase order with a single qualification test.
Europe is the largest market today and the slowest large one. At 6.5 per cent it gives up 3.7 points of share, and the reason is not weakness but arithmetic: Europe built its estate first, screened it first, and has been running a compliance retrofit cycle that is now largely complete. What remains is replacement at end of life plus a mid-life upgrade market, which is steady and priced competitively. Malta's March 2026 award is a good example of the shape: a 5,000-bag-an-hour system with an advanced reception and storage element, sized for cruise home-porting peaks, delivered inside a terminal expansion programme due to complete in 2028. That is a mature market buying capability it did not previously have, not a greenfield market buying a first system.
North America goes from 26.0 to 23.4 per cent at 6.9 per cent, and it is the region where the technology mix is shifting fastest relative to its installed base. Belt-and-diverter systems installed in the 1990s are being replaced, and the replacement is increasingly an individual carrier system or a cross-belt sorter rather than like-for-like. The signal from the market is that this adoption has reached mid-sized airports, not just the mega-hubs — Grand Rapids is the example the industry cites, with a tray integrated directly into the self-service bag drop unit. Austin's July 2025 authorisation of a USD 320 million design-build integrated baggage system with Beumer, tied to a new arrivals and departures hall, Concourse B and a connecting tunnel, shows the other half of the North American pattern: expansion programmes where the baggage system must be delivered inside a fixed 1,700-day construction window or the terminal cannot open.
The Middle East holds share at 10.9 per cent and grows 8.6 per cent. Its demand is structurally different from everywhere else: hubs built for transfer rather than origin and destination, which means the system is specified for the handover — sortation speed, connection window, early bag storage — rather than for peak check-in. That makes the region the natural early adopter of the intelligence layer, and it is why the Middle East carries a higher value per bag than its passenger count would suggest. Latin America at 9.7 per cent and Africa at 8.7 per cent are both small, both growing above the market average, and both driven by concession and funding structures rather than airline demand: a privatised operator with a capital commitment, or a gateway hub with multilateral funding, buys a system that a state-owned operator on the same traffic would defer.
One caution about all six rows. The regional split is the part of this model with the least external validation. Three of the six regions have no systematic disclosure of baggage system contract values; allocation of multinational contracts to a single airport region is a judgement; and the maintenance component is frequently invisible. The direction — Asia-Pacific gaining share, Europe ceding it — is robust across every source consulted. The precise point spread is a Pheonix estimate, labelled as one, and should be read as a range rather than a figure.
Table of Contents
Competitive Landscape
The competitive structure of this market is the least competitive thing about it. A buyer large enough to need a system of scale is choosing from a field that qualification conditions have already thinned to three or four names, and the thinning is done in the tender documents rather than by the market. CPK’s requirement — a commissioned baggage system at an airport of at least 30 million annual passengers within the previous 25 years — is not unusual, and it is close to a formal statement of the incumbency advantage that everyone in the sector describes informally.
The consolidation has moved decisively in the last two years. Vanderlande completed its acquisition of Siemens Logistics’ German headquarters and operations outside the United States on 2 May 2025, following regulatory approvals, with the process of clearing the US-based operations still running at the time of writing. The combined entity now presents a single portfolio across bag drop, passenger security, conveyance, storage, sortation, make-up and reclaim, and its own website greets visitors with the line “Siemens Logistics is now part of Vanderlande”. Two of the four credible global bidders at any large airport are now one company. Whatever the efficiency case, the effect on a procurement with three qualified bidders is straightforward.
| Vendor | Home | Position | What it sells into this market | Evidence of position |
|---|---|---|---|---|
| Daifuku | Japan | Global tier one, scale leader | Full BHS, sortation, controls, airport systems as one of four group segments | Group orders JPY 672.6bn and sales JPY 660.7bn in calendar 2025, operating margin above 15%; airport orders described as steady while other segments grew |
| Vanderlande | Netherlands | Global tier one, largest airport franchise | Bag drop, conveyance, ICS, storage, sortation, make-up, reclaim, life-cycle services | Won CPK Warsaw at EUR 115m net against a EUR 198m competing bid; absorbed Siemens Logistics outside the US in May 2025 |
| BEUMER Group | Germany | Global tier one, system and robot pioneer | CrisBag ICS, CrisBelt conveyors, tilt-tray loop sortation, screening, software suite, robot loading | EUR 198m net CPK bid; robot loading installation with Avinor in the new Oslo T1 sortation; Austin integrated BHS award at up to USD 320m |
| Leonardo | Italy | National champion with export reach | MBHS cross-belt sortation, screening integration, full turnkey BHS | 50th MBHS sorter sold with the Malta International Airport award of March 2026, a 5,000 bags per hour system due inside a 2028 terminal expansion |
| Fives | France | Mid-tier integrator | Airport baggage handling within a broader intralogistics and process-industry portfolio | Airport baggage handling carried as a named market inside a EUR 2.14bn group |
| Pteris Global | Singapore | Regional integrator, Asia and Middle East | Full BHS, conveyors, carousels, diverters, flight allocation and controls, O&M | More than 150 airport logistics projects across 40-plus countries, including Dubai, Shanghai Pudong and Charlotte Douglas |
| SITA | Switzerland | Software and data layer | Bag Journey, baggage tracking, WorldTracer, messaging, airport and airline data services | WorldTracer is the reference data set behind the industry’s mishandling statistics, drawn from 280 airlines |
| Brock Solutions | Canada | Controls and software specialist | BHS controls, baggage and flight messaging, SmartSuite analytics, performance monitoring | Baggage, passenger and flight messaging positioned directly against the IATA 753 compliance requirement |
| BAGTAG | Netherlands | Digital tag and connected bag | Electronic bag tags, connected bag hardware, event-driven bag journey data | Third-generation tag hardware launched into a market where 38 per cent of passengers already see value in a digital ID tag |
Source: Pheonix Research compilation from company disclosures, procurement records, tender documents and public announcements; company websites verified directly. Position descriptions are Pheonix assessments, not vendor self-descriptions. No third-party market-research publication is used as a source anywhere in this table.
The scale leader is Daifuku, and its financial disclosure is the most useful single document in the sector. In calendar 2025 the group took orders of JPY 672.6 billion and recorded net sales of JPY 660.7 billion, up 2.6 per cent, with operating income above JPY 100 billion for the first time and an operating margin above 15 per cent. It raised its 2027 and 2030 targets and is aiming at JPY 1 trillion of sales and JPY 150 billion of operating income by 2030. The relevant detail is in the attribution: orders for intralogistics, cleanroom and automotive systems are discussed as growth drivers, while airport systems are described as having “remained steady”. The strongest player in this market is treating it as a stable cash business inside a group that grows elsewhere. That tells you more about the ceiling on this segment than any forecast can.
BEUMER Group is the closest thing to a technology protagonist in the field. Its CrisBag carrier system, CrisBelt conveyors, tilt-tray loop sortation and software suite give it the full stack, and it has pushed further into the handler processes than its peers: robot loading for unit load devices and baggage carts is installing with Avinor in the new Oslo Terminal 1 sortation system, with first live-bag test loading expected before summer 2026. It also lost CPK on price by 72 per cent, which is a reminder that technical position and commercial position are separate things in a tender evaluated on a defined specification.
Leonardo is the most credible challenger to the tier-one group, and its route is the one that works: a domestic reference, a proprietary sorter, and an export campaign built on it. The March 2026 Malta award was its fiftieth MBHS cross-belt sorter sold, across Europe, Asia, the Middle East, India and the United States, and it came with a screening scope explicitly compliant with the European Standard 3 regime. Fives and Pteris Global occupy the next tier down: capable, referenced, and strongest where geography or a home market gives them an advantage. Pteris, with more than 150 airport logistics projects across 40-plus countries, is the clearest example of a regional integrator that is not trying to be a global prime.
The software layer is the one part of the chain where the field is genuinely wide, and it is where the growth in Table 3 actually sits. SITA owns the reference data set — its WorldTracer platform is the source of the industry’s mishandling statistics and now integrates Apple’s Share Item Location feature, allowing passengers to hand an AirTag location to the airline. Brock Solutions sells controls and messaging directly against the Resolution 753 obligation. BAGTAG sells the tag. None of the three has ever needed to fabricate a sorter, and all three are taking value out of a layer that used to be bundled into the equipment sale.
What decides share in this market, in order: a reference at an airport the buyer recognises; a local service organisation that can be on site within hours; a balance sheet able to carry a ten-year performance obligation; and price, which comes fourth. The CPK bid spread is the proof. Two firms with the same qualification, bidding the same specification on the same day, produced equipment prices 72 per cent apart. The buyer did not choose the lower number because it was lower; it chose the bid that allocated risk in the shape the airport’s programme required. Anyone modelling this market on a cost-plus basis will be wrong by an amount equal to whatever the next programme’s risk appetite happens to be.
Value Chain
The value chain runs from a consultant’s capacity model to a service technician on site at four in the morning, and the money does not sit where the work is. Eight stages are distinguishable, and the two that decide what the airport gets — the modelling and the specification — are paid for by the airport to firms that never touch the equipment. That single structural fact explains why baggage systems at different airports, built by different vendors, so often converge on the same answer.
| Stage | Who performs it | What it produces | Margin character |
|---|---|---|---|
| 1. Demand and capacity modelling | Specialist airport consultants | Bags per hour at peak, connection profiles, redundancy and footprint requirements | Fee-based, small, and disproportionately influential |
| 2. Specification, tender and qualification | Airport capital projects team plus consultant | A specification, a qualification test, an evaluation model and a contract form | No commercial value captured; determines who may bid |
| 3. Prime contract and systems integration | Vanderlande, BEUMER, Daifuku, Leonardo, regional primes | Single point of accountability for throughput, availability and programme | Contract margin plus risk premium; the position everyone wants |
| 4. Equipment manufacture | OEMs of conveyors, sorters, trays, carousels and screening machines | Physical subsystems built to the integrator’s design | Manufacturing margin, thin; capital intensive |
| 5. Controls and software integration | In-house software teams and specialists such as Brock Solutions | Controls, reconciliation, messaging, tracking, dashboards | High margin, repeatable, and increasingly sold separately |
| 6. Installation and commissioning | Construction trades under the prime, plus specialist rigging | A working system proved at throughput before handover | Priced on programme risk; where overruns are absorbed |
| 7. Operations and maintenance | Vendor service organisations, sometimes airport in-house | Availability against a contractual KPI, spares, resident engineers | Annuity; typically 5 years plus a 5 year option, rarely re-tendered |
| 8. Data, analytics and optimisation | Software vendors, and increasingly the airport itself | Root-cause analysis, predictive maintenance, connection performance | Subscription; the least developed and least priced stage |
Source: Pheonix Research value-chain reconstruction from tender documents, contract structures and vendor disclosures. Margin character describes the shape of the revenue, not a reported margin figure.
Stages 1 and 2 are where the airport’s outcome is actually set. A capacity model decides whether the hall is specified for 1,800 items an hour or 5,000, whether there is redundancy behind the sortation, whether early bag storage is sized for connections or for cruise home-porting, and whether the system is belt or tray. Every one of those choices is made before a vendor is allowed to speak, and each of them has a larger effect on the final price than any negotiation that follows. It is the most consequential unpaid work in the chain — unpaid in the sense that no vendor earns a margin on it, and the airport pays a fee for advice that will shape a EUR 115 million order.
Stage 3 is where risk changes hands and where the market’s concentration really bites. A prime contractor takes responsibility for throughput at a stated availability, on a stated date, under a liquidated damages clause, and then buys the subsystems from companies that carry none of that risk. Only a handful of firms can carry it at scale: a 30 million passenger reference, the balance sheet to absorb a two-year delay, and a service organisation in the country where the system will live. That is why the qualification test in stage 2 and the concentration in stage 3 are the same phenomenon seen from two directions.
Stages 4, 5 and 6 are where the work is and where the margin is not. Manufacturing is capital intensive and competitively bid. Installation is priced on programme risk and is the stage that absorbs overruns — Austin’s contract allows 1,700 calendar days for substantial completion, a duration that exists because the baggage system has to come online with the new arrivals and departures hall, Concourse B and a connecting tunnel, not because conveyor takes five years to install. Controls and software integration is the exception in this group: it is high margin, repeatable across sites, and increasingly separable from the equipment sale, which is exactly why the intelligence layer grows at 10.56 per cent while the equipment around it grows at 7.9.
Stage 7 is the prize and the reason the rest of the chain is tolerable. A maintenance contract on a system of this scale begins at handover, is priced before the first bag moves, runs five years with a five-year option, and is renewed by an organisation that has no appetite for re-tendering a system it did not build to a competitor who did. CPK’s structure — supply and installation in euros, operation and maintenance in zloty across two five-year periods — makes the annuity explicit and separates its currency exposure from the capital spend. Across the installed base, this stage is the most predictable revenue in the market and the one that makes an equipment margin of a few per cent worth accepting.
Stage 8 barely exists yet as a priced line, and that is the opportunity. Most airports own the data their system produces and use almost none of it: the scan events, the divert records, the jam logs, the connection outcomes. The vendors that will grow fastest in the second half of this decade are the ones that turn those records into an operational decision — which flight to hold, which bag to expedite, which belt to service before it fails. Carrying that as a subscription rather than as a feature of a maintenance contract is the only part of this chain where a new entrant can build a position without a reference airport and a balance sheet.
Investment Activity
What the public record shows about investment in this market is a small number of very large, very slow, heavily structured transactions, and a long tail of nothing visible at all. That shape is itself the finding: baggage systems are bought inside terminal programmes, so the market’s investment signal is a proxy for airport construction activity, lagged by the two to four years between a terminal commitment and a baggage order.
| Date | Airport or party | What was transacted | Value | Why it matters |
|---|---|---|---|---|
| May 2025 | Changi Airport Group | Terminal 5 substructure and airside infrastructure contracts | About SGD 4.75bn across two contracts | The largest greenfield passenger programme in the region; the baggage package follows the building |
| 2 May 2025 | Vanderlande / Siemens Logistics | Acquisition completed for the German headquarters and operations outside the US | Not disclosed | Consolidates two of the four credible global bidders into one supplier |
| July 2025 | Austin-Bergstrom International | Design-build award for an integrated baggage handling system, tied to a new arrivals and departures hall, Concourse B and a connecting tunnel | Not to exceed USD 320m, with 1,700 calendar days for substantial completion | Shows the North American pattern: the baggage system is a critical-path construction package, not a technology purchase |
| July to October 2025 | CPK Airport, Warsaw | Competitive dialogue concluded; BHS awarded to a Vanderlande consortium | EUR 115m net supply and installation; PLN 97m for the first five years of O&M, PLN 93m for the extension; total award PLN 1.88bn | The only large tender in the period where competing bids are public: EUR 115m against BEUMER’s EUR 198m |
| January 2026 | Changi Airport Group | Two autonomous tractors enter live service between Terminal 1 and Terminal 4 baggage areas; 24 planned by 2027 | Co-funded with the civil aviation authority | Autonomous airside baggage transport moves from trial to operations |
| March 2026 | Malta International Airport | Turnkey BHS award to Leonardo, 5,000 bags per hour with advanced reception and storage | Not disclosed; Leonardo’s 50th MBHS sorter | A mid-sized European airport replacing rather than expanding, inside a 2028 terminal programme |
Source: Pheonix Research compilation from airport procurement publications, official contract award notices, company announcements and operator press releases. No third-party market-research publication is used. Contract values are as disclosed by the buyer or seller and are not normalised to a common currency basis.
The structure of these transactions matters more than their values. Every large baggage award in the period follows the same shape: a competitive dialogue rather than an open tender, a qualification test based on a reference at a comparable airport, a price split between capital and a five-year service period, an option on a further five years, and an evaluation that weights risk allocation as heavily as price. CPK’s process ran from a market consultation in 2024 through nearly 300 questions answered during the dialogue to final bids in July 2025 and award on 30 October 2025. That is an eighteen-month procurement for a single system. A buyer cannot run that process often, and a vendor cannot afford to lose many of them.
Two structural facts about the money follow. First, the capital price in these deals is not a market price in any ordinary sense. The 72 per cent spread between two qualified bidders for the same scope means that what is being transacted is not equipment but a risk position, and the value of that position depends on what the buyer’s programme looks like and how much of the delivery risk the bidder is prepared to carry. Any model that infers a unit price per bags-per-hour from one award and applies it to another will be wrong by the width of that spread.
Second, the maintenance components are large enough to change the character of the sale. CPK’s ten-year service value, converted at the exchange rates implied by the tender documents, is a substantial fraction of the capital price — and unlike the capital price it is not really negotiable, because it reflects the real cost of staffing, spares and availability guarantees over a decade. A vendor that wins on capital price and loses the service contract has won a worse deal than it appears. This is why the same bidders who cut equipment margins defend service pricing, and why the operations and maintenance line in Table 2 grows at 9.97 per cent, faster than any equipment line except controls.
The wider capital context sets the ceiling on all of it. ACI World’s historical data for 2015 to 2019 puts global airport capital expenditure at USD 7.83 per passenger a year, or roughly USD 63.8 billion annually across the industry, and its traffic forecasts imply a 4.1 per cent compound annual growth rate for passengers between 2025 and 2040. Baggage handling captures a single-digit percentage of that capital spend, but it captures it at the point where the programme risk is highest and the alternatives are fewest — a terminal without a working baggage system cannot open, and a terminal whose system is at capacity cannot grow. That is the investment case in one sentence, and it is why the market attracts long-duration capital even at 8 per cent growth.
Technology & Innovation
The technology in this market is not one thing, and the innovation is not where the marketing puts it. There are three distinct layers of technology, each with a different adoption curve. The conveyance layer is mature and improving incrementally. The identification layer is in the middle of a genuine step change, from barcodes read at fixed points to continuous capture. And the handling layer at either end of the system — induction, container build, loading — is where the robots have arrived, not yet as specified equipment but as live trials that are being watched closely by everyone who has to staff a bag hall at 4am.
| Technology | What it does | Maturity | Routinely specified today? | Commercial effect |
|---|---|---|---|---|
| Belt and queue conveyors | Moves bags between fixed points | Mature | Yes, but losing share on new build | Volume business at thin margin; the installed base that everything else attaches to |
| Tilt-tray sortation | Sorts by tilting the tray at the destination chute | Mature | Yes, for high-rate sortation | Well understood, heavily competed, price-sensitive |
| Cross-belt sortation | Sorts by a belt on each carrier; gentler on bags, higher density | Mature to growth | Yes, particularly in Europe and Asia | Where Leonardo’s 50th sorter sale landed; a differentiator for mid-tier integrators |
| Individual carrier systems | Every bag in its own tray, tracked continuously | Growth | Increasingly the default on new build | Higher cost per metre, full traceability; the basis of the 100 per cent tracking claim at CPK |
| Early bag storage and high-density shuttle stores | Buffers bags before make-up; sequences release | Growth | Yes at hubs; spreading to mid-size | Converts the bag hall from first-in-first-out to a scheduled process |
| Explosive detection and CT screening | Screens hold baggage in line at certified standard | Mature, compliance-driven | Yes, mandatory | A dated replacement cycle rather than a growth market |
| RFID and optical capture | Reads tags automatically without a fixed scan point | Growth | Increasingly | Raises read rates where barcodes fail; a precondition for continuous tracking claims |
| Computer vision and bag biometrics | Identifies a bag from camera analytics rather than a scan event | Early commercial | Rarely, but rising | Allows exception handling without manual reading; a software sale, not a hardware one |
| Modern Baggage Messaging v2 | Standardises the data exchanged between carriers and handlers | Emerging standard | Being adopted through 2026 and beyond | Expected to cut mishandling a further 5 per cent on its own |
| Robot loading and unloading | Loads unit load devices and carts without a handler | Pilot to early installation | No | Attacks the largest remaining labour cost; Avinor installing with BEUMER |
| Autonomous airside tractors | Moves bags between terminals and stands without a driver | Early commercial | No | Changi live since January 2026; a fleet of 24 planned by 2027 |
| Electronic bag tags and connected bags | Replaces the printed tag with a device that can be updated | Growth | No, but adopted by airlines | Enables re-flighting without retagging; 38 per cent of passengers already see value in it |
| Predictive maintenance and decision support | Uses system data to act before failure | Pilot | Rarely | The least-priced stage of the value chain and the most defensible subscription |
Source: Pheonix Research assessment from vendor technical disclosures, airport and airline statements, tender specifications and the published proceedings of the industry’s baggage innovation forum. Maturity ratings are Pheonix judgements. No third-party market-research publication is used.
The single most consequential technology decision an airport makes is whether the system is belt-based or tray-based. An individual carrier system costs more per metre, occupies more space and requires more maintenance, and in exchange it delivers a continuous, per-bag record — which is why CPK can state that its system will guarantee 100 per cent tracking and sorting accuracy. That claim is not a software feature bolted onto conveyor. It is a consequence of the physical format: a bag in its own tray cannot be lost inside the system, because the tray is the tracking unit. As the intelligence layer’s value comes to depend on the quality of the underlying record, the tray becomes the enabler of the software market rather than a competitor to it.
The second decision is whether early bag storage is sized for connections or for operating flexibility. The industry has begun to talk about the bag store as something more than a place to park a bag that arrived too early. In the operational view heard most often in 2026, a high-density shuttle store borrowed from warehousing allows an airport to reduce make-up windows, batch-build containers for a flight rather than feeding bags to it one at a time, and buffer against late arrivals without holding an aircraft. BEUMER has begun describing the destination of all this as “the baggage factory” and notes that airports of all sizes are adopting batch-build processes to cut both footprint and staffing. If that becomes standard, the storage line grows faster than the sortation it supports.
The identification layer is where the measurable gains are, and they are measurable because the industry publishes the baseline. SITA’s figures show the mishandling rate falling from 18.9 per 1,000 passengers in 2007 to 6.3 in 2024 while passenger numbers more than doubled — a 67 per cent improvement in the rate on a 114 per cent increase in volume. That is the return on two decades of investment in tracking, and it is the strongest evidence in the sector that the intelligence layer delivers. The next increment is already identified: Modern Baggage Messaging version 2, approved in 2025, is expected on its own to cut mishandling by a further 5 per cent, because most transfer failures are data failures rather than mechanical ones.
The robotics story is real but earlier than the conference circuit suggests. Avinor’s robot loading project with BEUMER and AAT was installing in the new Oslo Terminal 1 sortation system at the start of 2026, with first live-bag test loading expected before summer; BEUMER’s own account is that the past two years have brought significant advances in gripper technology, vision systems and AI that make loading unit load devices and carts practical rather than demonstrative. Changi’s autonomous tractors are in live service, two of them, moving bags between Terminal 1 and Terminal 4, with 24 planned by 2027 and a remote operator supervising from a control room. None of this is yet written into a specification as a requirement, which is the distinction that matters commercially: an airport will pay for a proven system with a reference, not for a pilot that might become one.
Two risks sit underneath the technology story. The first is cyber. Baggage systems are now interconnected, data-rich and increasingly interfacing with cloud services, mobile applications and AI platforms, and the industry has begun to treat security as a design requirement rather than an afterthought. A baggage system that can be remotely interrogated is a baggage system that can be remotely interfered with, and the operational consequence of a halted sortation is an airport that stops. The second is that the data these systems generate is only useful if someone acts on it. The gap between an airport that owns its scan records and an airport that uses them to hold a flight is currently the widest competence gap in the market — and, for a vendor, the most attractive one to close.
Market Risk
This market is exposed to nine risks that transmit in different ways, and the one that matters most is not the one usually discussed. Baggage systems are not cyclical in demand — an airport with a full sorting hall has to buy — but they are extremely cyclical in timing, because every order is attached to a construction programme that can be deferred by a board decision two years before the system was due.
| Risk | How it transmits to revenue | Likelihood | Impact | What to watch |
|---|---|---|---|---|
| Greenfield programme slippage | Orders move with terminal opening dates; a slip moves revenue by years, not quarters | High | High | CPK’s opening moved to end-2032; Changi Terminal 5 phasing |
| Compliance cycle completion | Screening retrofit revenue is a step function that ends; replacement demand is a fraction of it | High, within the window | Medium | Screening grows 4.81% against 8.09% for conveyance — already in the numbers |
| Airline profitability and airport charges | Airports fund capital from charges; a sector earning below its cost of capital presses those charges | Medium | High | IATA’s 3.9% net margin and 6.8% ROIC against an 8.2% cost of capital in 2026 |
| Vendor concentration | Fewer qualified bidders means fewer, larger, riskier contracts and a thinner bench of alternatives for buyers | High, structural | Medium | The Siemens Logistics integration; whether a fourth global bidder emerges |
| Cyber and system integrity | A halted sortation stops an airport; remediation is unbudgeted and immediate | Medium | High | Cyber being written into BHS design requirements and O&M contracts |
| Brownfield physical constraint | Systems that cannot fit inside an existing terminal are deferred, not redesigned | High | Medium | Baggage operations moving to adjacent stand-alone buildings |
| Operational failure and reputational cost | Mishandling costs the industry USD 5bn a year, USD 149.70 per bag; the cost lands on airlines and is pursued back to operators | Medium | Medium | Transfer mishandling at 41% of the total |
| Currency and tariff exposure | Equipment is priced in euros or dollars, maintenance in local currency, over a decade | Medium | Medium | CPK’s euro capital price against zloty service periods is the template |
| Model and definition risk | A wider definition of the market — including labour and airline recovery — would change every share in this report | Certain | Low to the direction, high to the level | Section 3’s boundary statement |
Source: Pheonix Research assessment. Likelihood and impact are Pheonix judgements expressed for a 2026 to 2033 horizon. No third-party market-research publication is used.
The slippage risk deserves more than a row in a table. CPK’s baggage system was awarded in October 2025 for an airport that is now expected to open at the end of 2032, with construction of the passenger terminal beginning in 2026. Seven years sit between the order and the first passenger. That is normal in this market, and it means the revenue a vendor books in a given year is a function of decisions taken most of a decade earlier — decisions that can be revisited for reasons entirely unconnected to baggage. A forecast built on announced programme dates is therefore a forecast built on the least reliable input available, which is why this report models the market on installed-base replacement and compliance cycles as well as on announced greenfield capacity.
The second risk that deserves expansion is the compliance cliff, because it is the one most likely to be misread as a growth failure. Hold baggage screening integration grows at 4.81 per cent across the forecast, well below the market, and the reason is that a standard is a fixed quantity with a date. The European retrofit wave has been running for most of a decade; the machines are installed, the halls are rebuilt, and what remains is replacement at end of life plus the capacity growth that additional traffic requires. An investor looking at the screening line in 2021 would have seen a growth market. An investor looking at it in 2029 will see a replacement market. Both readings would have been correct for their moment, which is why the forecast has to model the cycle rather than extrapolate the peak.
The third is the one that sits behind all the others: airports are capital-constrained in a way that is easy to forget when reading contract values. A single baggage system at a large airport is a EUR 100 to 200 million package inside a terminal programme that may be ten times that. The baggage package is rarely the item cut, because a terminal cannot open without it — but it is frequently the item re-phased, because it is the item whose delivery date can move without a visible effect on the building. That is the mechanism by which a market with structurally firm demand still produces weak years: not fewer buyers, but later ones.
There is also a definitional risk that belongs in this register rather than in a footnote. The market as defined here — systems, software, engineering and maintenance, excluding labour and airline recovery — is USD 7.42 billion in 2025. A broader definition that folds in ground-handling labour and recovery services would be several times that size, and would grow at a different rate, because labour grows with wages rather than with technology. Neither definition is wrong. They answer different questions. Every share, growth rate and comparison in this report is conditional on the narrower one, and a reader who substitutes a broader figure from another source will find that nothing reconciles.
Two mitigations run through the whole register. The first is the maintenance annuity, which converts a lumpy capital business into a recurring one and which now accounts for USD 720 million in 2025 rising to USD 1.54 billion in 2033. The second is geographic diversification: the regions in this market do not peak together, because their programmes are driven by different things — a compliance deadline in Europe, a terminal opening in Asia-Pacific, a concession commitment in Latin America. A vendor with a presence in all three has a materially smoother revenue line than the market growth rate implies, and that, rather than technical superiority, is what the last two years of consolidation have been buying.
Regulatory Landscape
Four regimes govern this market and only one of them is about safety in the ordinary sense. The rest are about evidence: what an operator must be able to prove, to whom, and how quickly. That is why regulation is a revenue driver here rather than a cost of doing business — almost every obligation it creates is discharged by a system somebody has to buy.
| Instrument | Jurisdiction | What it requires | Commercial effect |
|---|---|---|---|
| IATA Resolution 753 | Global, binding on IATA member airlines | Tracking at four points — passenger handover, loading onto the aircraft, delivery to the transfer area, return to the passenger — plus sharing with interline partners | Creates a scanning, reconciliation and messaging requirement at every airport an airline serves; airports control most of the infrastructure that generates the record |
| Modern Baggage Messaging v2 (IATA) | Global | Standardised, richer exchange of baggage data between carriers, airports and handlers | A software upgrade cycle across the installed base; expected on its own to cut mishandling a further 5 per cent |
| Commission Implementing Regulation (EU) 2015/1998, point 12.11 | EU and EEA | Newly installed explosive detection systems must meet Standard 3, with earlier standards withdrawn on a timetable that varies by aerodrome category | The screening replacement cycle that shapes the 4.81 per cent line in Table 2; the standard is still being amended |
| ICAO Annex 17 and national civil aviation security programmes | Global, through national implementation | Screening of hold baggage as a baseline security measure | Universal mandate; the reason screening cannot be deferred in any market |
| National aviation security regimes, notably the United States | United States | Screening of all checked baggage, certified equipment and an approved airport security programme | Drives in-line explosive detection design and constrains how a terminal can be reconfigured |
| Montreal Convention 1999, Article 22(2) | More than 130 states party | Carrier liability for baggage limited to 1,288 Special Drawing Rights per passenger, as revised in the 2019 review | Prices the loss: it sets the ceiling on what an airline can be made to pay for a mishandled bag, and therefore what it will spend to prevent one |
| GDPR 2016/679 | EU and EEA | Lawful basis, minimisation and retention limits for biometric processing | Shapes how biometric bag drop can be designed and what data can be retained |
| Accessibility law — the European Accessibility Act and the ADA Standards | EU and United States | Accessible design of self-service and passenger-facing equipment | Constrains bag drop hardware design and height, and adds cost to retrofit |
Source: the instruments themselves as published by IATA, ICAO, the Official Journal of the European Union and national authorities. Dates and thresholds are as stated in the source instruments. No third-party market-research publication is used.
Resolution 753 is the most commercially important of the eight, and the least appreciated. It obliges airlines to be able to produce a verifiable record of custody at four points, and to share that record with interline partners. Airlines do not own the infrastructure that generates it. The airport owns the baggage handling system, the reconciliation system, the sortation controls and the arrival scanning facilities, and the ground handler operates them. IATA is explicit that airports are central to compliance and has published an implementation guide with ACI World for that reason. The consequence is a market in which a regulatory obligation on one party is discharged by capital spend at another — an unusually durable arrangement, because the party that must comply cannot substitute its way out of it.
IATA is equally explicit that adoption has been uneven, and attributes the variation to infrastructure maturity, technological readiness, investment constraints and inconsistent capability across airports. That is the honest description of a standard that is mandatory on paper and partial in practice. It also explains why the tracking line in this report keeps growing: an obligation that is only partly met is an obligation with remaining demand behind it, and every airport that installs the scan points, the reconciliation layer and the messaging gateway is buying a share of a market that will not close itself for years.
The European screening regime is the opposite case: a standard that has been driven to completion. EU regulation 2015/1998 requires that newly installed explosive detection systems meet Standard 3, and sets out a timetable by which earlier-standard machines must leave service, differentiated by aerodrome category and by when the equipment was installed. The timetable has been extended repeatedly for machines installed in particular windows, which is normal for a rule of this kind and is why the retrofit wave has taken a decade rather than three years. The regulation is also still live: the consolidated text shows amendments through 2025 and into February 2026, and the screening requirements have been amended more than twenty times since 2015. A vendor’s product roadmap in this segment is written against a moving document, and a buyer’s replacement date is a legal date rather than an engineering preference.
The Montreal Convention does something different and more subtle. By capping carrier liability for baggage at 1,288 Special Drawing Rights per passenger — revised at the 2019 review from 1,131 — it fixes the price of getting it wrong. That ceiling sits behind every airline’s decision about how much to invest in tracking, and it explains the shape of the industry’s spending: generous spending on systems that reduce the frequency of mishandling, much more cautious spending on systems that improve the experience of a bag already lost. The Convention is why the economics of prevention look better than the economics of recovery, and why the intelligence layer has a business case that the recovery layer does not.
Two newer regimes will shape design rather than spend. The data protection rules applying to biometric bag drop determine what can be captured, how long it can be kept and what the passenger must be told — and biometric self-service bag drop is exactly what 65 per cent of airports say they intend to roll out by 2027, so the constraint will bind on a large programme rather than a niche one. Accessibility law does the same for hardware: a self-service bag drop designed without reference to reach, height and interface standards has to be retrofitted, and retrofit inside a terminal is more expensive than design. Neither regime will move the market’s value. Both will decide which suppliers’ products can be sold into it.
Sources
SITA, Baggage IT Insights 2025, press release and report, Geneva, 12 June 2025 — sita.aero. IATA, Baggage Tracking and Resolution 753 — iata.org. IATA, Airline Profitability Stabilizes with 3.9% Net Margin Expected in 2026, 9 December 2025 — iata.org. ACI World, airport capital expenditure and traffic forecasts — blog.aci.aero.
Port Polska / CPK, Baggage Handling System: CPK opens bids in tender process, 1 July 2025 — portpolska.pl; and CPK awards contract for Baggage Handling System, 22 September 2025 — portpolska.pl. Vanderlande, Vanderlande awarded baggage handling system contract for new CPK Airport in Warsaw, 30 October 2025 — vanderlande.com; and Vanderlande completes acquisition of Siemens Logistics in Europe, Asia and Middle East, 2 May 2025 — vanderlande.com.
City of Austin, Recommendation for Action, file 25-1288: Integrated Baggage Handling System, Austin-Bergstrom International Airport, July 2025 — austintexas.gov. Changi Airport Group, Award of Terminal 5 contracts 2025 — changiairport.com; and CNA, Changi Airport deploys driverless tractors for baggage transfer after successful trials, 20 January 2026 — channelnewsasia.com. Leonardo, New contract for the automation of Malta Airport, 9 March 2026 — leonardo.com. Daifuku, Consolidated Financial Results, fiscal year ended 31 December 2025, 12 February 2026 — daifuku.com.
ICAO, 2019 Revised Limits of Liability Under the Montreal Convention of 1999 — icao.int. Commission Implementing Regulation (EU) 2015/1998, consolidated text as amended — eur-lex.europa.eu. Future Travel Experience, Top baggage trends to watch in 2026, January 2026 — futuretravelexperience.com.
No third-party market-research publication is cited anywhere in this report. Figures that are Pheonix estimates rather than disclosed values are labelled as such at the point of use: the gross market value, the baggage-item count, spend per item, the product-line split, the layer split and the regional split are all constructed here.