
Global Non-Destructive Testing Equipment Market Report, Size, Share and Forecast 2026–2033: Sixty-Two Per Cent of the Growth Is Not More Inspection
The global market for non-destructive testing equipment is USD 14,600 million in 2025 and reaches USD 23,390 million in 2033, a compound annual growth rate of 6.07 per cent. That is a deliberately unremarkable headline attached to a set of findings that are not.
The first is arithmetic. The market adds USD 8,790 million over the forecast window. Of that increment, USD 3,329 million — 37.9 per cent — comes from placing more instruments. The remaining USD 5,461 million, or 62.1 per cent, is price and mix. Instruments placed rise from 1.02 million to 1.25 million a year at 2.60 per cent while realised spend per instrument rises from USD 14,384 to USD 18,766 at 3.38 per cent. Roughly three dollars of every five this market adds over eight years is not one extra inspection. Any supplier whose plan assumes volume-led recovery is planning against the arithmetic.
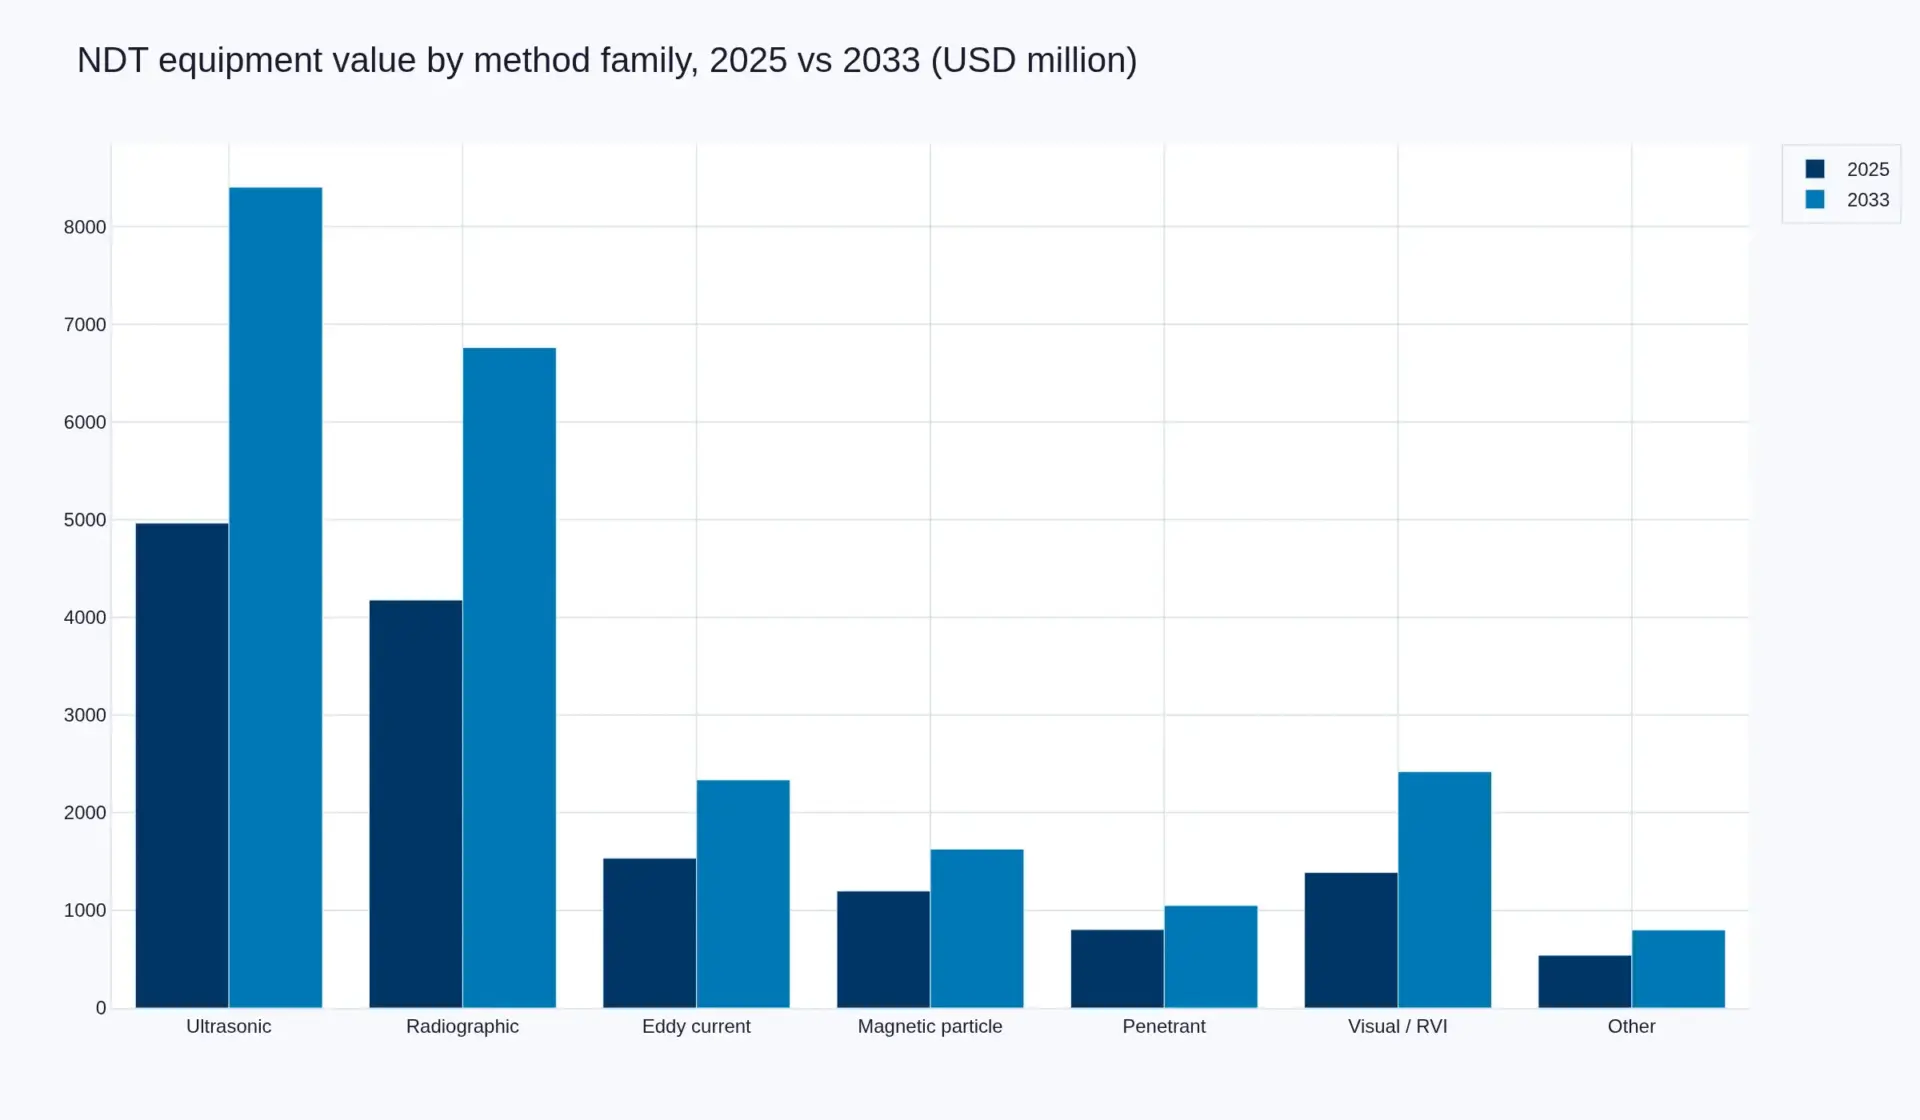
The second is that the increment is unusually concentrated. Ultrasonic and radiographic testing together are 62.6 per cent of 2025 value and 68.5 per cent of the increment. Ultrasonic alone is 34.0 per cent of the market and 39.1 per cent of the growth. Visual and remote visual inspection — the cheapest, least capital-intensive method family — is the fastest grower at 7.20 per cent and takes 11.7 per cent of the increment on 9.5 per cent of the base. Everything else is drifting.
The third is the one we would lead with commercially. Magnetic particle and penetrant testing fall from 13.7 per cent of the market to 11.4 per cent, and they are the two slowest-growing method families at 3.90 and 3.40 per cent. These are the consumable-and-technique methods: they depend on an operator's hand, on a bottle of ink or a bag of powder, and on a judgement that leaves no digital record. They are not disappearing, and both grow in absolute terms. They are being progressively outgrown by every method that produces a stored image. The direction of that drift is the same one visible in the cluster's radiography and ultrasonic reports, and it is the single most reliable structural signal in this market.
Read together, these three facts describe a replacement market, not an installation market. Instruments are not bought because a new plant was built. They are bought because an inspection code revision changed a method from permitted to required, because an ageing fleet of flaw detectors reached end of service, or because the labour to run the old method stopped being available. That is why 62 per cent of the growth is price: the buyer is not adding capability, they are replacing it under constraint, and constrained buyers accept price.
The risk attached to that structure is the reverse of the opportunity. A market whose growth leans on realisation is a market whose growth can be removed by realisation. If price and mix growth converges toward the 2.60 per cent volume rate, the 2033 figure is not USD 23,390 million — it is nearer USD 18,000 million, on an identical story about inspection demand. Our conservative scenario at 4.89 per cent puts 2033 at USD 21,400 million; the optimistic at 7.11 per cent puts it at USD 25,300 million. The spread between them is not a demand forecast. It is a price forecast.
1. What this report measures, and what it deliberately does not
This is the umbrella report for the Test, Measurement and Inspection cluster. It sizes the global market for non-destructive testing hardware: the instruments, systems, radiation sources, probes and panels that let an inspector establish whether a component is sound without destroying it. Seven method families are covered across 2025 to 2033.
In scope. Instruments and systems, plus the media and consumables they consume in use — film and chemistry, transducers and wedges, couplants, penetrant materials, magnetic particles — because those are sold through the same channel and often on the same order as the instrument.
Out of scope. Third-party inspection service labour. That is a services market with a cost structure built on billable technician hours and a buyer who is procuring compliance rather than capability. It is adjacent to this market and frequently mistaken for it. Medical imaging is excluded. Leak testing is sized separately in our leak detection report, which is linked from this page.
The cluster rule: do not add these reports together
This report is the sum of the cluster. The two reports built underneath it are decompositions of slices of this total, not additions to it.
- Radiographic testing is 28.6 per cent of 2025 value, or USD 4,176 million. It is decomposed in full — by technique (film, computed radiography, digital detector array), by end market and by region — in our industrial radiography and digital X-ray inspection report. That report’s USD 4,180 million base and USD 6,760 million forecast are the same field as the row in the table below, rounded.
- Ultrasonic testing is 34.0 per cent of 2025 value, or USD 4,964 million. It is decomposed by technique in our ultrasonic NDT report on the same field.
Adding the umbrella to its spokes double-counts both. The umbrella is where the shares come from. The spokes are where the mechanics come from. If you need a total for the cluster, use this report and nothing else.
The three findings that carry this report
1. Three dollars in five of the growth is not more inspection. The market adds USD 8,790 million by 2033. USD 3,329 million of that is more instruments. USD 5,461 million — 62.1 per cent — is price and mix. Instruments placed grow 2.60 per cent; realised spend per instrument grows 3.38 per cent.
2. Two methods carry two thirds of it. Ultrasonic and radiographic testing are 62.6 per cent of 2025 value and 68.5 per cent of the increment. Ultrasonic is the swing: 34.0 per cent of the market, 39.1 per cent of the growth.
3. The methods that leave no digital record are the ones losing share. Magnetic particle and penetrant testing fall from 13.7 per cent to 11.4 per cent of the market. Both still grow in absolute terms. Both grow slower than everything that stores an image.
Together these describe a replacement market. Instruments are not bought because a plant was built; they are bought because a code revision made a method mandatory, because a fleet of flaw detectors aged out, or because the technician who ran the old method retired. That is the mechanism behind the 62.1 per cent, and it is why the buyer in this market accepts price.
2. Market size, forecast, and the volume-price split
The model is units multiplied by realised spend.
- Instruments placed: 1,015,000 in 2025 rising to 1,246,400 in 2033, a CAGR of 2.60 per cent.
- Realised spend per instrument: USD 14,384 in 2025 rising to USD 18,766 in 2033, a CAGR of 3.38 per cent.
- Market value: USD 14,600 million to USD 23,390 million, a CAGR of 6.07 per cent.
An “instrument placed” is a discrete sellable unit: a flaw detector, a thickness gauge, an eddy current instrument, an X-ray generator, a detector panel, a magnetic particle bench, a penetrant line, an automated inspection cell counted once. This denominator is our own construct. No published source reports NDT unit shipments in a form that reconciles to value, so we built one and we publish it here so the assumption can be challenged independently of the conclusion.
Method families, 2025 to 2033
| Method family | 2025 (USD m) | Share 2025 | 2033 (USD m) | Share 2033 | CAGR | Increment | Share of increment |
|---|---|---|---|---|---|---|---|
| Ultrasonic (UT) | 4,964 | 34.0% | 8,403 | 35.9% | 6.80% | 3,439 | 39.1% |
| Radiographic (RT) | 4,176 | 28.6% | 6,760 | 28.9% | 6.19% | 2,584 | 29.4% |
| Eddy current (ET) | 1,533 | 10.5% | 2,335 | 10.0% | 5.40% | 802 | 9.1% |
| Magnetic particle (MT) | 1,197 | 8.2% | 1,626 | 7.0% | 3.90% | 429 | 4.9% |
| Penetrant (PT) | 803 | 5.5% | 1,049 | 4.5% | 3.40% | 246 | 2.8% |
| Visual and remote visual (VT/RVI) | 1,387 | 9.5% | 2,419 | 10.3% | 7.20% | 1,032 | 11.7% |
| Acoustic emission, thermography and other | 540 | 3.7% | 798 | 3.4% | 5.00% | 258 | 2.9% |
| Total | 14,600 | 100.0% | 23,390 | 100.0% | 6.07% | 8,790 | 100.0% |
The spread between the fastest and slowest method family is 3.80 percentage points of compound growth. That sounds modest until it compounds over eight years across a base that differs by an order of magnitude. Penetrant testing at 3.40 per cent and visual inspection at 7.20 per cent do not converge; they diverge by a factor of nearly two in absolute dollars added.
Where the USD 8,790 million comes from
| Component | USD m | Share of increment |
|---|---|---|
| 2025 market value | 14,600 | — |
| Volume effect: 231,400 additional instruments × USD 14,384 | +3,329 | 37.9% |
| Price and mix effect | +5,461 | 62.1% |
| 2033 market value | 23,390 | 100.0% |
The mix component inside that 62.1 per cent is not incidental. It is the within-total effect of the shift in the table above: more ultrasonic and remote visual per dollar of inspection, less magnetic particle and penetrant. Part of what looks like price is the market quietly buying a different basket.
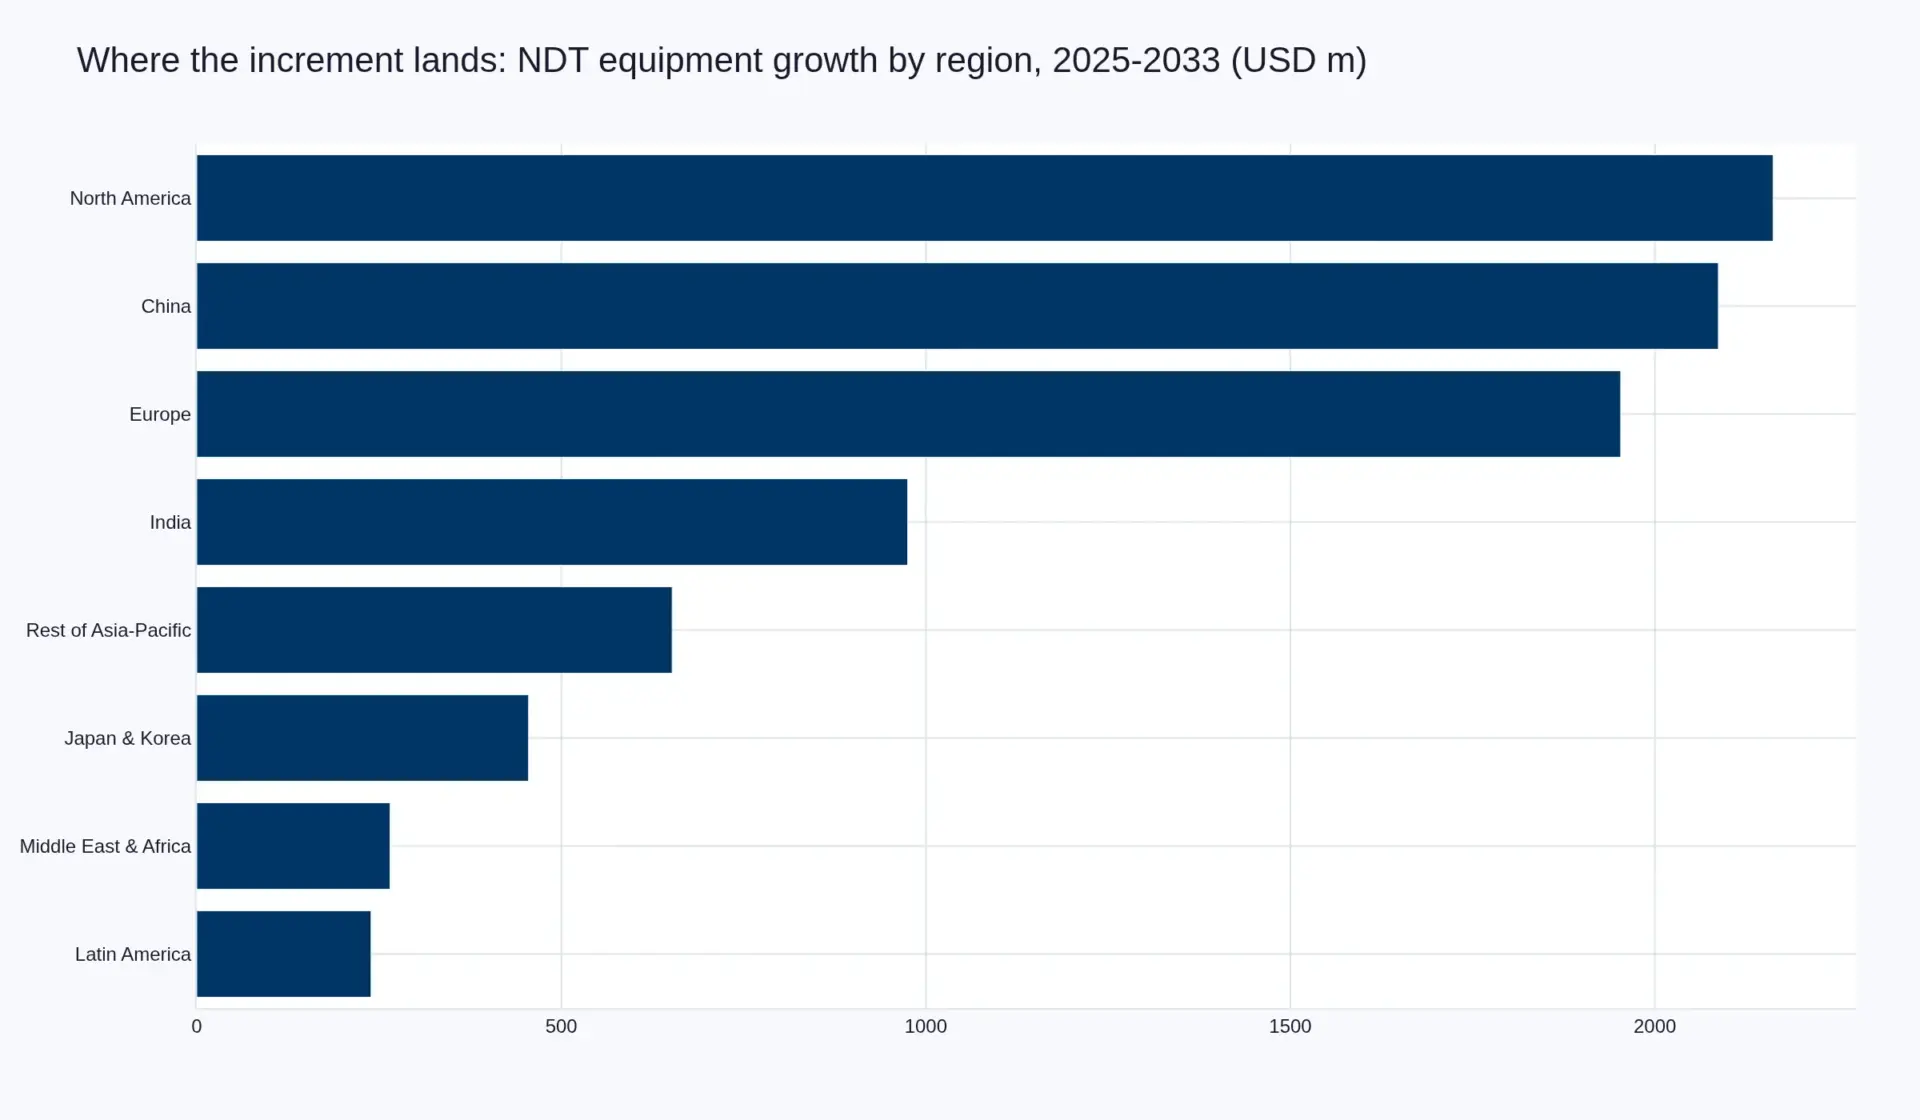
Regional structure
| Region | 2025 (USD m) | Share | 2033 (USD m) | Share | CAGR | Share of increment |
|---|---|---|---|---|---|---|
| Europe | 4,453 | 30.5% | 6,406 | 27.4% | 4.65% | 22.2% |
| North America | 4,088 | 28.0% | 6,250 | 26.7% | 5.45% | 24.6% |
| China | 2,555 | 17.5% | 4,642 | 19.8% | 7.75% | 23.8% |
| India | 803 | 5.5% | 1,778 | 7.6% | 10.45% | 11.1% |
| Japan and Korea | 1,168 | 8.0% | 1,623 | 6.9% | 4.20% | 5.2% |
| Rest of Asia-Pacific | 730 | 5.0% | 1,382 | 5.9% | 8.30% | 7.4% |
| Latin America | 438 | 3.0% | 677 | 2.9% | 5.60% | 2.7% |
| Middle East and Africa | 365 | 2.5% | 630 | 2.7% | 7.05% | 3.0% |
| Total | 14,600 | 100.0% | 23,388 | 100.0% | 6.07% | 100.0% |
Regional components round to USD 23,388 million against a global total of USD 23,390 million; the difference is rounding, not a reconciliation gap.
Europe and North America hold 58.5 per cent of 2025 value and take 46.8 per cent of the increment. Europe is the slowest large region at 4.65 per cent for a structural reason rather than a cyclical one: it has the densest installed base of mature conventional instruments in the world, and a dense installed base is a liability in a replacement market, because the replacement is already largely done.
Scenarios
| Scenario | 2033 (USD m) | CAGR | What has to be true |
|---|---|---|---|
| Conservative | 21,400 | 4.89% | Realisation growth converges toward the volume rate; instrument pricing flattening as Chinese and Indian supply moves up the specification range |
| Base | 23,390 | 6.07% | Realisation holds near 3.38%; method mix continues to shift toward ultrasonic and remote visual at the current pace |
| Optimistic | 25,300 | 7.11% | Inspection-labour shortage raises willingness to pay for automation and interpreted output; realisation accelerates rather than holding |
The conservative case is not a demand story. It is the same demand story with the price mechanism switched off, and it removes USD 2,000 million. That asymmetry — where the downside is a price effect and the upside is also a price effect — is the correct way to read the risk in this market, and it is why the risk chapter leads with realisation rather than with volumes.
Articles on this market
- Magnetic Particle and Penetrant Are 13.7 Per Cent of This Market and Falling. Both Still Grow.
- Visual Inspection Is the Cheapest Method in Non-Destructive Testing. It Is Also the Fastest Growing.
Teledyne Technologies, one of the two largest participants in this market, is profiled in the Pheonix graph: Teledyne Technologies Incorporated.
Table of Contents
- What this report measures, and what it deliberately does not
- Market size, forecast, and the volume-price split
- Value chain: where the margin sits
- Technology and the shift from sensing to interpreting
- Competitive landscape
- Regulatory landscape: the code sets the equipment
- Investment activity
- Market risk and scenarios
Competitive Landscape
5. Competitive landscape
This is a fragmented market and it is fragmented for a reason that will not go away: NDT is not one technology sold to one buyer, it is ten technologies sold into a dozen end markets under a hundred national code regimes. Scale advantages exist at the component layer and at the channel layer, but rarely across the whole of a method family.
Our estimate: the eight largest suppliers account for roughly 30 to 35 per cent of equipment and media value. We label that as our own estimate rather than a measured figure, because the denominator is not observable — a meaningful share of this market is sold by regional distributors, national champions in China and India, and in-house instrument groups inside inspection service companies, none of which report units in a form that can be aggregated. Anyone quoting a precise concentration ratio for this market is quoting an assumption.
The shape of the field
- Teledyne Technologies — the broadest front-end position in radiographic NDT: X-ray generators through Teledyne ICM, X-ray detectors through Teledyne DALSA, and a pending acquisition of Varex Imaging that would add X-ray tubes and photon-counting detectors. It owns the source, the panel and the readout, which is the strongest structural position in the radiographic chain.
- Waygate Technologies, within Baker Hughes — radiographic and ultrasonic inspection, industrial radiography and computed tomography, with particular depth in aerospace and additive manufacturing.
- Evident — the former scientific solutions business of Olympus, and the largest single position in ultrasonic instrumentation, including phased array and remote visual inspection.
- Mistras Group — unusual in this field in being primarily a services business that also manufactures instruments, which gives it visibility into how its own equipment performs on live inspection jobs.
- Eddyfi and the Previan group — concentrated in eddy current and advanced ultrasonic, with a portfolio assembled by acquisition.
- Comet — X-ray sources and components, a pure front-end play.
- Shimadzu and Fujifilm — Japanese positions spanning radiographic imaging, computed tomography and, in Fujifilm’s case, a deliberate strategy of absorbing the film-to-digital transition rather than resisting it.
- Sonatest, Zetec and a long tail of national specialists — ultrasonic and eddy current instruments sold on service depth and code familiarity rather than scale.
How competition actually works
On the front end, by capability. Detector quantum efficiency, tube focal-spot size and heat dissipation, transducer bandwidth. These are engineering contests with real barriers, and they determine who can serve which application at all.
On the instrument, by price. This is where the market is most competitive and least differentiated, and where Chinese and Indian manufacturers have moved furthest up the specification range. A mid-range conventional ultrasonic flaw detector is now a genuinely contested product on price, and the direction of that pressure is the single most credible route to our conservative scenario.
On the code, by incumbency. A technique written into a customer’s written practice, or into a national annex, is extremely hard to displace, because displacing it means re-qualifying a procedure rather than beating a specification. Suppliers invest in code committee work for this reason and it is invisible in any financial statement.
On the channel, by geography. In most of the world the sale is made by a distributor who also sells consumables, calibration and training. That local presence is expensive to build and is why a globally sub-scale national champion can hold a domestic market against a larger competitor.
Value Chain
3. Value chain: where the margin sits
An NDT instrument is four businesses wearing one enclosure.
The front end. Piezoelectric ceramics and composite transducer elements for ultrasonic; X-ray tubes and flat-panel detector arrays with their scintillator layers for radiographic; coil and magnet assemblies for eddy current. This is where the physics is, where the patents cluster, and where an OEM either controls its cost base or does not. A supplier that buys its detectors has a cost line it cannot negotiate; a supplier that makes them has a margin its competitors cannot reach. That asymmetry explains almost every acquisition in this market.
The instrument. Electronics, packaging, firmware, ingress protection, battery life, ergonomics. It is genuinely hard to do well and it is no longer hard to do. Assembly has commoditised faster than any other layer, which is why instrument OEMs with no front-end capability have seen gross margin compress while the market’s realised spend per instrument rose 3.38 per cent a year. Both things are true at once: the market paid more, and the assemblers captured less of it.
The interpretation layer. Software: acquisition parameters, imaging, encoded scanning, and increasingly automated defect recognition. This is where the incremental dollar is migrating, and it is the only layer with software economics — near-zero marginal cost, licence or subscription revenue, and no factory.
Delivery and integration. Automated inspection cells, robotic manipulators, scanners, system integration and commissioning. High value per project, low margin, and unavoidable at the top of the market: no refinery buys a scanner, it buys a working inspection system.
The recurring layer nobody sells as a product. Reference and calibration blocks, certified probes, couplant, film and chemistry, detector recalibration, and the periodic re-certification of personnel under ISO 9712. It is the least visible and most defensible revenue in the chain, because it is specified by the same code that specifies the method. A reference block is a piece of steel with a known flaw in it; it costs almost nothing to make, it must be bought from an accredited supplier, and it must be replaced on a schedule. That is the business model the sector talks about least.
Who actually buys
Three buyers, with different economics. The asset operator — a refinery, an airline, a utility, a pipeline company — buys against a code obligation with a hard inspection interval attached, and is relatively price-insensitive because the cost of non-compliance is an outage or a licence condition. The inspection service company buys instruments as production equipment and is acutely price-sensitive, because the instrument’s cost is amortised across billable technician hours. The manufacturer buys at the end of a production line, where the instrument’s justification is scrap rate and throughput rather than compliance, and where the buyer is a quality engineer with a capital budget. The mix of those three, by method family, is what actually determines realised spend per instrument — and it is the reason the market can grow 6.07 per cent while placing only 2.60 per cent more units.
Investment Activity
7. Investment activity
This market generates more cash than it consumes, and that single fact explains its consolidation pattern better than any strategic narrative.
Teledyne Technologies reported full-year 2025 net sales of USD 6,115.4 million, up 7.9 per cent, with free cash flow of USD 1,074.0 million and capital expenditure of USD 117.3 million. Capital expenditure was 1.9 per cent of sales. The company deployed approximately USD 850 million on acquisitions in 2025 and ended the year with net debt of USD 2,123.0 million and a quarter-end consolidated leverage ratio of 1.4x. The pattern is unambiguous: an instrument business converts a small fraction of revenue into fixed assets and a large fraction into free cash, and the only place to put that cash is more instruments.
The logic is vertical, not horizontal
The acquisitions that matter in this market are not competitors being rolled up for scale. They are layers of the chain being brought inside. Teledyne’s agreement on 10 August 2026 to acquire Varex Imaging for USD 18.90 per share in cash, at approximately USD 1.1 billion aggregate value, is the clearest example. Teledyne already made X-ray generators and X-ray detectors; Varex brings X-ray tubes, flat-panel detectors for inspection, and photon-counting detectors. Varex stockholders adopted the merger agreement on 28 October 2026, regulatory clearance remains outstanding, and closing is anticipated in early 2027. On completion a single supplier owns source, tube, panel and readout in radiographic NDT — a position no competitor can replicate by purchasing one company.
The same logic runs smaller and quieter across the field: Baker Hughes holds Waygate Technologies inside an energy technology portfolio for much the same reason, Eddyfi’s parent assembled eddy current and advanced ultrasonic capability by acquisition, and Comet sells sources and components to competitors rather than competing with them at the instrument layer.
What buyers are actually paying for
Three things, in descending order of price paid. Front-end capability — a tube, panel or transducer design that cannot be engineered around. Certified installed base — a population of instruments in the field on calibration and consumable contracts, which is durable revenue attached to a code-mandated replacement cycle. Channel — a distributor network in a geography where the alternative is building one. Instrument assembly on its own is not worth acquiring, and increasingly is not worth owning.
The sponsor question
The consumable and calibration layer plus code-mandated replacement cycles is exactly the revenue shape that supports levered structures, and the sector has attracted sponsor ownership in the mid-market. The constraint is not cash flow; it is that the same front-end investment that creates the moat is a research and development line a leveraged owner tends to underfund, and the effect of that choice takes about a product cycle to appear in the specification data. We regard this as the most under-priced risk in the investment picture and we address it in the risk chapter.
Where capital is going next
Into the interpretation layer. Nothing in this market is currently valued more highly, relative to revenue, than a company that can demonstrate automated detection performance and a certification path for it. There is no code yet that says how an algorithm’s performance must be validated, and until there is, whoever writes the validation method owns the market’s next margin pool.
Technology & Innovation
4. Technology and the shift from sensing to interpreting
For thirty years the constraint in non-destructive testing was the sensor: could you generate a signal clean enough, from a source small enough, to find a flaw you could not see. That constraint has substantially dissolved. The constraint that replaced it is the human who interprets the result, and the technology now racing to remove that human is where the market’s pricing power has moved.
Ultrasonic: the compute story
Phased array ultrasonic testing — firing a multi-element probe in a programmed sequence to steer and focus a beam electronically — has moved from laboratory instrument to field-portable unit in under a decade, and the reason is arithmetic, not physics. Total focusing method, which synthetically focuses at every point in an inspected volume, is a brute-force computation: it needs the full matrix of transmit-receive signals and it needs them processed fast enough that an operator does not stand waiting. Falling compute cost per watt did that. The same collapse made real-time encoded inspection practical, which is what allows an ultrasonic result to be reconstructed as an image rather than a waveform — and an image is a record.
Adjacent techniques are moving on their own logic. Electromagnetic acoustic transducers remove the couplant requirement, opening high-temperature and moving-component inspection. Guided wave travels tens of metres along a pipe from a single ring of transducers, which converts a scaffold-and-insulation job into a screening exercise. Air-coupled ultrasonic removes contact altogether. None of these is new; all of them were, until recently, too expensive or too fragile to sell.
Radiographic: the panel story
The digital detector array replaced film because film became hard to buy, not because the image became better. That is the central finding of this cluster’s radiography report and it holds here: the conversion is supply-driven. What is new on the technology side is panel economics and readout architecture. Amorphous silicon panels are the volume product; IGZO panels offer higher fill factor and better performance at low dose; CMOS panels offer speed and resolution for computed tomography. Photon counting, now entering industrial use from medical imaging, produces a spectrum rather than an integrated intensity, which allows material discrimination rather than mere attenuation contrast.
The interpretation layer, and the trap in it
Automated defect recognition — machine learning applied to the acquired image or waveform — is the single most consequential technology in this market, and it is a double-edged one for the people selling it.
The case for it is overwhelming and is made by the workforce data in the risk chapter. Crude but honest: if 61 per cent of a specialist inspection workforce leaves within sixteen years and there is nobody behind them, the only way the inspection gets done is with fewer people doing more per hour. That is precisely what ADR promises — consistent detection at a rate a human cannot sustain, with a stored audit trail.
The trap is that ADR removes the labour content that currently justifies premium pricing. A system that halves the time per inspection is worth more to the buyer, but it also collapses the billable-hour base on which service companies amortise equipment, and it transfers the value from the instrument to the algorithm. The suppliers who will capture that value are the ones who own the training data and the certification of the algorithm’s performance — which is a regulatory problem before it is a technical one, and which no code yet addresses. This is the mechanism that could move the 3.38 per cent realisation rate in either direction, and it is unresolved in every jurisdiction we examined.
Delivery
The unglamorous frontier is getting the sensor to the defect. Crawlers, drones, magnetic wall-climbers, robotic arms and encoded manipulators do not change what can be detected; they change the cost of access, which in oil and gas, power generation and marine inspection is frequently the largest single line in the job. This is where the market’s capital intensity actually sits, and it is why instrument companies increasingly sell cells and systems rather than boxes.
Market Risk
8. Market risk and scenarios
Six risks, ordered by what we think the probability-weighted cost is rather than by how often they are discussed.
1. Realisation dependence — the dominant risk
62.1 per cent of the forecast growth is price and mix. That is not a presentation choice; it is the model’s structure, and it means the forecast is far more sensitive to instrument pricing than to inspection volume. If realised spend per instrument grows at the volume rate of 2.60 per cent instead of 3.38 per cent, the 2033 market is nearer USD 18,000 million than USD 23,390 million — a USD 5,400 million revision with no change whatever to the underlying demand story. Our conservative scenario at 4.89 per cent captures a milder version of the same effect.
2. The labour constraint cuts both ways
The workforce data is stark. The ASNT Foundation’s 2025 Economic Impact of NDT report puts 42 per cent of the US NDT workforce at 45 or older. An EPRI survey of 82 nuclear NDE professionals found 37 per cent expected to retire by 2030 with a further 24 per cent within the following decade — 61 per cent within sixteen years — and 60 per cent of respondents said the industry would not have enough NDE personnel to meet future needs.
That is simultaneously the bull case and the bear case. It is the bull case because scarcity raises willingness to pay for anything that raises output per inspector, which is where the 3.38 per cent realisation growth and the optimistic scenario come from. It is the bear case because a market cannot place 2.60 per cent more instruments a year into a population of operators that is shrinking, unless those instruments are bought by the survivors. Both are live. The resolution depends on whether buyers treat automation as a substitute for people or as a tool for them.
3. Code inertia is protective and exclusionary
Because inspection methods are written into codes, a technique inside a code is defended from substitution almost perfectly. The reverse is equally true: a technique outside the codes cannot break in on merit, however good the physics. This protects incumbency and it caps the addressable market for every new method at whatever the code committees will admit. It also means the regulatory calendar, not the product roadmap, sets the timing of adoption.
4. Trade exposure and component concentration
We classify geopolitical exposure as high. Instruments are traded goods with components sourced across borders — scintillator materials, piezoelectric ceramics, rare earths in magnets, semiconductor readout — and radiation sources are subject to their own export-control regimes. A tariff or export-control change does not merely raise cost; it can make a product unsellable in a market overnight. The offset is that NDT equipment is small, high-value and frequently a compliance necessity, which makes it a low-priority target in a tariff schedule. That is protection by obscurity, not by design.
5. Method substitution and the automated-detection trap
Ultrasonic displacing radiographic in marginal applications for radiation-compliance cost reasons is a durable, one-directional pressure, and it works against the larger of the two method families in relative terms. Separately, automated defect recognition threatens the labour content that underpins premium equipment pricing. A technology that halves inspection time is worth more per system and destroys the billable-hour base on which the market’s realised spend per instrument depends.
6. Supply moving up the specification range
Chinese and Indian instrument manufacturers have closed the performance gap on conventional ultrasonic and eddy current instruments and are moving into phased array and digital radiography. A mid-range flaw detector is now genuinely contested on price. This is the most plausible single route to our conservative case, and it is already visible in transaction data rather than being a forecast.
Scenarios
| Scenario | 2033 (USD m) | CAGR | Driver |
|---|---|---|---|
| Conservative | 21,400 | 4.89% | Realisation converges to the volume rate; price pressure from local supply |
| Base | 23,390 | 6.07% | Realisation holds near 3.38%; mix continues toward ultrasonic and remote visual |
| Optimistic | 25,300 | 7.11% | Labour scarcity lifts willingness to pay for automation and interpreted output |
The spread is not a demand forecast. It is a price forecast. That is the correct way to read risk in a market where three dollars in five of the growth is not more inspection.
Regulatory Landscape
6. Regulatory landscape: the code sets the equipment
In most industrial markets, regulation constrains what a supplier may sell. In this one it does something stronger: it determines what a buyer is permitted to buy, how they must use it, and who is allowed to hold it.
The governing documents
- ASME BPVC Section V — Nondestructive Examination. The reference standard for NDE methods in pressure equipment and much else. The current edition is BPVC.V-2025. Notably, ASME currently lists Section V as being on stabilized maintenance — a status meaning the standard remains in effect but is no longer under active revision, with change requests considered rather than scheduled. That is a significant structural fact for this market: the governing NDE code is in a holding pattern, so the regulatory pressure that moves equipment demand is now coming from elsewhere.
- ISO 9712:2021 (Edition 5) — Qualification and certification of NDT personnel. Specifies requirements for certifying the people who perform industrial NDT, across acoustic emission, eddy current, leak, magnetic, penetrant, radiographic, strain gauge, thermographic, ultrasonic and visual testing. The standard explicitly excludes medical applications. It governs the labour supply, and therefore the cost of the inspection, and therefore the instrument’s business case.
- API 510, 570 and 653 — pressure vessel, piping and aboveground storage tank inspection codes that fix inspection intervals in oil and gas, and thereby fix a large share of the world’s routine inspection volume.
- ASME Section XI and 10 CFR 50 Appendix VIII — nuclear in-service inspection and the qualification of NDE systems for it, the most demanding performance-demonstration regime in the field.
- NADCAP and EN 4179 — aerospace accreditation and personnel qualification, which effectively control access to the aerospace inspection market.
- PED 2014/68/EU — European pressure equipment, which requires NDT of a defined scope on defined categories of equipment.
The asymmetric burden that shapes the market
Radiographic testing requires a radiation source, and every jurisdiction regulates ionising radiation separately from inspection codes. That means site licensing, controlled areas, dosimetry, qualified radiation protection supervision, source transport and, in many countries, a shrinking pool of people willing to hold the certification. Ultrasonic testing requires none of it.
Nothing in the inspection codes says ultrasonic should displace radiographic. But the total cost of compliance does, and it does so methodically: every revision of a radiation-safety regime that raises the administrative cost of holding a source tilts a marginal application from radiographic to ultrasonic, or from film to a digital panel that shortens exposure time and reduces the source’s working hours. This is the least discussed driver in the market and it is the one most likely to persist, because radiation-safety regimes tighten rather than loosen.
What to watch
Because ASME Section V is stabilized, the leading indicators for this cluster are no longer US code revisions. They are: national radiation-safety regimes; end-user operator specifications from the large asset owners, which frequently run ahead of code; ISO technical committee work on automated defect recognition performance, which is the missing piece in the interpretation layer; and any national requirement that moves a technique from “may” to “shall”. Each of those converts directly into equipment demand, and each is visible before the equipment is ordered.