
Press Release
Inoculants on 40 Per Cent of Brazil's Biological Area Earn R$10.4 a Hectare Against R$54.1 for Biofungicides — Adoption Grew 28 Per Cent and the Market Grew 15
Overview
Agricultural biologicals is the fastest-growing input category in agriculture and the least well measured. Published estimates for 2025 cluster between roughly USD 12 billion and USD 15 billion, on growth rates of 12 to 15 per cent a year. This report lands inside that size band and well below that growth rate: USD 13.45 billion in 2025 to USD 27.50 billion by 2033, a CAGR of 9.35 per cent.
The distance between those two positions is the entire argument. The published band extrapolates hectares treated. Hectares treated is not what this market is paid for, and there is now one dataset detailed enough to prove the difference.
Of the USD 14.05 billion this market adds across the eight years, 68 per cent is tonnage and 32 per cent is price and mix. Set that against the rest of this cluster and the inversion is stark. Corn seed is 24 per cent volume and 76 per cent price and technology. Crop protection is 46 per cent volume and 54 per cent price. Biologicals is the first input category examined in this programme where volume does most of the work — because the products are cheap per unit, because the cheapest of them is getting cheaper, and because the constraint on this market is not whether a grower will buy a biological but whether the biological will perform consistently enough to be bought again at a price that supports a formulation business.
| Market value, 2025 | USD 13.45 billion |
|---|---|
| Market value, 2033 | USD 27.50 billion |
| CAGR, 2026 to 2033 | 9.35% |
| Volume, 2025 | 1,085 thousand tonnes of formulated product |
| Volume, 2033 | 1,760 thousand tonnes |
| Volume CAGR | 6.23% |
| Value per tonne | USD 12,396 to USD 15,625, or 2.94% a year |
| Growth decomposition | 68% volume, 32% price and mix |
| Largest and fastest product family | Biopesticides, 63.9% of 2025 value, 10.2% a year |
| Slowest product family | Biofertilisers and inoculants, 5.6% of value, 4.2% a year |
| Largest region | North America, 29.5% of value, 8.6% a year |
| Fastest region | Latin America, 23.5% of value, 11.3% a year |
The decomposition is the finding
Value grows 9.35 per cent, volume 6.23 per cent, value per tonne 2.94 per cent. The report states the split as 68 per cent tonnage and 32 per cent price and mix, which is those two rates taken on a log basis. On an endpoint bridge, the same table gives three terms rather than two, and they are below.
| Term | USD million | Share of growth |
|---|---|---|
| Volume, at 2025 prices | 8,367 | 59.6% |
| Price and mix, at 2025 volume | 3,504 | 24.9% |
| Interaction | 2,180 | 15.5% |
| Total growth, 2025 to 2033 | 14,050 | 100% |
Either reading carries the same conclusion, and it is the conclusion that matters commercially: this is a tonnage market wearing a technology premium. It is not a category where price is being discovered upward. It is a category where more product is being sold, at a lower price per unit of effect, to farmers who have to be persuaded every season.
Brazil is the only market that measures adoption and revenue separately
CropLife Brasil’s CropData series puts bioinsumo sales at R$ 6.2 billion in 2025, up 15 per cent, across 194 million hectares of treated area, up 28 per cent — the largest single-year expansion on record. At 5.60 to the dollar that is USD 1.11 billion of biocontrol and inoculants in one country, about 11.8 per cent of the USD 9.35 billion global pool for those two families.
Adoption ran at nearly twice the rate of revenue. Over the 2022 to 2024 triennium growth had been a steadier 15 per cent a year in both dimensions. 2025 broke the relationship, and the mechanism is visible the moment you split the market by segment.
| Segment | Value 2025 (R$ m) | Treated area (Mha) | Revenue per treated hectare (R$) | Share of value | Share of area |
|---|---|---|---|---|---|
| Bioinsecticides | 2,170 | 46.6 | 46.6 | 35% | 24% |
| Bionematicides | 1,860 | 44.6 | 41.7 | 30% | 23% |
| Biofungicides | 1,364 | 25.2 | 54.1 | 22% | 13% |
| Inoculants | 806 | 77.6 | 10.4 | 13% | 40% |
| Total | 6,200 | 194.0 | 32.0 | 100% | 100% |
Inoculants are the most widely adopted biological product in the world’s most advanced biological market: on 40 per cent of treated area, present on 90 per cent of Mato Grosso’s soybean area, and earning R$ 10.4 per treated hectare. Biofungicides earn R$ 54.1 — five times as much — on 13 per cent of the area. The most-adopted product in the category earns a fifth of what its least-adopted segment earns.
That is not a failure. It is the arithmetic of nitrogen fixation: a soybean inoculant is applied at a couple of dollars a hectare and substitutes for a fraction of a nitrogen bill in a crop that does not need much nitrogen anyway. But it means the growth cannot come from doing more of what already worked. It has to come from the high-value segments, and those are the segments where performance has to be proven every season. This table is why 9.35 per cent is a defensible forecast and 14 per cent is a story about hectares.
Note the units, because they are regularly confused: treated hectares count applications, not physical land. Brazil’s soybean area is 48.6 million hectares; 194 million treated hectares is roughly two applications across a sown area near 90 million.
On 23 December 2024, on-farm multiplication became a legal category
Brazil sanctioned Lei nº 15.070 on 23 December 2024, without a single veto. It regulates the classification, treatment and production of bioinsumos through on-farm biological management, and ratifies the National Bioinsumos Programme. What had been a grey zone of farm-built multiplication units — some very large, some technically illegal, all of them competing with a purchased inoculant — is now a regulated category with rules attached.
It is the most consequential regulatory event in this market in a decade, and it cuts both ways with unusual clarity.
For the market: legal certainty accelerates adoption. A grower unwilling to invest in on-farm multiplication without knowing whether the practice would survive an inspection now knows. Regulatory recognition also drags biologicals into the same conversation as conventional inputs, which is where volume comes from.
Against the market: the cheapest competitor to a purchased inoculant is now a statute. Every hectare of on-farm multiplication that replaces a purchased dose is a hectare that appears in the treated-area statistics and not in the revenue line. The effect should concentrate exactly where margins are thinnest — commodity inoculants in Mato Grosso — which is why this report models inoculants at 4.2 per cent, the slowest of the three families and less than half the market rate. Brazil’s inoculant market is R$ 806 million, or USD 144 million: 19.2 per cent of the entire global inoculant pool of USD 750 million sits in one country, and it is the pool most exposed to a permissive implementing regulation.
The signpost is the secondary legislation: the scope of permitted on-farm production, the quality-control and traceability requirements, and whether state-level agricultural defence agencies treat farm units as producers or as unregistered manufacturers. A permissive regulation suppresses inoculant revenue faster than a restrictive one suppresses adoption. The difference across eight years is worth one to two percentage points on this forecast.
The efficacy ceiling stopped being an anecdote
For twenty years the industry’s answer to “do biologicals work?” has been an anecdote trade. It no longer has to be. A 2026 systematic review and multilevel meta-analysis of entomopathogenic fungi against Spodoptera species — 63 studies screened, 44 studies and 52 experimental arms pooled — reported a pooled median lethal concentration and, far more importantly, heterogeneity of I² = 96.8 per cent, of which 73.9 per cent sat between studies and 22.9 per cent within them. Meta-regression explained 34.0 per cent of the variance, with host species and application route the primary moderators.
The authors’ own conclusion is the sentence this market should be built around: the prediction interval is wide enough that isolate-level performance cannot be inferred from the pooled mean.
And the sharpest number in the paper is not about efficacy at all. 97.4 per cent of the underlying records derive from controlled bioassays. Nearly everything known about these products comes from conditions no farmer operates in. That is not a gap more research closes quickly; it is a structural feature of a field that has invested in discovery and under-invested in field validation.
Three commercial consequences follow, and they set the shape of the competitive landscape:
- Consistency, not discovery, is the constraint. There is no shortage of candidate strains. There is a shortage of products that deliver the same result across soil types, temperatures, water regimes and spray programmes.
- Value accrues to formulation and delivery — encapsulation, UV protection, tank-mix compatibility, viable-count stability at ambient temperature. These are manufacturing problems, which means capital expenditure, not R&D serendipity.
- Fermentation capacity becomes a strategic asset. Syngenta opened a 22,000 square metre biologicals facility at Orangeburg, South Carolina in 2025, purpose-built for 16,000 tonnes of biostimulants a year, alongside existing sites in Brazil, Italy, India and Norway. One plant is 1.5 per cent of the 1,085 thousand tonnes of formulated biologicals this report sizes for the whole world.
USD 12,396 a tonne, against USD 17,877 for the chemistry it sits inside
This market’s average realised price is USD 12,396 a tonne ex-factory, rising to USD 15,625 by 2033. The crop protection pool that contains its biopesticide value — USD 72.40 billion across 4,050 thousand tonnes, on that report’s own series — realises USD 17,877 a tonne. So the biological pool transacts at 69 per cent of the per-tonne value of the pool it is taking share from.
That gap is the deflation story in one number, and two forces hold it open. On-farm production where it is legal, and private-label supply everywhere: platforms that sell formulated biologicals to distributors and retail brands who put their own name on the bottle. The branded premium compresses at the bottom, which is a second mechanism — alongside Brazilian farm-gate multiplication — by which adoption can rise while branded revenue does not.
The one force pushing the other way is formulation. An unformulated spore suspension and a formulated, encapsulated, stabilised product may contain the identical organism and behave completely differently in a spray tank at 38 degrees Celsius. The margin difference between them is the reward for solving the consistency problem. Which is why the report’s 2.94 per cent value-per-tonne growth is neither a price assumption nor a cost pass-through, but an assumption that formulation intensity just about offsets commodity deflation.
Where the value sits
| Product family | 2025 (USD m) | 2033 (USD m) | CAGR | 2025 share | Share of growth |
|---|---|---|---|---|---|
| Biopesticides | 8,600 | 18,700 | 10.2% | 63.9% | 71.9% |
| Biostimulants | 4,100 | 7,760 | 8.3% | 30.5% | 26.1% |
| Biofertilisers and inoculants | 750 | 1,040 | 4.2% | 5.6% | 2.1% |
| Total | 13,450 | 27,500 | 9.35% | 100% | 100% |
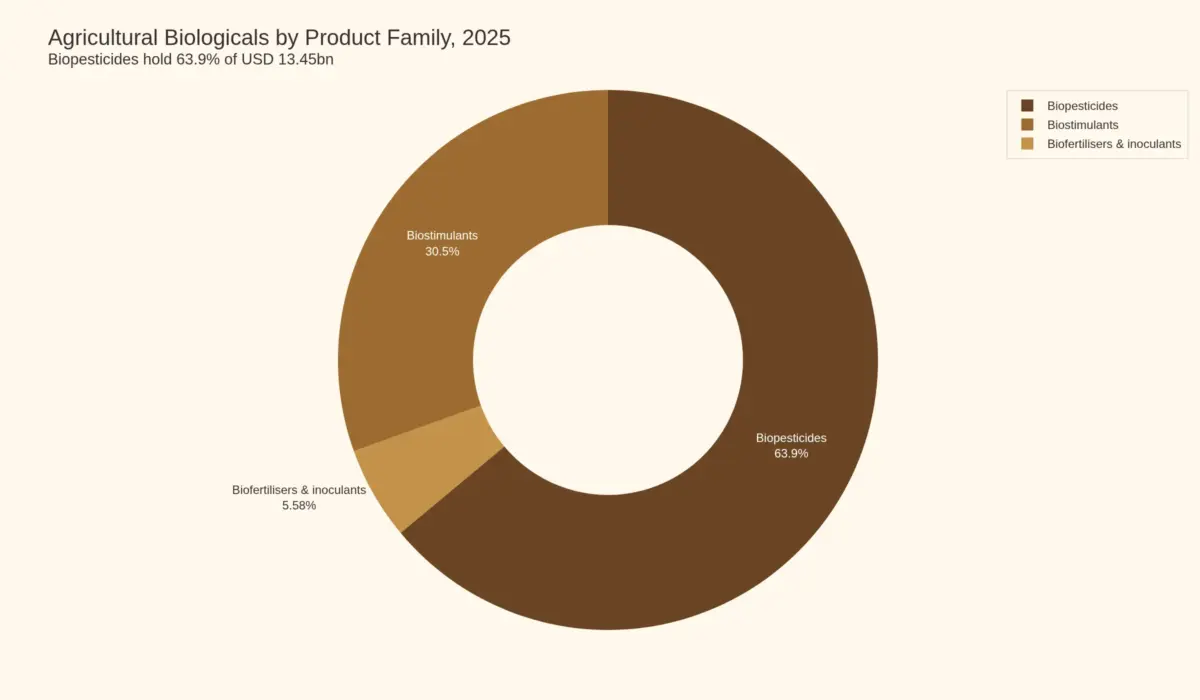
Biopesticides do nearly two-thirds of the value and take the highest growth, because they are sold to solve a problem the grower already has. The segment doing the adopting is not the segment paying. The five-fold revenue-per-hectare spread inside Brazil’s own data is the same finding in local currency, and it is why the growth share column above reads the way it does: biopesticides supply 71.9 per cent of the increase from 63.9 per cent of today’s value, while inoculants supply 2.1 per cent from 5.6 per cent.
| Region | 2025 (USD m) | Share | CAGR |
|---|---|---|---|
| North America | 3,968 | 29.5% | 8.6% |
| Europe | 3,295 | 24.5% | 8.7% |
| Latin America | 3,161 | 23.5% | 11.3% |
| Asia-Pacific | 2,287 | 17.0% | 9.4% |
| Middle East & Africa | 740 | 5.5% | 7.6% |
The distribution is revenue-weighted, not area-weighted, and the distinction is the point. North America leads on value without leading on adoption intensity; Latin America leads on adoption without leading on value per acre; Europe’s position is a regulatory artefact as much as an agronomic one.
Europe invented the category’s legal identity — Regulation (EU) 2019/1009 created the biostimulant as a defined product, with functional product categories PFC 6(A) and 6(B) and harmonised efficacy standards under CEN 17700, applicable since 16 July 2022 — and holds the highest share of global biostimulant value. It is also the region where the organic story is weakest as a growth driver: global organic farmland was 98.9 million hectares in 2024, 2.1 per cent of world farmland, and fell 0.2 per cent, while organic retail sales reached EUR 145 billion. Europe’s biologicals market grows on residue limits and retailer specifications in conventional horticulture, not on organic conversion. Pre-harvest intervals measured in hours rather than weeks are worth more than efficacy to anyone selling horticulture, vines, coffee or citrus into the EU, Japan or a private-label programme.
Asia-Pacific is the volume story and not yet the value story: 17.0 per cent of value on the largest share of the world’s farmland, with India’s subsidised input structure and a domestic manufacturing base capable of driving biological prices down faster than demand rises. Latin America is the proof case and the revenue risk in the same region, because its largest volume segment is its least monetised and its cheapest competitor is now written into law.
No one leads this market, and the capital is buying capacity rather than proof
This is the only input category in agriculture where no company holds a double-digit share, and where the four largest agrochemical companies in the world are all sub-scale relative to their own core businesses.
- Corteva is the only one of the four that discloses a biologicals line: USD 519 million inside crop protection sales of USD 7,503 million — 6.9 per cent. Volume growth of 5 per cent in crop protection was driven by demand for new products, herbicides and biologicals, which tells you the direction without giving you the size.
- Syngenta is the most explicit about intent: biologicals growing double digits across FY2025, the Intrinsyx Bio acquisition in December 2024 for nutrient-use efficiency, the integration of the Novartis strains and natural products collection in early 2025, and Orangeburg. ISABION grew 23 per cent in China. Multiple pipeline candidates carry projected annual sales above USD 100 million each — for context, a fifth of Corteva’s entire disclosed biologicals business per product.
- Bayer Crop Science discloses nothing at biologicals level. Sales of EUR 21,622 million, down 2.9 per cent reported but up 1.1 per cent currency- and portfolio-adjusted, with EBITDA before special items of EUR 4,188 million at a 19.4 per cent margin held flat. In a category where disclosure is itself a strategic choice, that silence is a positioning statement: biologicals are a component, not a business.
- Novonesis is not a crop protection company at all. It is a fermentation company, and fermentation is the capacity constraint — which makes it simultaneously a supplier to the majors and a potential competitor.
The technical capability sits disproportionately outside the top four: Koppert and Biobest built modern biocontrol in Europe from beneficial insects outward, Lallemand and Andermatt hold strain and formulation positions, and in Brazil Vittia, Biotrop, Simbiose and Microquimica built the market the majors are now buying into. Their structural problem is that they lack the three assets that matter at scale — fermentation capacity, registration breadth and row-crop channel depth — which is precisely what makes them acquisition targets rather than consolidators.
The acquisition record of the past eighteen months is unusually legible, and both deals are the same trade executed from opposite ends. In October 2025, Paine Schwartz-backed HGS BioScience acquired NutriAg, combining humic and fulvic manufacturing with a Canadian channel. In March 2026, private-label specialist Synsus acquired Emerald Bioagriculture, adding biostimulant technology to a custom-formulation platform. One buys technology and keeps the channel; the other buys technology and keeps the plant. Neither is buying a brand at a premium.
What almost none of the visible investment is doing is the thing the technology chapter identifies as the binding constraint: field-scale validation and the reproducibility work that would raise the share of acres on which a grower commits to a biological as a planned input rather than a trial. That work is expensive, slow, unglamorous and hard to protect. It is also the only investment that would justify a 13 to 15 per cent growth rate rather than the 9.35 per cent modelled here. Capital is funding capacity, capability and consolidation. It is not systematically funding proof.
What would move the number, in both directions
Eight risks carry dates or signposts, ordered by the size of the forecast they can move. Three matter more than the rest.
The implementing regulation under Lei 15.070. A permissive regime — low obligations, farm units treated as producers — could take one to two percentage points off the market CAGR. A regime imposing traceability and quality obligations pushes growers back toward registered product and supports price.
The value-adoption gap widening rather than closing. If 28 per cent area growth against 15 per cent value growth persists rather than normalising, the market compounds at volume rates and the eight-year number falls toward 6 to 7 per cent.
Chemistry’s recovery removing the demand driver. The most under-appreciated risk here. A material share of biologicals demand exists because specific chemical tools failed — resistance in Spodoptera, nematode control losing active ingredients, herbicide and fungicide withdrawals. A new mode of action restoring cheap, reliable chemical control in a major segment would not destroy the market, but it would remove the urgency that converts a discretionary purchase into a protocol requirement.
Then the arithmetic of the forecast itself. At the published 14 per cent this market would be USD 38.4 billion in 2033; at 12 per cent, USD 33.3 billion. The report’s USD 27.5 billion sits about USD 10.9 billion below the published band, and the only thing standing between those two numbers is whether revenue per treated hectare holds.
For symmetry, three developments would move the forecast up rather than down: mandatory strain-level characterisation, which would improve reproducibility and support premium pricing; a proven nutrient-efficiency product at row-crop scale, which would open an addressable spend several times larger than biocontrol; and a restrictive Brazilian implementing regulation that keeps on-farm production narrow. None is in the base case, and the first and third are genuinely plausible within the forecast window.
Read the full report
Global Agricultural Biologicals (Biopesticides & Biostimulants) Market Report, Size, Share and Forecast 2026–2033 — USD 13.45 billion in 2025 to USD 27.50 billion by 2033 at 9.35 per cent, on volume growing 6.23 per cent and value per tonne 2.94 per cent.
Related research
- Global Crop Protection Market Report, Size, Share and Forecast 2026–2033 — USD 72.40 billion in 2025, and the pool that contains this report’s USD 8.60 billion of biopesticides.
- Global Fertiliser (NPK) Market Report, Size, Share and Forecast 2026–2033 — USD 172.38 billion in nutrient tonnes, the spend this report’s biostimulants and inoculants partly substitute for.
- Global Seaweed Extracts Biostimulant Market Report, Size & Forecast 2026–2033 — the biostimulant sub-category, sized on its own.
- Global Biochar Market Report, Size, Share and Forecast 2026–2033
- Global Seed Treatment Market Report, Size, Share and Forecast 2026–2033 — the other input sold before the seed is sold.
- Peru Crop Protection Market Report, Size, Share and Forecast 2026–2033
- Inoculants Reach 40 Per Cent of Brazil’s Treated Area and Return R$10.4 a Hectare — the evidence behind the most contested number in this forecast.
- On-Farm Multiplication Now Has a Statute, and It Competes With the Product It Copies — the Lei nº 15.070 mechanics, and the three questions in secondary legislation.
Scope, method and the boundary that matters
Scope. Three families are measured together: biopesticides (microbial, biochemical and semiochemical crop protection), biostimulants, and biofertilisers and inoculants. They are measured together because they are sold through the same distributors, to the same buyer, increasingly in the same tank, and often by the same company. Splitting them produces three numbers no purchasing manager recognises.
Excluded. Beneficial macro-organisms — predatory mites, parasitoid wasps and entomopathogenic nematodes sold as live organisms — are excluded. They are a genuine and growing category, but they are a cold-chain logistics business with no fermentation economics and a revenue-per-hectare profile that cannot be compared with a formulated spray.
Volume is formulated product tonnage, not active ingredient: biological actives are not additive across microbial, biochemical and plant-extract categories, so an active-ingredient series would be a technical artefact rather than a transacted quantity. Value is ex-factory, so at the farm gate this market is larger by the distributor margin — which in Brazil and India is substantial.
No licensed study underpins the 2025 figure. It is triangulated from three directions with the convergence band disclosed: a category build (USD 8.60 billion of biopesticides, USD 4.10 billion of biostimulants, USD 0.75 billion of biofertilisers and inoculants); the Brazilian primary-market anchor, the only market where the sector is measured as a market rather than estimated as a category; and a company-disclosure cross-check, in which Corteva is the only one of the four largest input companies that discloses a line. The three converge on USD 12.6 to 14.2 billion, and the midpoint is taken. Published third-party estimates were used only as an internal sanity check and are neither cited nor referenced in the report — the forecast is a stated position, not a consensus, and it sits below the published band because treated hectares and revenue have measurably separated.
The boundary that matters more than the other three combined: this report overlaps two others and must not be added to them. Biopesticides at USD 8.60 billion sit inside the USD 72.40 billion crop protection total, not beside it — Corteva’s own reporting makes the point, with biologicals of USD 519 million disclosed within crop protection sales of USD 7,503 million. The remaining USD 4.85 billion of biostimulants and inoculants sits adjacent to the fertiliser market, whose USD 172.38 billion is measured in nutrient tonnes and excludes them, and to seed treatment, which is sized separately. Anyone summing this report, the crop protection report and the fertiliser report will triple-count. They are a partition of an input bill, not three independent markets.
One reconciliation, disclosed rather than reconciled away. The crop protection report for this segment models biologicals as its fastest-growing product class at 10.68 per cent. This report models the biopesticide pool at 10.2 per cent. The half-point gap is deliberate: there, biologicals are a share shift inside a class total the chemistry forecast fixes; here they are a standalone pool with their own volume series, their own price-deflation assumption and a forecast that has to survive the Brazilian revenue-per-hectare data. Where the two differ, this is the more conservative number, and the reason is documentary rather than methodological preference.
About Pheonix Research
Pheonix Research publishes market intelligence built from primary trade data, company disclosure and official statistical sources, with each figure traced to its evidence and each forecast stated as a position rather than a consensus. This is the twelfth report in the Agriculture & Agritech programme and the third in Crop Protection & Pest Control. It is designed to be read alongside the global crop protection market report, whose USD 72.40 billion total contains this report’s biopesticide value, and the global fertiliser (NPK) report, which sizes the nutrient market these products partly substitute for. It should not be added to either.
Research and analysis by Rachna Patni. Find the full library at pheonixresearch.com.