
Editorial Article
The Biomass Fuel Market Is 59.3 Million Tonnes. The Number Everyone Quotes Is 53.5.
The figure is correct and it measures one product
The biomass fuel market is 59.3 million tonnes. The number everyone quotes is 53.5, and it counts one product in one form.
Global wood pellet production reached 53.5 million tonnes in 2025, up 10 per cent on 2024 and the strongest year-on-year growth in recent years, against 51.5 million tonnes consumed — a record (Bioenergy Europe, Pellet Statistical Report, Brussels, 24 June 2026). It is the best-measured number in the category.
It is also, routinely, quoted as the size of the fuel market, which it is not. It counts pellets. It excludes palm kernel shells, traded wood chips, briquettes and every agricultural and forestry residue stream that a cement kiln, a lime kiln or a biomass boiler actually burns. When a physical product is used as a proxy for a fuel category, the gap between the two is where most of the argument in this market happens.
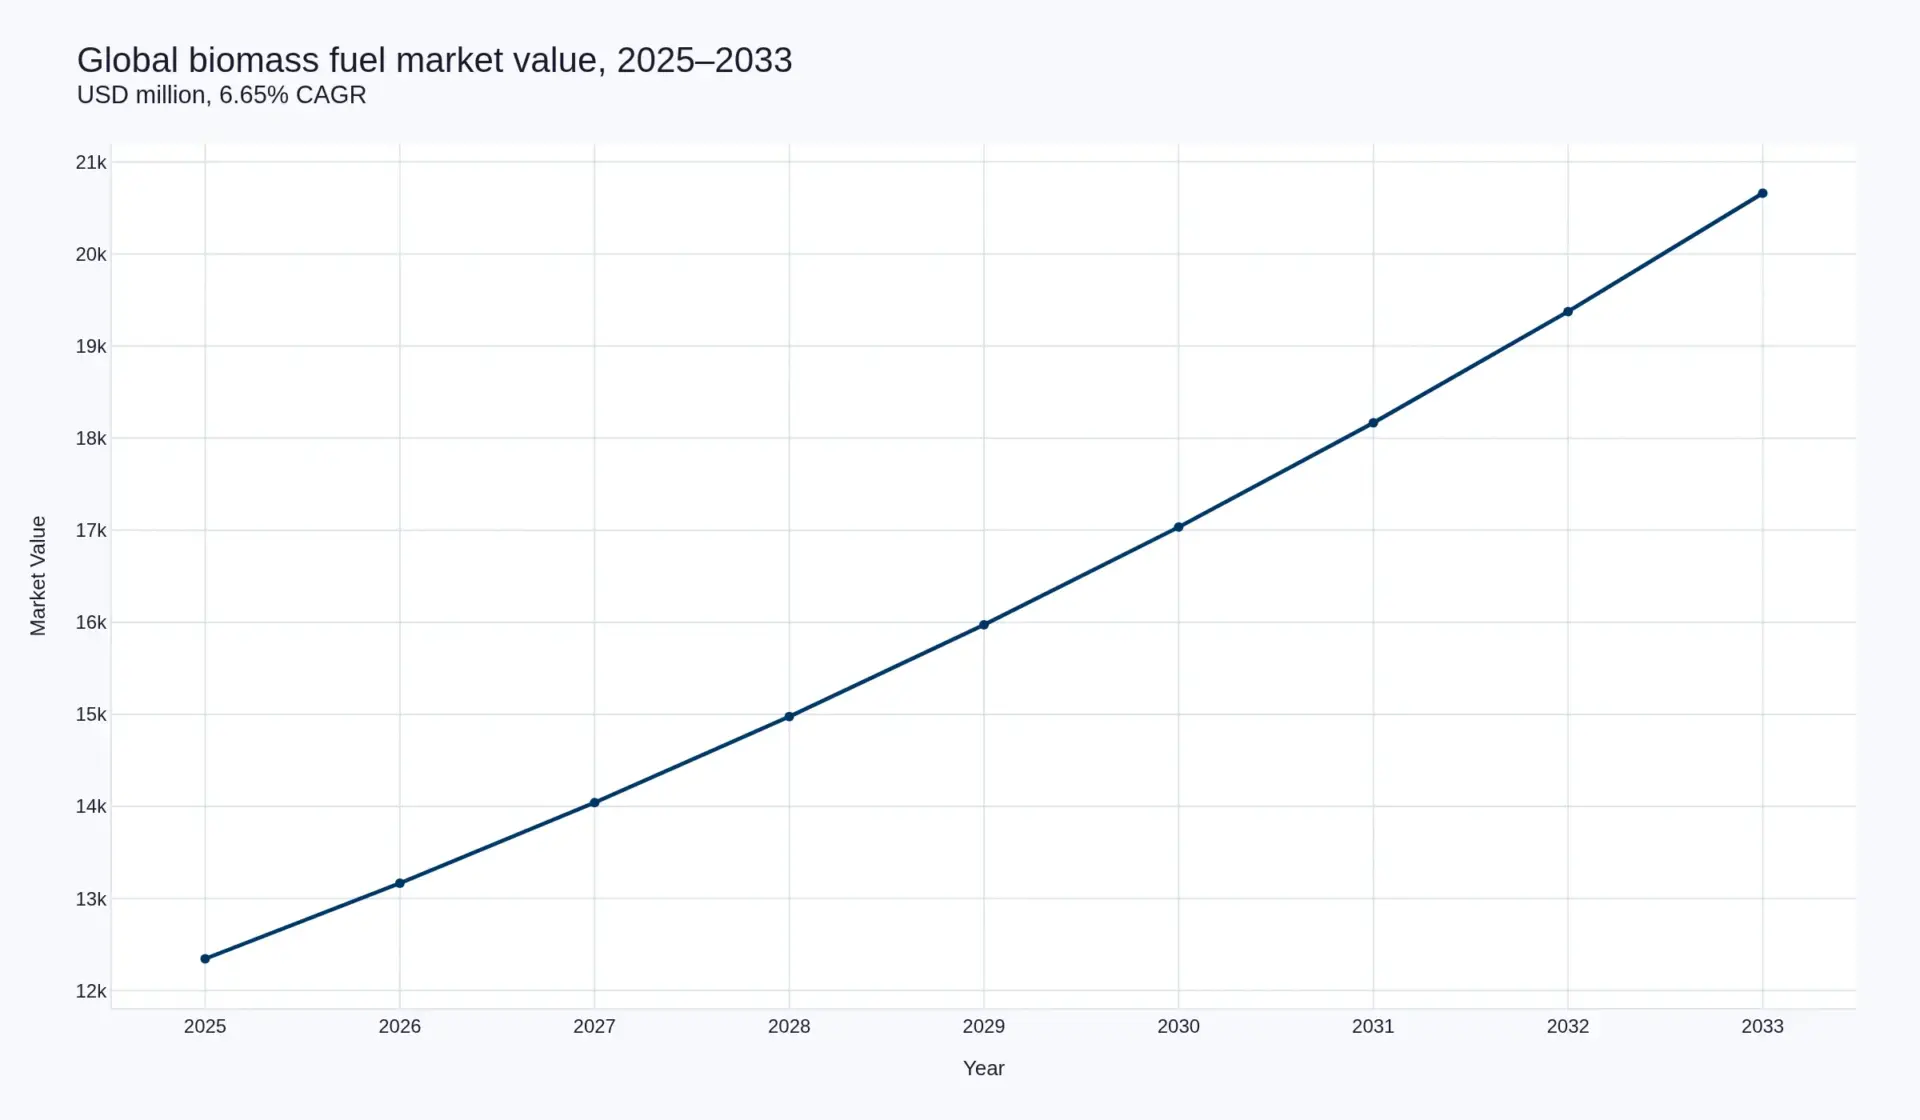
Rebuilding the category from physical volume and pricing it at the delivered point gives a 2025 base of USD 12,345.6 million across 59.3 million tonnes — an average of USD 208.19 per tonne — rising to USD 20,660.0 million and 77.9 million tonnes by 2033 at 6.65 per cent.
The missing 5.8 million tonnes: 9.78 per cent of the volume, 6.29 per cent of the value
Palm kernel shells add 5.8 million tonnes — 9.78 per cent of the base — and only USD 776.0 million, because a tonne is worth what its file is worth.
Japan imported just over 4.0 million tonnes of palm kernel shells in 2025 under HS 1404.90, 74 per cent from Indonesia and 22 per cent from Malaysia, at a landed value of USD 126–141 per tonne. At a blended USD 133.79 the channel clears USD 776.0 million, 6.29 per cent of the measured market — and it is the only channel in this category that cannot be burned in Europe and still counted as renewable.
| Channel | 2025 volume (Mt) | USD/tonne | 2025 value (USD m) | Share of value |
|---|---|---|---|---|
| Industrial wood pellets | 32.7 | 196.62 | 6,429.6 | 52.08% |
| Heating pellets | 20.8 | 247.12 | 5,140.0 | 41.63% |
| Palm kernel shells | 5.8 | 133.79 | 776.0 | 6.29% |
| Total | 59.3 | 208.19 | 12,345.6 | 100% |
That table is the argument. The same tonnage of industrial pellet is worth USD 196.62 and heating grade USD 247.12; palm kernel shells are worth USD 133.79. Volume does not explain a spread that wide, and neither does calorific value — palm kernel shells and wood pellets sit within 1.2 per cent of each other on energy content per tonne. Something else is being priced, and one blended average per tonne across the whole category hides it completely.
Published figures span two orders of magnitude, and both ends are legitimate
A reader who has seen USD 100 billion quoted for “biomass” is not looking at a different market. They are looking at a different noun.
The largest single reason this report’s number is small is that captive bagasse and black liquor are excluded. Bagasse at a Brazilian or Indian sugar mill and black liquor at a kraft pulp mill are burned where they are produced, at a transfer price that is administrative rather than commercial. Hundreds of millions of tonnes of biomass energy move that way every year, and none of it constitutes a fuel market. It constitutes an avoided disposal cost.
- Traded wood chips are real, large and priced — the Baltpool exchange alone cleared 5.3 terawatt-hours in a single heating season — but the majority of chip volume moves within a hundred kilometres of where it is cut, on bilateral contracts that are not consistently reported. Excluded from the base, and used below only as the energy-price reference.
- Refuse-derived fuel is a separate market under separate regulation. The Global Cement and Concrete Association’s 2024 dataset puts alternative fuel use by its reporting companies at 25.57 million tonnes, of which 8.51 million tonnes — 33.28 per cent — is biomass. The remainder is fossil-derived waste.
- Certificate value — Renewable Energy Certificates, RTFCs, Guarantees of Origin, ROCs — trades separately, at its own price, with its own volatility, and on some days is worth more than the fuel it attaches to.
- Firewood and unprocessed forestry residue are materially large in Africa, South Asia and parts of Eastern Europe, and are not a priced, traceable market at all.
Every one of those rungs is a legitimate thing to count. None of them is a fuel market in the sense used here, and adding them produces a number no participant can act on.
Forty-seven per cent of the value is not in the fuel
In the 2024–25 heating season the same megawatt-hour cleared at EUR 21.85 as wood chip and EUR 41.30 as industrial pellet. Across the whole base, USD 5,813.5 million — 47.09 per cent — sits above a chip-equivalent energy price.
The chip figure is measured, not modelled. Baltpool cleared transactions across the three Baltic states at an average of EUR 21.85 per megawatt-hour — EUR 115.8 million for 5.3 terawatt-hours of turnover, with national averages of EUR 21.80 in Lithuania, EUR 22.01 in Latvia and EUR 21.34 in Estonia (Baltpool, 13 May 2025). Three markets converging to within three per cent of each other is what a functioning commodity market looks like.
In the same period, industrial wood pellets were assessed at EUR 195 per tonne CIF ARA — EUR 41.30 per megawatt-hour — and residential-grade ENplus A1 at EUR 210 per tonne, or EUR 44.47 per megawatt-hour (RBCN Biomass Market Update, Q1–Q2 2025). Same energy, same combustion chemistry: a 1.89 multiple on industrial grade and 2.04 on residential.
The premium is not fraud and it is not a bubble. It is the price of a densified, uniform, contractible, traceable tonne, and its components can be separated — statutory export charges, freight, certification, margin. What cannot be separated is that roughly half of what this market is worth is attributable to what travels with the fuel rather than what is in it. Every commercial decision in the category resolves to that fact: where to site a plant, which certificate to carry, whether to sell on spot or term, whether to own a port.
A fixed cost per cargo is a consolidation mechanism
A chain-of-custody audit costs very nearly the same on a 2,000 tonne lot as on a 30,000 tonne cargo, and that single fact reorganises the producer tier.
A GGL, RSB or ISCC EU chain-of-custody audit is largely invariant to volume. At a 30,000 tonne Handysize cargo the cost is trivial per tonne. At a 2,000 tonne regional lot it is prohibitive. Producers therefore consolidate without any of them becoming more efficient — and the producer tier of this market looks considerably more concentrated than its volume shares suggest.
The same mechanism is visible in the trade statistics. The gap between an FOB assessment and a delivered CIF price for the same compliant tonne is 36.6 per cent, and of the USD 37 per tonne between east coast Sumatra and Japan, USD 15 is the Indonesian state: a USD 10 export duty set monthly against the crude palm oil reference price, plus a USD 5 plantation fund levy from 1 March 2026. Certificates, freight and margin account for the remaining USD 22.
What the denominator does to the forecast
The 6.65 per cent rate is 3.47 points of volume and 3.07 points of realised price. Remove the price half and the 2033 market is USD 16,145 million at 3.41 per cent.
That is the sentence a reader should test first. Price growth of 3.07 per cent requires the delivered price of a fuel whose stated purpose is to be cheaper than the fossil fuel it displaces to rise faster than general inflation for eight consecutive years. It is defensible on three grounds — statutory cost escalation in Indonesia, the widening sustainability compliance burden in Europe, and aviation fuel buyers entering the same fibre catchment at a higher willingness to pay — and it is the assumption in this report most likely to be wrong.
Which is the argument for getting the denominator right in the first place. A market measured at 53.5 million tonnes and priced at one blended average conceals both the channel that carries the premium and the channel that cannot monetise it. Measured at 59.3 million tonnes across three channels and five regions, the price assumption becomes visible, separable and arguable — which is the only useful thing a market number can be.
How this was built
Two research layers, approximately 70 per cent secondary and 30 per cent primary, in a division that is deliberate rather than decorative. The secondary layer carries every number in this piece: Bioenergy Europe’s pellet statistics, the RBCN price assessments, Lesprom’s Korean trade series, Drax’s 2025 accounts, the GCCA dataset, Baltpool’s clearing prices, the European Commission’s bioenergy reporting, Argus assessments for Japan-compliant palm kernel shells, and the US Department of Energy’s residue estimate.
The primary layer — structured producer, trader and terminal interviews across the Baltic, Iberian, Southeast US and Southeast Asian supply tiers; buyer-side procurement interviews in Japan, Korea and Northwest Europe; a buying-criteria exercise; and trade-floor engagement at the 2026 pellet industry conference — establishes how this market actually prices, and it supplies no number of its own. The USD 12,345.6 million base, the 47.09 per cent and the 1.89 multiple are what the two layers produce together.
No other market research firm’s estimate appears in this analysis, in any figure or any reconciliation. The only commercial datasets used are price assessments and physical registries.
Related research
- Global Biomass Fuel Market Report, Size, Share and Forecast 2026–2033 — the full report: the 59.3 million tonne base, the regional price reconstruction and the six-chapter analysis behind every figure above.
- Global Pyrolysis Oil Market — the liquid-thermal route out of the same residue streams.
- Global Cement Market — the demand-side frame for co-processing, and the carbon arithmetic that makes a substituted tonne worth paying for.
- Global Biochar Market — the competing use of the same feedstock, at a materially higher value per tonne.
- Bio-Fuels segment — the full segment view.
Frequently Asked Questions
How big is the global biomass fuel market?
USD 12,345.6 million in 2025 across 59.3 million tonnes, an average of USD 208.19 per tonne, rising to USD 20,660.0 million and 77.9 million tonnes by 2033 at a 6.65 per cent compound annual rate — an increment of USD 8,314.4 million. The base covers solid biomass fuel crossing a commercial boundary at the price the buyer paid: industrial wood pellets, heating pellets and palm kernel shells.
Why is the biomass market sometimes quoted at over USD 100 billion?
Because the noun changes. Larger figures typically include captive bagasse and black liquor burned on site at administrative transfer prices, firewood and unprocessed forestry residue, traded wood chips, the certificate value that trades separately from the fuel, and the non-biogenic fraction of refuse-derived fuel. Each is a legitimate thing to count, but none is a fuel market in the sense of product delivered across a commercial boundary at a market price.
Why is the market 59.3 million tonnes when global pellet production is 53.5 million?
Pellet production measures one product in one form. Adding palm kernel shells — 5.8 million tonnes in 2025, 9.78 per cent of the base, of which Japan imported just over 4.0 million tonnes under HS 1404.90 — gives 59.3 million tonnes. The pellet figure is excluded from no part of this analysis; it is the starting point of the reconstruction, not a competing estimate.
How much of a delivered biomass price is certification rather than fuel?
Across the whole measured base, USD 5,813.5 million — 47.09 per cent of the market's value — sits above a wood-chip-equivalent energy price of EUR 21.85 per megawatt-hour. The premium is the price of a densified, uniform, contractible, traceable tonne: statutory export charges, freight, certification and margin. Certification itself is a largely fixed cost per cargo, which is why it consolidates the producer tier without any producer becoming more efficient.