
Global Feed Additives Market Report, Size, Share and Forecast 2026–2033: USD 43.50 Billion to USD 62.90 Billion at 4.72 Per Cent — Half the Growth Comes From Two Categories a Prohibition Created
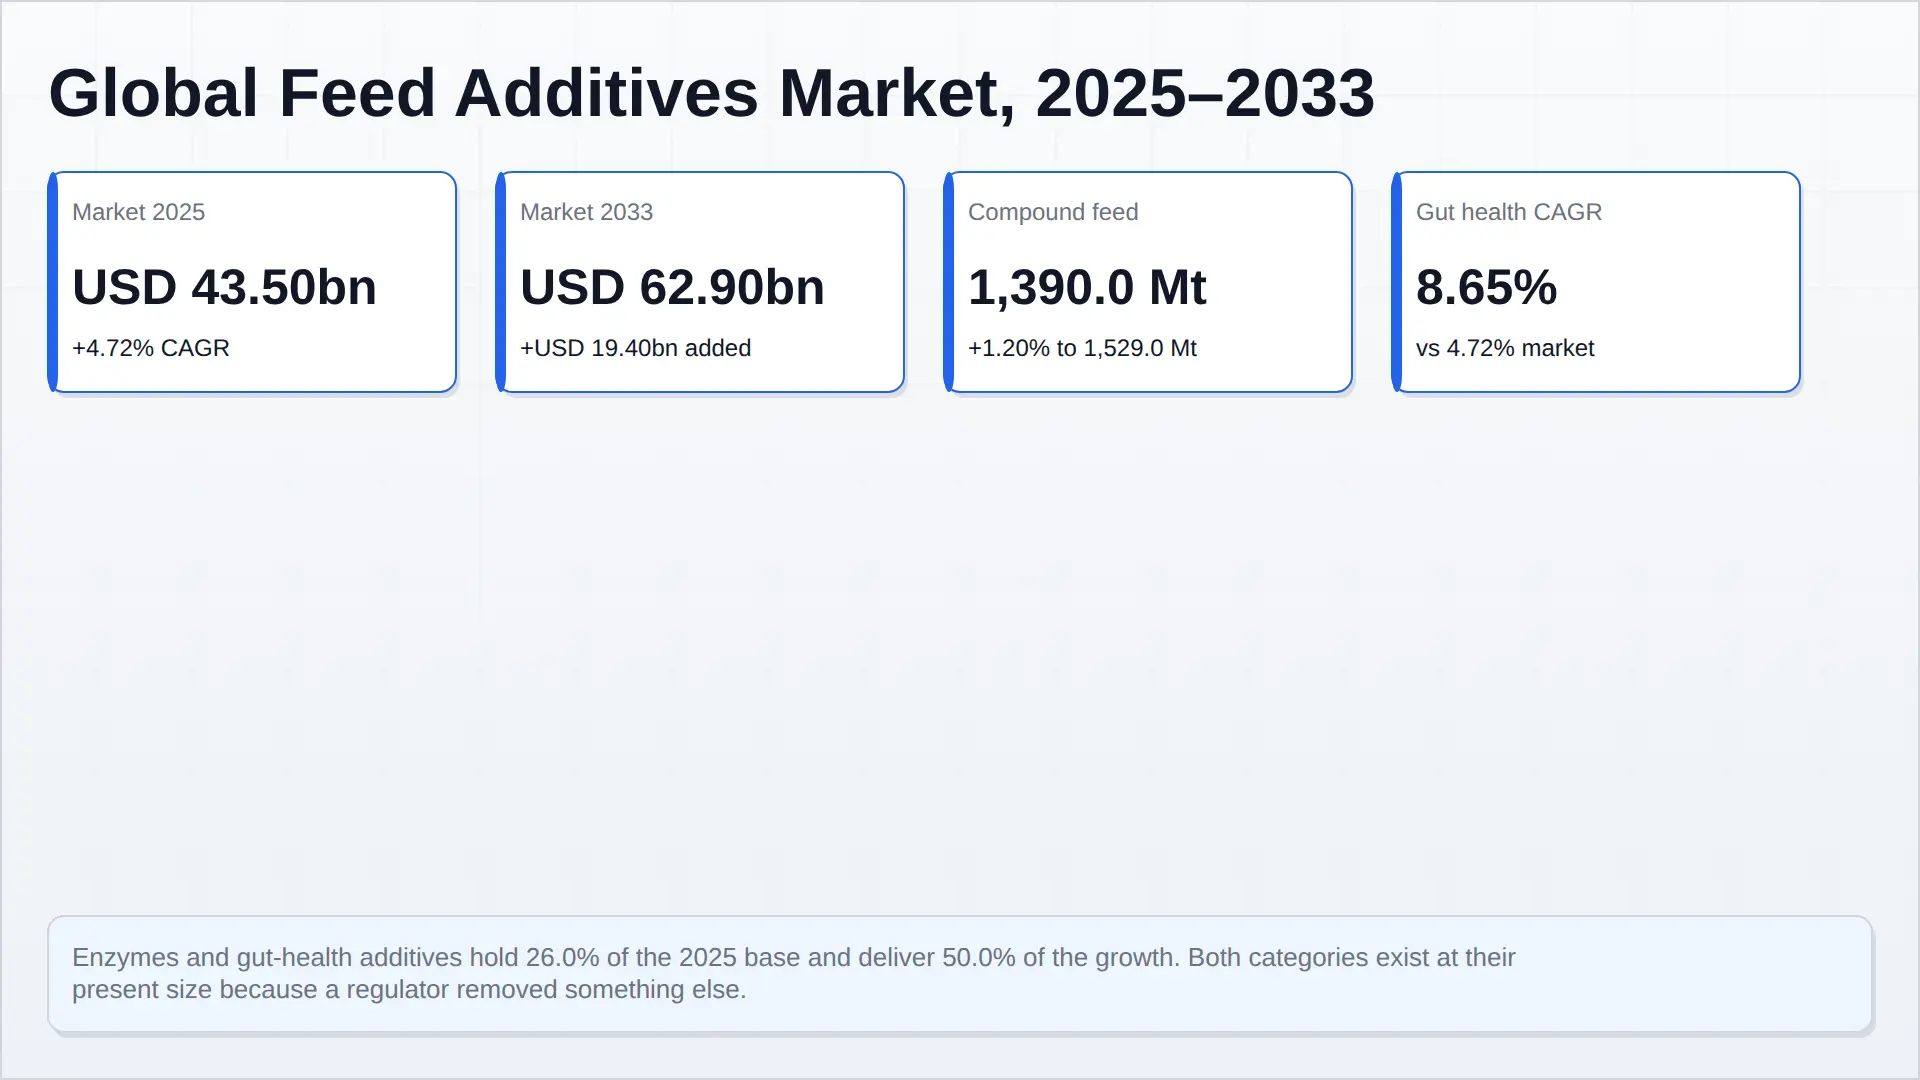
The global feed additives market is USD 43,500.0 million in 2025 and reaches USD 62,900.0 million in 2033, a compound annual growth rate of 4.72 per cent. Compound feed tonnage grows from 1,390.0 to 1,529.0 million tonnes at 1.20 per cent, so the additive book per tonne of feed rises from USD 31.29 to USD 41.14 at 3.48 per cent.
The category split, not the headline, is the finding. Enzymes and gut-health additives hold 26.0 per cent of the 2025 base and deliver 50.0 per cent of the growth — gut health alone adds USD 6,500.0 million at 8.65 per cent. Both categories exist at their present size because a regulator removed something else: phytase substitutes for inorganic phosphate, and gut health substitutes for antibiotic growth promoters and medicinal zinc oxide.
The regulatory record is unusually clear and unusually fresh. The European Union banned antibiotic growth promoters from 1 January 2006 under Regulation (EC) No 1831/2003, whose recital 26 explicitly allowed time for the development of alternative products. It withdrew the medicinal use of zinc oxide by a decision of 26 June 2017 with a transition that could not exceed five years. The gap that withdrawal created is specific: zinc was legal at 2,500 mg/kg as a medicine and at 150 mg/kg as a nutrient, a factor of 16.7. And on 20 January 2026 the Commission refused authorisation for carvacrol as a zootechnical additive for weaned piglets, because EFSA could accept two long-term efficacy trials with significant effects and the applicable rules require three.
The United States pulled the opposite lever and reached the same destination. Under Guidance for Industry #213, production indications were withdrawn from all 31 affected applications, 115 feed products moved to veterinary feed directive status and 84 applications were withdrawn outright — but the molecules remained. The European Union removed the substance; the United States removed the claim. In both cases what the buyer pays for is the licence to make the claim, not the compound.
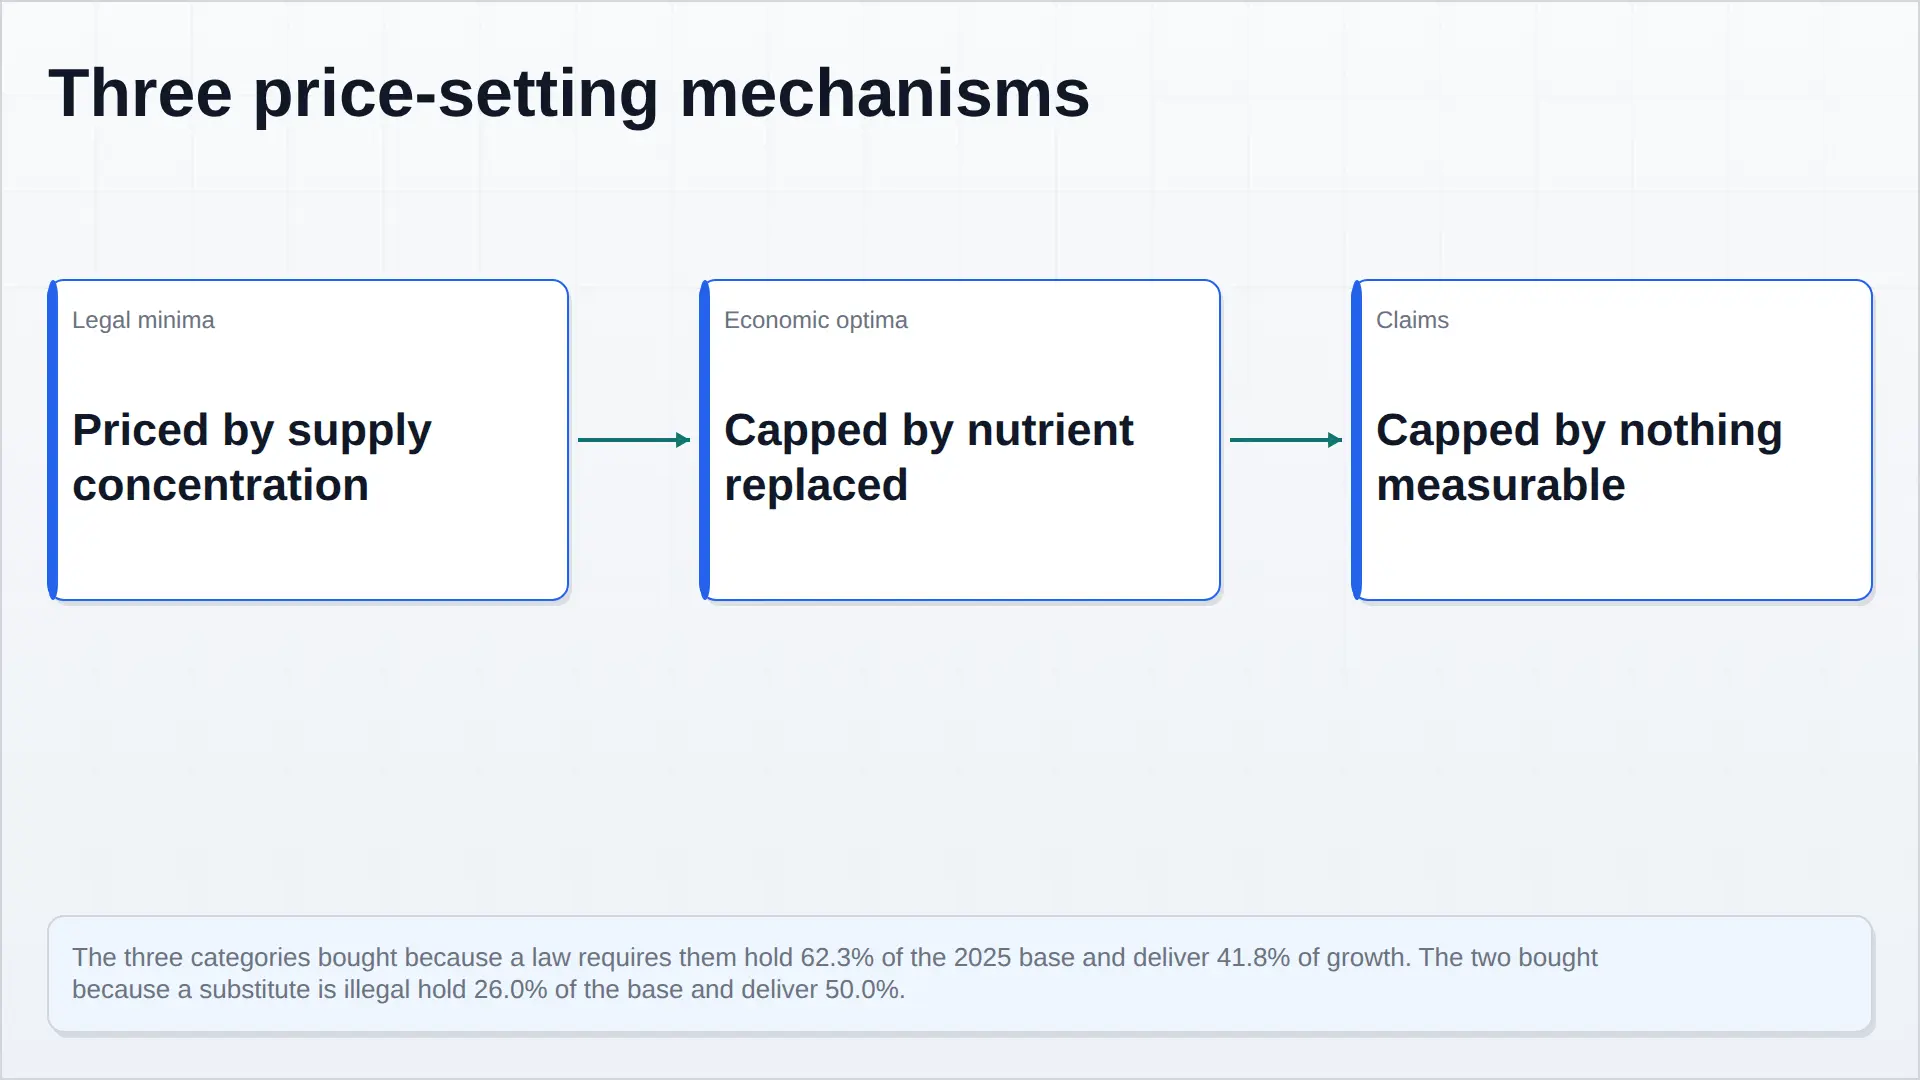
Three mechanisms set price in this market and they should not be averaged. Legal minima — vitamins, trace elements — are priced by supply concentration and one-intermediate fragility. Economic optima — amino acids, phytase — are capped by the nutrient they replace. Claims are capped by nothing measurable, which is where the margin is and where the authorisation risk sits.
What this market is, and what it is worth
Feed additives are the ingredients a feed mill adds to grain and oilseed meal to make a ration function: amino acids that balance protein, vitamins and trace elements that meet a requirement, enzymes that unlock nutrients the animal cannot digest on its own, and a large, loosely bounded group of gut-health and zootechnical products sold against a performance claim.
We size the category at USD 43,500.0 million in 2025, reaching USD 62,900.0 million in 2033 — a compound annual growth rate of 4.72 per cent, or USD 19,400.0 million of new revenue across the eight years.
The volume denominator is 1,390.0 million tonnes of compound feed, rising to 1,529.0 million tonnes at 1.20 per cent. That rate is not our reading of appetite. It is close to what the industry's own survey has recorded: Alltech's 2025 Agri-Food Outlook, drawing on 142 countries and 28,230 feed mills, put global compound feed production at 1.39 billion tonnes in 2024, up 16.7 million tonnes or 1.2 per cent. Revenue per tonne of compound feed therefore rises from USD 31.29 to USD 41.14, or 3.48 per cent a year.
That last figure is the one routinely misread, and this report handles it explicitly. It is not inflation in the price of molecules. It is the value of the additive package bought per tonne of feed — formulation intensity, mix, and only third, like-for-like price. A tonne of broiler feed formulated in 2033 will carry more active ingredients, and more expensive ones, than the same tonne today. Because the metric conflates intensity with price, we do not use it as the headline decomposition. The category decomposition below does that work instead.
Half the growth comes from two categories a prohibition created
| Category | 2025 (USD m) | 2033 (USD m) | CAGR |
|---|---|---|---|
| Amino acids | 14,200.0 | 18,600.0 | 3.43% |
| Trace and macro minerals | 7,300.0 | 9,700.0 | 3.62% |
| Gut health and zootechnical additives | 6,900.0 | 13,400.0 | 8.65% |
| Vitamins | 5,600.0 | 6,900.0 | 2.64% |
| Other technological and sensory additives | 5,100.0 | 6,700.0 | 3.47% |
| Enzymes | 4,400.0 | 7,600.0 | 7.07% |
| Total | 43,500.0 | 62,900.0 | 4.72% |
Two categories — enzymes and gut health and zootechnical additives — hold 26.0 per cent of the 2025 base and deliver 50.0 per cent of the growth. Gut health alone adds USD 6,500.0 million, or 33.5 per cent of everything added, compounding at 8.65 per cent against a market at 4.72. Enzymes contribute a further 16.5 per cent of growth at 7.07 per cent.
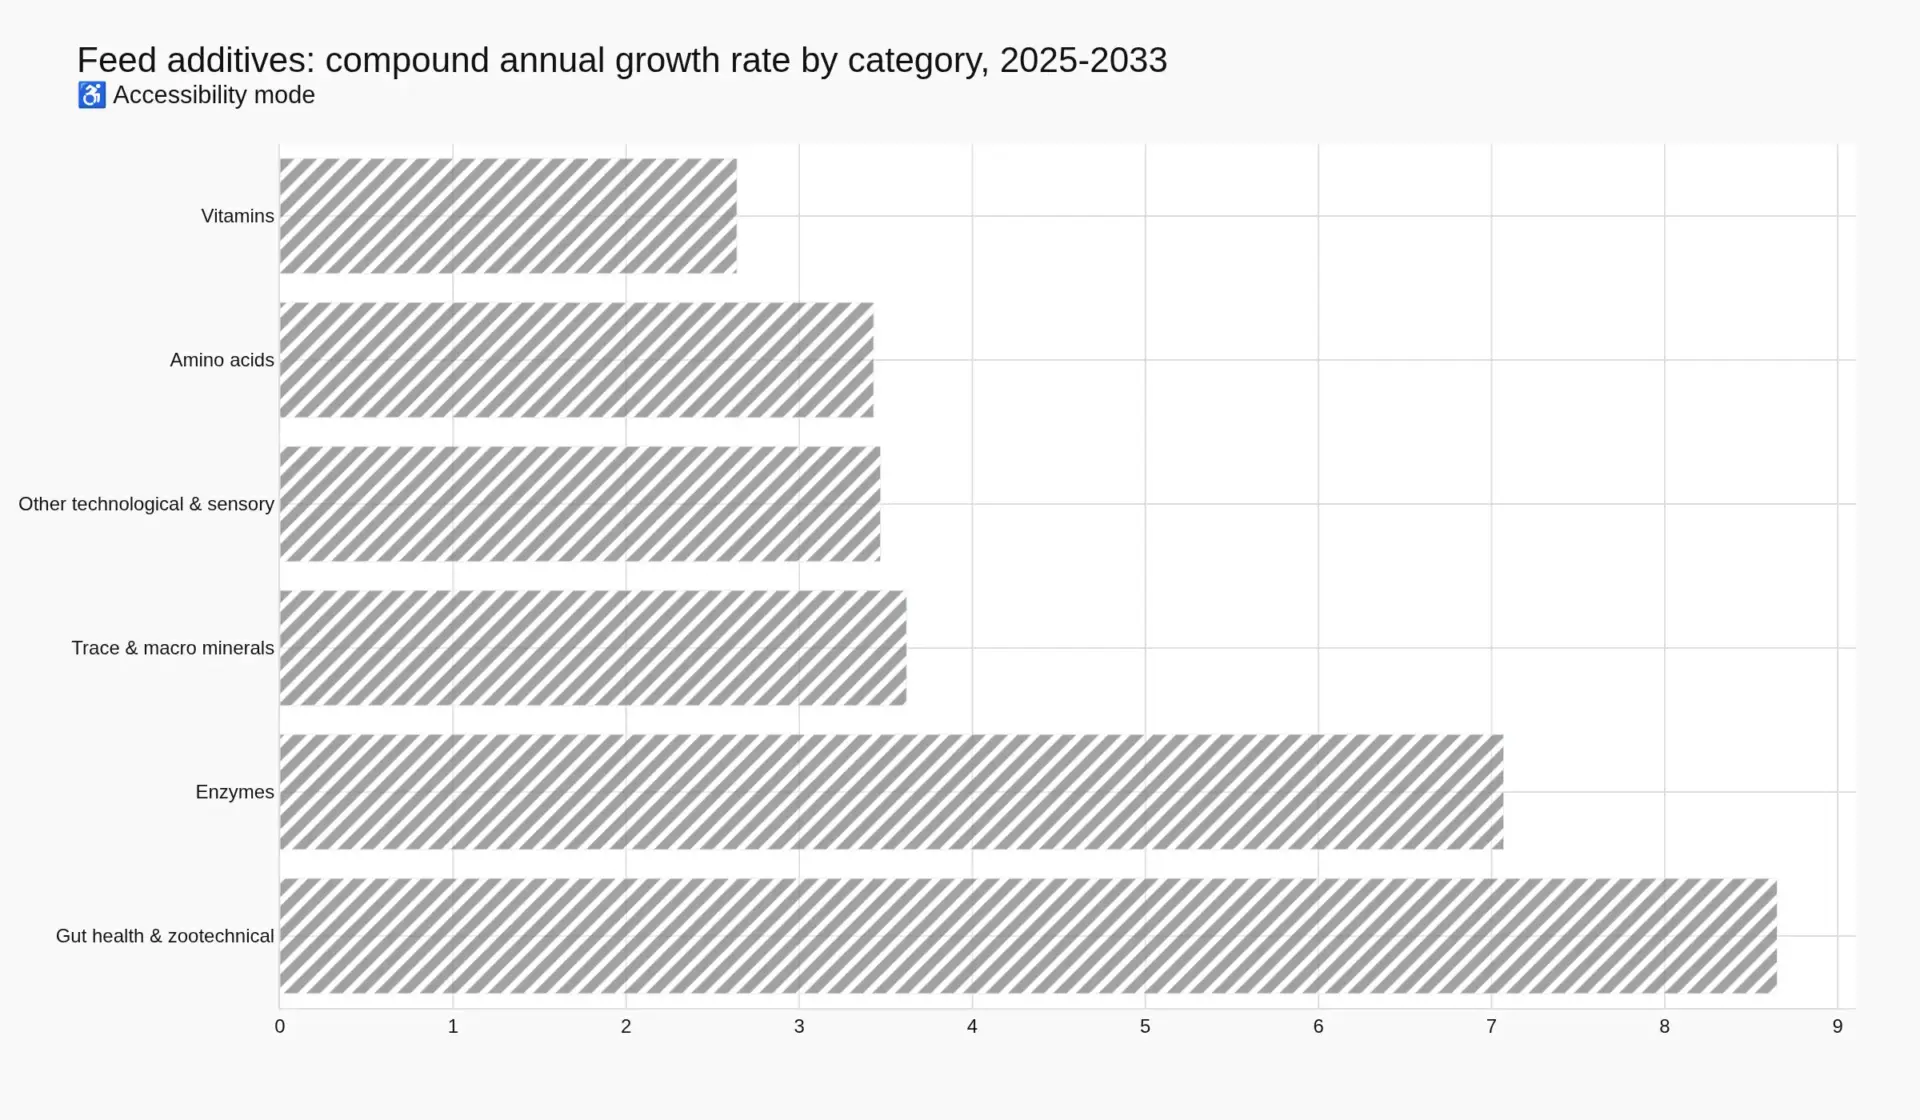
Those two categories share something the other four do not, and it is not technology. Both exist at their present size because a regulator removed something else. Phytase grew because it substitutes for inorganic feed phosphate, a cost line set by a mineral market the feed industry does not control. Gut health grew because the European Union banned antibiotic growth promoters from 1 January 2006 and then withdrew the medicinal use of zinc oxide, leaving a gap between the 2,500 mg/kg that was legal as a medicine and the 150 mg/kg that remains legal as a nutrient in the formulation of every weaned piglet in the Union.
The contrast is the report. The three categories whose demand is created by a legal minimum rather than a prohibition — amino acids, vitamins, and trace and macro minerals — hold 62.3 per cent of the base and deliver 41.8 per cent of the growth, adding USD 8,100.0 million. They are larger, slower, and far more predictable. The two prohibition-created categories are smaller, faster, and carry a risk that has nothing to do with demand.
Three price-setting mechanisms, not one
Treating this as a single market with a single growth rate is the most common error in the category, and it produces forecasts that are wrong in opposite directions at once.
Legal minima are priced by supply concentration. A vitamin or a trace element is bought because the animal requires it and, in most jurisdictions, because a maximum or minimum is written into law. Demand is inelastic, so price is set by how few plants can make the molecule. When BASF declared force majeure on selected vitamin A, vitamin E and carotenoid products on 7 August 2024, after a fire at its Ludwigshafen plant on 29 July, it suspended deliveries of products whose upstream intermediate is a single aromatic chemistry. Nothing about demand had changed. The price of compliance moved.
Economic optima are priced against the nutrient they replace. An amino acid or an enzyme is bought because it is cheaper than the alternative. That places a ceiling on it that the seller does not set. Phytase competes with a phosphate salt; when the salt is expensive, phytase's headroom widens, and when it is cheap, the headroom narrows. This is why amino acids and enzymes can grow volume strongly while their per-unit price stays subdued.
Claims are priced against nothing measurable. A gut-health product is bought to replace an antibiotic that can no longer be sold, and no reference method exists to verify in the field that it has. Its price is not anchored to a substitute's cost because the substitute is illegal. That is the only one of the three mechanisms that reliably produces both growth and margin — and it is also the one exposed to the authorisation process examined in the regulatory chapter.
The hinge: what is licensed is the claim, not the molecule
The most useful way to read this market is to notice that regulators in the two largest jurisdictions removed different things, and neither removed the product.
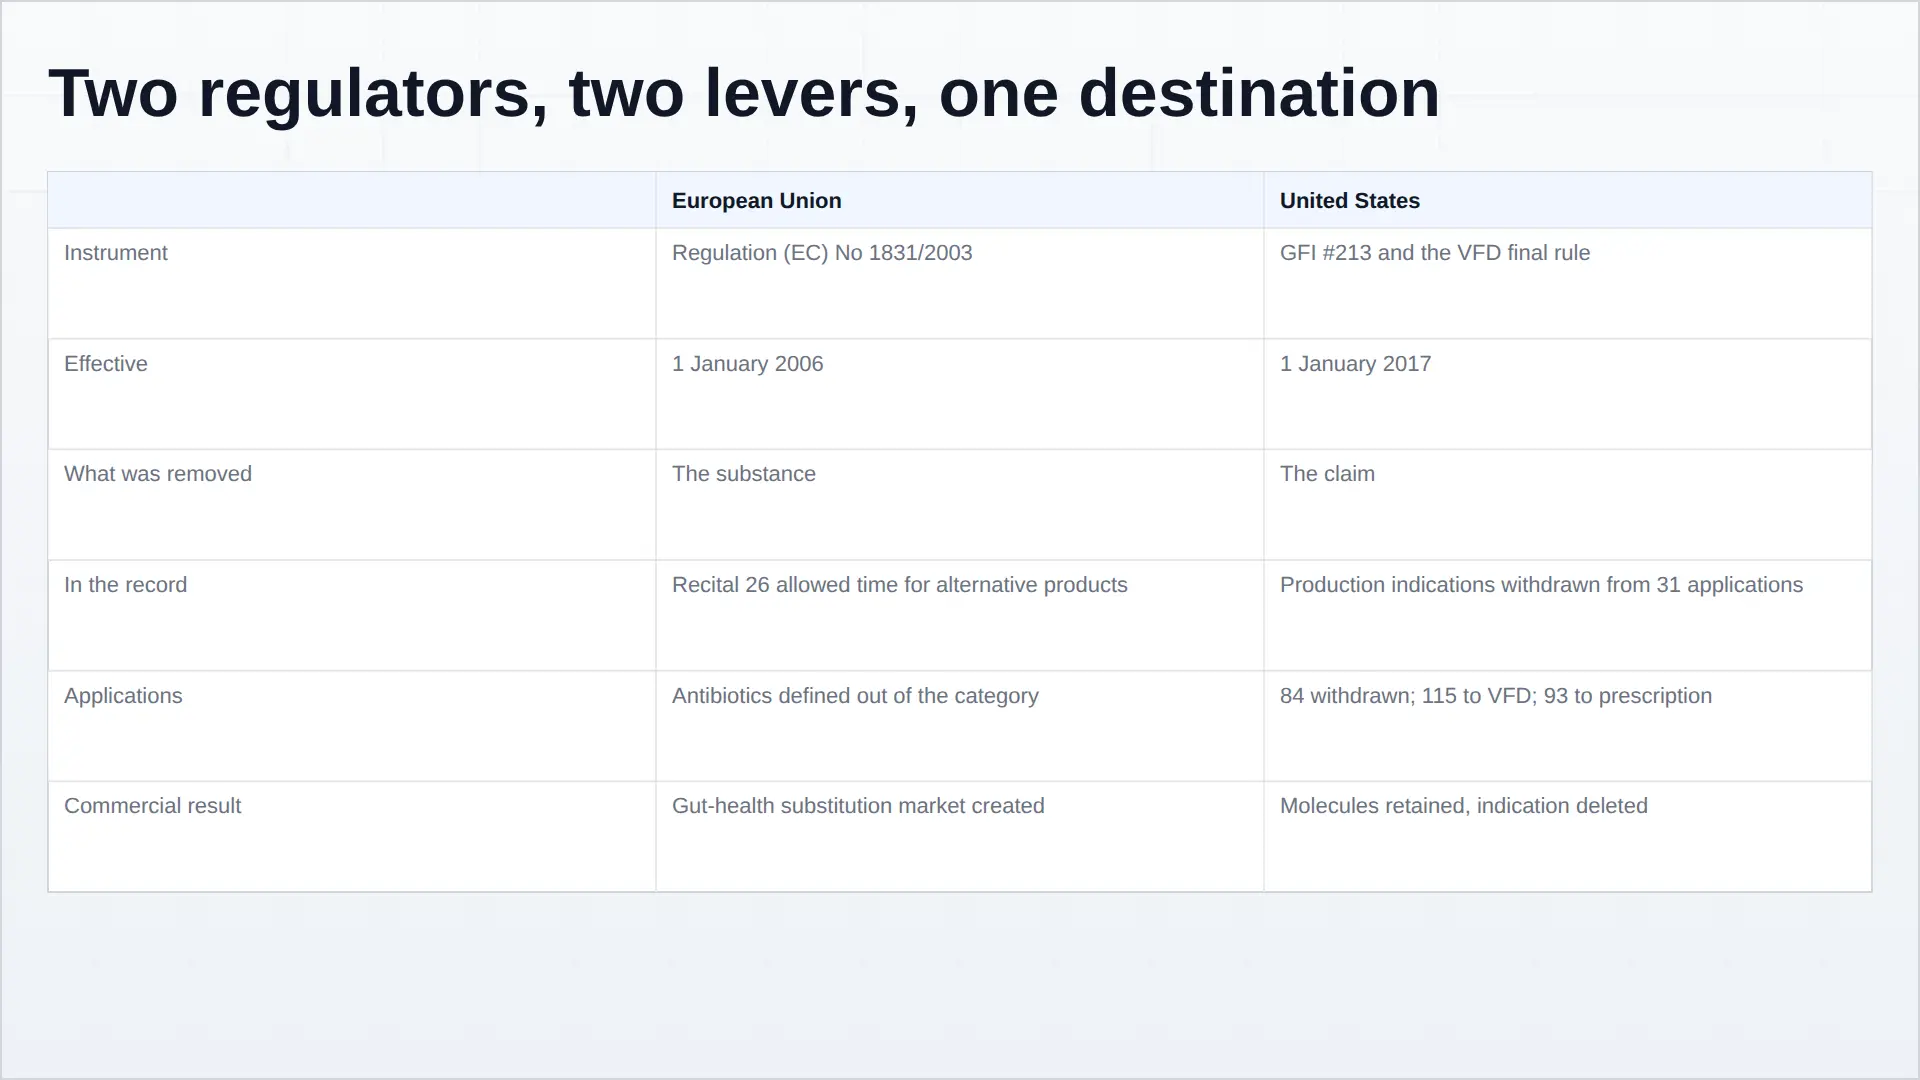
In the United States, the FDA's Guidance for Industry #213 removed the indication. Of 292 new animal drug applications initially affected, 84 were completely withdrawn; 93 oral products intended for use in water were converted from over-the-counter to prescription status; 115 feed products were converted to veterinary feed directive status; and production, including growth promotion, indications were withdrawn from all 31 applications that carried them. The molecules stayed. The claim that made them valuable on a feed label did not.
In the European Union, Regulation (EC) No 1831/2003 took the opposite route and removed the substance from the category altogether. The Commission's own guidance states it plainly: antibiotics, other than coccidiostats or histomonasts, are not feed additives under European legislation. Recital 26 of the same regulation required a date after which growth-promoting antibiotics would be forbidden, while allowing sufficient time for the development of alternative products to replace those antibiotics. The Union legislated a substitution market into existence and set its clock.
Both routes end in the same place. The value in feed additives sits in the licence to make a claim, not in the compound. The molecule is sold either way.
What this report does and does not count
Three exclusions define the perimeter and each one is deliberate.
Inorganic feed phosphates are excluded and are sized separately in our Global Feed Phosphates report. That is not a presentational choice. Phytase's commercial value is defined by the phosphate it displaces, so counting both the displaced and the displacer in one number would double-count a substitution. The two reports are two perimeters, not two estimates of one thing.
Mycotoxin binders are excluded and are sized in our Global Mycotoxin Testing & Feed Binder report. Binders are a feed additive by function and a food-safety product by purchase trigger, and the buyer is frequently the same person who buys the test. Keeping them in one perimeter would guarantee a contradiction with a live page.
Veterinary medicinal products are excluded. Zinc oxide at 2,500 mg/kg was a medicine, not an additive, which is precisely why the European Commission could withdraw it in 2017 while the nutritional maximum of 150 mg/kg in complete feed survived. That sixteen-fold gap between what was legal as a nutrient and what was legal as a medicine is the geographic origin of the entire European gut-health category.
The residue is the additive book bought by the world's feed mills: USD 31.29 of additives in every tonne of compound feed in 2025, rising to USD 41.14 in 2033. It is a modest share of the ration and a decisive share of its performance.
How to read the forecast
The forecast does not model animal numbers, and it does not model additive prices molecule by molecule. It models the additive book per tonne of feed, category by category, against a volume line anchored to the industry's own feed survey. That makes it robust to commodity cycles and exposed to regulatory ones.
Sensitivities are published rather than buried. Holding revenue per tonne flat at USD 31.29 and growing only volume gives USD 47,842.4 million in 2033, a compound rate of 1.20 per cent. Holding feed tonnage flat at 1,390.0 million tonnes and growing only the additive book gives USD 57,184.6 million, a compound rate of 3.48 per cent. The gap between those two numbers and the headline is the interaction between them — and it is the reason a forecast built on either alone will be wrong.
The value base is a construct, and it is disclosed as one. The only company in the category that breaks out an individually auditable feed-additive line does so inconsistently, and no jurisdiction requires a feed-additive revenue disclosure. The band around USD 43,500.0 million is USD 39,000–48,500 million, built bottom-up from category-level revenue where disclosed and from inclusion rates and ration tonnage where not. The direction of the finding does not depend on where in that band the true figure sits.
Table of Contents
- Executive Summary
- Half the growth comes from two categories a prohibition created
- Three price-setting mechanisms, not one
- What this report does and does not count
- Value Chain
- Methionine is chemistry; lysine is fermentation
- Phytase is priced against a rock
- Vitamins hinge on one intermediate
- Technology and Innovation
- Three long-term trials: the efficacy bar
- Precision nutrition and the analytical gap
- Competitive Landscape
- Concentration in molecules, fragmentation in claims
- Regulatory Landscape
- Investment Activity
- Market Risk
Competitive Landscape
Competitive landscape: concentration in molecules, fragmentation in claims
This market’s competitive structure cannot be described with a share table, and the reason is structural rather than a limitation of our data. The participants do not compete in one market. They compete in six, each with a different number of credible suppliers, and most do not disclose feed-additive revenue separately from a segment that bundles it with something else.
Concentration in molecules
Where the product is a synthesised molecule, concentration is extreme and documented. Methionine has nine suppliers worldwide producing close to 1.8 to 1.9 million tonnes a year, with the top three holding almost 80 per cent of production. Only three of the nine run more than one plant, so a maintenance shutdown at a single site is a market event. The named participants are Evonik, with plants in Belgium, Singapore and the United States; Adisseo, with powder capacity in France, liquid capacity in Spain and China, and new powder capacity in China; Novus International, with a single United States plant; Sumitomo in Japan; two further Chinese producers; a Russian producer; and CJ CheilJedang, whose Malaysian methionine facility has been reported as closing. That is a market in which the credible supplier list is short enough to write down.
Vitamins are similar in kind and worse in fragility. Vitamin A and the carotenoids depend on a shared precursor chain, and the consequence was visible on 7 August 2024 when BASF declared force majeure on selected vitamin A, vitamin E and carotenoid products after the 29 July fire at Ludwigshafen. dsm-firmenich is the other large integrated vitamin position. Two credible sources for a legally required nutrient is not a competitive market; it is a duopoly with a repair schedule.
Fragmentation in claims
Where the product is a claim rather than a molecule, the structure inverts. The gut-health category has dozens of credible participants, no dominant supplier, and no accepted reference method to adjudicate between them. Alltech built a position in yeast-derived products and trace mineral chelation; Kemin Industries in antioxidants, mould inhibitors and phytogenic actives; Nutreco through premix and formulation reach rather than through a proprietary molecule. Alongside them sit specialist enzyme and probiotic houses, regional blenders and botanical extract suppliers, most of which cannot be enumerated because the category boundary is defined by marketing rather than by chemistry.
The economics of that fragmentation are counter-intuitive and worth stating plainly: the fragmented category earns the better growth and the better margin. Gross margins in gut health are generally reported by participants to exceed those in amino acids, because the buyer has no substitute to price against — the substitute is illegal. Concentration and profitability in this market are inversely related.
Enzymes: the one category that consolidated
Enzymes sit between the two. The technology is real, measurable and patented, and the market has just consolidated decisively. On 11 February 2025 Novonesis agreed to acquire dsm-firmenich’s share of the Feed Enzyme Alliance and take over its sales and distribution activities for EUR 1.5 billion in cash, dissolving a partnership that had run for more than 25 years. Novonesis described the logic as vertically integrating the complete value chain, adding dsm-firmenich’s sales and distribution to its own innovation and production capability, and combining enzymes with probiotics for animal nutrition and health.
That transaction is the single most informative competitive event in this report. It converts a jointly held leadership position into a single owner of the enzyme-plus-probiotic offer, and it does so at the moment the seller is repositioning away from animal nutrition. A competitor’s exit and a specialist’s consolidation are the same fact seen from two sides.
The ownership shift, and what it says
The category’s strategic direction is best read through ownership rather than through revenue. The integrated chemical majors are leaving animal nutrition; the biological specialists are buying it. dsm-firmenich’s own chief executive described the Feed Enzyme Alliance sale as enabled by a strategic repositioning at his company, and Novonesis described the acquisition as expanding its presence across the animal biosolutions value chain. Archer Daniels Midland and Cargill remain the large integrated agricultural positions, with additive exposure embedded in a much larger trading and processing business rather than run as a standalone franchise.
Our reading, and this is an analytical judgement rather than a disclosed fact, is that the value in this market is migrating from the company that can synthesise a molecule to the company that can hold a claim and a formulation. The enzyme business is worth EUR 1.5 billion to a specialist and a divestment to a generalist. That is not a disagreement about the business’s quality. It is a disagreement about what kind of company can monetise it.
What is not disclosed, and why it matters
We have not published a market share table for this report, and the reason is not caution. For eight of the ten companies named here, feed-additive revenue is not separable from a segment that bundles it with base feed, premix services or unrelated chemistry, and no jurisdiction requires the disclosure. A share table built on those filings would be an artefact of segment boundaries rather than a measurement of position.
What can be said with confidence is the shape: concentrated in molecules, fragmented in claims, consolidating in enzymes, and contested at the premix layer where the formulation decision is actually made.
Value Chain
The chain, and where the margin actually sits
Feed additives are not one value chain. They are six, sharing a customer and nothing else. The customer is the feed mill or the integrated producer who formulates a ration; the six chains upstream of that customer use different chemistry, different capital and different sources of pricing power.
The useful distinction is between molecules that are made and molecules that are grown. Methionine and the vitamins are synthesised in chemical plants; lysine and the enzymes are fermented. That single difference explains most of the cost structures, most of the geographic concentration, and most of the margin asymmetry in this report.
Methionine is chemistry; lysine is fermentation
Methionine is made from acrolein, hydrogen cyanide and methyl mercaptan — hazardous intermediates handled at scale on chemical platforms where propylene, gas and ammonia arrive by pipe. Adisseo’s own account of the industry, given in a recorded open industry interview, puts the global methionine market at close to 1.8 to 1.9 million tonnes a year, produced by nine suppliers worldwide, with the three largest accounting for almost 80 per cent of production. Only three of those nine operate more than one plant. The product sells in two forms that are chemically equivalent to the animal: DL-methionine powder at 99 per cent methionine content and liquid methionine hydroxy analogue at 88 per cent.
The commercial consequence of that structure is a hard capacity discipline. A methionine plant is described in the industry as resembling a refinery, and it must be taken down for major maintenance roughly every one to two years. Nameplate capacity therefore overstates real output by a persistent margin, and price responds to a single plant’s outage rather than to demand. Adisseo operates powder capacity in France, liquid capacity in Spain, liquid capacity in China and a new powder plant in China; Evonik runs Belgium, Singapore and the United States; Novus runs one United States plant; Sumitomo one in Japan; two Chinese producers one each; a Russian producer one. When one of those units stops, the tonnage cannot be replaced quickly by anyone.
Lysine is the opposite. It is fermented from glucose, which means it tracks corn and energy prices, water availability and fermentation capacity — and capacity has migrated to the places where those inputs are cheapest. The result is a market that is structurally long, priced close to cash cost, and periodically repriced by capacity additions rather than by outages. Lysine and methionine sit inside the same reported category and have almost nothing economically in common.
Phytase is priced against a rock
Phytase is an enzyme that hydrolyses phytate, releasing phosphorus the animal would otherwise excrete. Its commercial value is therefore not a performance claim but an arithmetic substitution: every unit of phytase included allows a quantity of inorganic feed phosphate to be removed from the ration. That arithmetic caps what the enzyme can charge, and it ties the enzyme’s fate to a mineral market modelled in our Global Feed Phosphates report and upstream to the fertiliser complex covered in Global Fertiliser (NPK).
This is the cleanest example in the category of a ceiling imposed from outside. When phosphate salts are expensive, phytase’s headroom widens and adoption accelerates; when they are cheap, the headroom closes and only regulatory limits on phosphorus excretion keep the product in the ration. That is why phytase can post strong volume growth while its realised price stays subdued, and why the enzymes category in this report grows at 7.07 per cent largely on units rather than on value per unit.
The second enzyme family, non-starch polysaccharide enzymes, has a different driver and a similar cap. Xylanases and glucanases earn their place when the ration contains more by-product — distillers’ grains, wheat, barley, rice bran — because those ingredients carry fibre the bird cannot use. The value of the enzyme therefore rises exactly when the ration gets cheaper and more fibrous, which is to say when the feed industry is under cost pressure. It is a hedge sold to the buyer of the hedge.
Vitamins hinge on one intermediate
Vitamins are a small category that behaves like a specialty chemical market, because that is what it is. Vitamin A and the carotenoids share a synthesis route that passes through citral and isophytol. When the plant making those precursors stops, the downstream products stop with it, and there is no second source that can be qualified quickly enough to matter.
The market demonstrated this on 7 August 2024, when BASF declared force majeure on deliveries of selected vitamin A, vitamin E and carotenoid products following a fire at its Ludwigshafen site on 29 July. The affected list included ionones, pyranol, DL-menthol, rose oxides, ethyllinalool, nerolidol and isophytol R. The declaration suspended contractual liability and told every premixer in the world that a single site’s repair schedule now governed their formulation.
What follows is the central asymmetry of the legal-minimum categories. Demand for a vitamin is inelastic because the animal requires it and, in most jurisdictions, because a minimum or maximum is written into feed law. Inelastic demand plus concentrated supply produces price spikes that are unrelated to volume, followed by price collapses as capacity returns. The category’s eight-year compound growth rate of 2.64 per cent is the average of a series that has never once been smooth.
The premix layer and the mid-chain margin
Between the molecule and the mill sits a layer that is easy to overlook: the premix and custom-formulation business, which buys micro-ingredients in bulk, blends them to a customer’s specification, and sells a bag with a guaranteed analysis. This is where a great deal of the volume in vitamins and trace minerals actually changes hands, and its economics are entirely different from the molecule makers’. A premixer earns on formulation service, working capital and traceability, not on molecular scarcity, and the capital intensity is low enough that the layer is fragmented almost everywhere outside North America and northern Europe.
Our own reading of the chain, and the primary analytical contribution in this chapter, is that the mid-chain is where the additive book per tonne of feed is actually set. The molecule maker sells a price; the premixer sells a formulation; the nutritionist who specifies the formulation is the person who decides whether the tonne carries USD 31.29 of additives or USD 41.14. That decision is made against a target, a cost constraint and a regulatory floor, and it is made by a few thousand people worldwide. Understanding where they sit in the chain is more useful than any supplier ranking.
Investment Activity
Investment activity: the capital cycle is in capacity, not in deals
This category does not transact like a growth sector. The deal record is thin, the disclosed multiples are absent, and the largest strategic signal of the last two years is a divestment rather than an acquisition. What the sector does do is build, and the capacity cycle is where the capital actually goes.
The February 2025 transaction
The defining event is the dissolution of the Feed Enzyme Alliance. On 11 February 2025 Novonesis agreed with dsm-firmenich to dissolve the alliance and take over its sales and distribution activities for a total cash consideration of EUR 1.5 billion.
Four things in the announcement carry information beyond the price. First, the partnership had run for more than 25 years, so this was not a distressed exit but the unwinding of a mature joint structure. Second, Novonesis framed the rationale as vertically integrating the complete value chain, adding dsm-firmenich’s sales and distribution to its own product innovation and production capabilities. Third, it framed the market opportunity as the total animal biosolutions market growing at a mid-single digit CAGR, driven by protein demand, land scarcity and environmental concerns — a growth statement consistent with our enzymes category at 7.07 per cent and materially above our overall market at 4.72. Fourth, dsm-firmenich’s chief executive attributed the opportunity to a strategic repositioning at dsm-firmenich, which is the seller’s own account that animal nutrition is no longer core.
That is a EUR 1.5 billion cash price for a distribution and commercial position in a business whose molecules are made by someone else. It tells you where the buyer thinks the value is: not in the fermentation, but in the relationship, the formulation support and the route to the mill.
The capacity cycle nobody reports as investment
The larger capital commitment in this market is in methionine plants, and it is a cycle rather than a transaction.
Adisseo’s footprint as described by its own commercial team comprises a powder methionine plant in France, a liquid methionine plant in Spain, a liquid methionine plant in China and a new powder methionine plant in China. A Chinese producer that did not make methionine a decade ago has built powder capacity and opened liquid capacity. The remaining suppliers operate one plant each. Methionine plants are described by the industry as resembling refineries, sited on chemical platforms where propylene, gas and ammonia arrive by pipeline, and requiring major maintenance shutdowns roughly every one to two years.
This is the highest-capital part of the category and the least visible in deal data, because it is funded through ordinary capex rather than through acquisitions. Its economics are unforgiving: a new plant must run near nameplate to earn a return, and every addition of nameplate compresses the price everyone receives. That is why the amino acid category in this report grows at 3.43 per cent on strong volume and soft unit value, and why capacity additions rather than demand surprises are the thing to watch.
Where the smaller capital is going
Two other investment themes are visible, both smaller and both more interesting per dollar.
The first is enzymes and biologicals capacity, which follows the Novonesis logic: fermentation assets plus application laboratories plus technical service. This is where the growth categories are actually funded, and it is a capability investment rather than a molecule investment. It also explains why the buyer of the enzyme business was a biologicals specialist and not a chemical major.
The second is the premix and formulation layer, where consolidation is quiet, regional and driven by working capital and traceability requirements rather than by technology. No transaction in that layer has been large enough to enter the public record in a form we can cite, which is itself a finding: the layer that sets the additive book per tonne is the layer with the least disclosed economics.
Why there is no transaction multiple in this report
We have not published an EV/EBITDA or revenue multiple for feed additives, and the reason should be stated rather than implied. To compute a comparable multiple you need a target with separable feed-additive revenue and separable earnings. In this category you do not have one. The Feed Enzyme Alliance consideration was for sales and distribution activities, not for a legal entity with a disclosed profit and loss account. Methionine capacity sits inside chemical segments. Gut-health participants are private or buried inside larger groups.
The one number we can state without constructing a multiple is the shape of the Novonesis deal: EUR 1.5 billion in cash for the commercial position in a business whose underlying market the buyer describes as growing at a mid-single-digit rate. Any multiple derived from that figure would require a revenue estimate we do not have, and we are not going to put a decimal point on a guess.
What the investment record implies for the forecast
The investment record supports the report’s central split. Capital is being committed to the categories with a measurable or protected claim — enzymes, where the mechanism is arithmetic; biologicals, where the claim is licensed — and it is being withdrawn from the categories where the molecule is a commodity and the price is capped by a substitute. That is consistent with enzymes at 7.07 per cent and gut health at 8.65 per cent against vitamins at 2.64 and amino acids at 3.43.
It also implies a specific thing to watch that the forecast does not depend on. If the efficacy-evidence bar continues to refuse botanical and probiotic claims in the European Union, the fastest-growing category in this market will grow fastest in the jurisdictions that do not impose that bar — and its European revenue will be sold without the claim that justifies its price. That is a repositioning of where the growth happens, not a reduction in how much of it there is.
Technology & Innovation
Technology, and the evidence problem at the centre of it
The technical agenda in feed additives is genuinely interesting — precision nutrition, encapsulated actives, thermostable enzymes for pelleted feed, near-infrared analysis of incoming raw materials, and single-cell proteins. But the binding constraint on this market is not technical capability. It is that a claim has to be proved to a standard, and the standard is now the scarcest input in the category.
Three long-term trials: the efficacy bar
Under Regulation (EC) No 1831/2003 an applicant must demonstrate that an additive satisfies the conditions for authorisation, and the implementing rules and the European Food Safety Authority’s guidance set out how. For a zootechnical claim, the evidence bar for efficacy is three long-term efficacy studies showing statistically significant effects.
On 20 January 2026 the Commission adopted Implementing Regulation (EU) 2026/119, denying authorisation of a preparation of carvacrol as a zootechnical additive for weaned piglets. The reasoning is worth reading in full because it is a template. EFSA’s opinion of 17 March 2020, and again its follow-up opinion of 31 January 2024, could not conclude on the efficacy of the preparation, because only two long-term efficacy studies showing significant effects could be considered by the Authority, when Commission Regulation (EC) No 429/2008 and the Authority’s guidance required three long-term efficacy studies to show significant effects. Two further studies submitted by the applicant were not taken into account in the efficacy assessment because of a high incidence of diarrhoea and high mortality among the piglets. The applicant proposed removing some data from the analysis of one of those studies; the Commission did not consider that duly justified.
Read that once more. The applicant had two significant long-term trials. It needed three. The two that failed were excluded not because the product failed but because the animals got sick — which is the field condition the product is meant to address. The gap between what the regulation demands and what a field trial in a commercial pig unit can deliver is not a gap in the science. It is a gap in the design of the evidentiary standard, and it is being paid for by the entire European gut-health category.
What that does to innovation
Three responses follow, and all three are visible in the market.
Innovation moves to claim-free positioning. A substance whose zootechnical claim is refused is not thereby removed from commerce. The refusal in 2026/119 is scoped to the zootechnical category for weaned piglets. Products continue to be formulated, sold and used, but the label cannot carry the performance claim that justified the price. What the seller loses is not the sale; it is the pricing mechanism.
Innovation moves to lighter jurisdictions. The United States, Brazil and much of Asia do not run a pre-market efficacy assessment for a feed ingredient in the European sense. A product can be commercialised on the strength of a supplier’s own trial data, which is precisely why the fastest-growing categories in this report grow fastest outside the Union. The gut-health category at 8.65 per cent is not primarily a European phenomenon; it is a global one with a European hole in the middle.
Innovation concentrates in the categories where the claim is already settled. Enzymes have a mechanism that can be measured: phytate is destroyed, phosphorus is released, and the substitution against an inorganic salt is arithmetic. That is why enzymes have been able to grow into a duopoly-plus market on evidence rather than on assertion, and why the only genuinely large enzyme deal in the category — examined in the investment chapter — was struck over a business with a measurable value proposition.
Precision nutrition and the analytical gap
The most consequential technical shift is not a new additive. It is that the ration is becoming measurable. Near-infrared spectroscopy on incoming raw materials allows a mill to estimate nutrient content per delivery rather than per specification, and formulation software can then set amino acid and enzyme inclusion against the actual batch. The effect on this market runs both ways: precision raises the value of amino acids, because they can be dosed to requirement rather than to a safety margin, and it lowers the value of products whose benefit cannot be measured, because a formulation that is being optimised is a formulation in which an unquantified cost line gets cut.
Against that, the category has an analytical gap it rarely admits. There is no reference method to verify in a commercial mill that a gut-health additive has done what its label says. Blood and tissue markers exist for some actives; performance attribution at the whole-flock level cannot separate one ingredient among twenty. The consequence is that product differentiation in the fastest-growing category rests on supplier evidence, and supplier evidence is not an independent reference. We regard this as the single largest technology risk in the market — larger than any competitive threat, because it is a risk to the legitimacy of the price rather than to the volume.
Where the next real innovation is coming from
Three threads are worth tracking rather than forecasting.
The first is the substrate itself. Single-cell proteins and insect meals change the amino acid profile of the ration, not just its cost. Insect protein produced at scale, as covered in our Global Black Soldier Fly report, arrives with its own amino acid content and therefore competes with the amino acid additive as well as with the oilseed meal. A ration built on a different protein base needs a different balancing package.
The second is delivery rather than molecule. Encapsulation and coating determine whether an active survives pelleting, which is why the same molecule can command two different prices in two different physical forms. Formulation intellectual property in this category increasingly sits in the coating, not the active.
The third is data. An additive whose effect is measured at the mill and reconciled against the flock’s performance becomes a service rather than a commodity. That is the route out of the pricing mechanisms described in this report, and no participant in the category has yet demonstrated it at scale.
Market Risk
Market risk: five exposures, and one that is not priced
The risks in this market are not the usual ones. Demand is anchored to protein consumption and is not going to disappear; the feed survey has recorded growth in 13 of the last 14 years. The exposures that matter are to the licence, the substitute and the plant.
1. The authorisation risk, which is now demonstrated
The fastest-growing category in this report carries the highest regulatory risk, and it is no longer hypothetical. Implementing Regulation (EU) 2026/119 refused a carvacrol preparation for weaned piglets on 20 January 2026 because two statistically significant long-term efficacy trials are not three. An applicant with a decade of dockets could not clear the bar.
Every zootechnical claim in the pipeline faces the same standard, and the standard is measured in long-term trials in commercial conditions where disease and mortality destroy data. Our judgement is that a meaningful share of the European gut-health range is currently sold on claims that are weaker than the standard the Commission has just enforced. That does not make the products illegal. It makes the claims fragile, and a fragile claim is a fragile price.
What to watch: the next three refusals, or the first successful re-authorisation of a botanical that previously failed. Either would change the category’s risk premium.
2. The substitution ceiling, which moves with the commodity cycle
Amino acids and enzymes are priced against what they replace, which means their headroom is set by markets they do not control.
Soybean meal is the protein the amino acid package displaces, and its supply is set by oilseed planting decisions modelled in our Global Soybean Seed and corn coverage. When meal is cheap, the economic case for precise amino acid supplementation narrows. The same mechanism applies with greater force to alternative proteins: insect meal produced at scale, as modelled in our Global Black Soldier Fly report, arrives with its own amino acid content and competes with the balancing package as well as with the meal.
Phytase faces the mirror image. Its value is the phosphate salt it displaces, and that price sits inside the fertiliser complex. A sustained fall in phosphate prices would compress the enzyme’s headroom without touching its efficacy.
The sensitivity is structural rather than cyclical in one respect worth stating: because the volume line is compound feed tonnage at 1.20 per cent, the forecast does not require feed demand growth to be right. It requires the additive book per tonne to keep rising. If the substitution ceiling binds, USD 19,400.0 million of expected growth does not disappear but it does move toward the volume-only case of USD 47,842.4 million in 2033.
3. Single-intermediate concentration in the legal-minimum categories
Vitamins are the clearest supply risk in the report and the least discussed, because the category is slow-growing and therefore unexciting. Vitamin A and the carotenoids depend on a shared precursor chain, and the 29 July 2024 fire at BASF’s Ludwigshafen site and the force majeure declaration of 7 August 2024 showed how quickly a repair schedule becomes a global formulation constraint.
The risk is not that vitamins stop being needed. It is that a buyer cannot get them, and that a shortage of a legally required nutrient forces reformulation across every premix line simultaneously. For a premixer, that is a working-capital and customer-retention event, not a margin opportunity. The category’s 2.64 per cent compound growth rate is an average across a series of spikes and reversals, and the average conceals exactly the volatility that matters operationally.
4. Jurisdictional divergence
Because the perimeter is set nationally, a product can be a licensed feed additive in one market and prohibited in another. Ractopamine is approved for use in the United States and prohibited in the European Union and China. The consequence for a supplier is that a single global product specification and a single global claim do not exist, so regulatory affairs becomes a fixed cost that scales with the number of markets served rather than with revenue.
This is a quiet advantage for the largest participants and a quiet barrier for specialists. It also means that a global market size for feed additives is an aggregate of incompatible perimeters, and our own figure should be read that way: USD 43,500.0 million is what the world spends on additive function, not a single harmonised product market.
5. The risk this report is least able to quantify
The fifth exposure has no good data and should be named anyway.
The value of a claim-based additive depends on the buyer continuing to believe the claim. In the European Union the buyer’s belief is now tested by an authority that has begun refusing. In the United States it is tested by a veterinarian’s signature and, increasingly, by retailer and integrator sourcing standards that go beyond federal requirements. If buyers shift from accepting supplier evidence to demanding independent verification, the pricing mechanism described in this report stops working — not because demand falls, but because the product becomes comparable and comparables get competed down.
We cannot size that. We can say that it is the exposure that would matter most if it happened, that it is directional rather than cyclical, and that nothing in the current transaction record suggests the market has begun to price it.
What this model does not carry
Three limitations are disclosed rather than smoothed over.
No regional split. The model carries no geography. A reader who needs Asia-Pacific exposure — and Asia-Pacific is where additive growth concentrates, with Brazil and Latin America the second engine, as modelled in our Brazil and Latin America Animal Feed reports — should not infer it from the global figure.
No market share table. Feed-additive revenue is not separable from segment reporting for most participants, so any share table would measure segment boundaries rather than position.
No transaction multiple. No feed-additive business in this category discloses separable revenue and earnings in a form that would support one.
The value base itself is a construct. The band around USD 43,500.0 million is USD 39,000–48,500 million, built bottom-up from disclosed category revenue where it exists and from inclusion rates and ration tonnage where it does not. The one ratio in this report that is observed rather than constructed is the additive book per tonne of compound feed, and even that divides a constructed numerator by a surveyed denominator. Stated here, in the methodology field and in the first FAQ, so that no reader meets it as a surprise.
Regulatory Landscape
Regulatory landscape: two jurisdictions, two levers, one destination
Feed additives are among the most heavily and least harmonised regulated products in the food chain. The approvals, the categories and the evidentiary standards differ by jurisdiction, to the point where the same compound can be a licensed additive in one market, a veterinary medicine in a second and an unregistered ingredient in a third. Three regimes matter for the market’s economics, and this chapter examines the two that are documented in primary sources.
The European category definition does the heavy lifting
Regulation (EC) No 1831/2003 establishes a common procedure for authorising feed additives and sets the rules for placing them on the market, labelling and use. It divides additives into technological (preservatives, antioxidants, emulsifiers, acidity regulators, silage additives), sensory (flavourings, colorants), nutritional (vitamins, minerals, amino acids, trace elements), zootechnical (digestibility enhancers, gut flora stabilisers) and coccidiostats and histomonostats. Only additives that have been through the authorisation procedure may be placed on the market or used, and authorisations are granted for specific species or categories and specific conditions of use.
Then comes the sentence that reorganised the industry. The Commission’s own guidance on the legislation states that antibiotics, other than coccidiostats or histomonostats, are not feed additives under European legislation. The category that had built the modern feed additive industry was removed from the definition of the category. Everything that followed — the growth of organic acids, probiotics, phytogenics, yeast derivatives and the whole zootechnical segment — is downstream of that drafting decision.
Act one: recital 26 and 1 January 2006
Recital 26 of the same regulation set the terms of the transition. It required a date after which the use of antibiotics still authorised as growth promoting agents would be forbidden, while allowing sufficient time for the development of alternative products to replace those antibiotics, and it provided that no further antibiotics would be authorised as feed additives.
The Commission announced the completion of that process in July 2003, prohibiting four remaining growth promoters — monensin sodium, salinomycin sodium, avilamycin and flavophospholipol — and the ban took effect from 1 January 2006. Note the framing in the legislative record: the Union did not simply prohibit. It explicitly budgeted time for substitutes to be developed, which is an admission that a substitution market would have to be created and a statement that the regulator expected to be its midwife.
Act two: zinc oxide, 2017 to 2022
The second act is the one that explains the shape of European pig nutrition today, and it turns on a number.
Zinc oxide was used as a veterinary medicine to control post-weaning diarrhoea in piglets, typically at 100 mg per kg body weight per day for 14 consecutive days, which the European Medicines Agency’s referral documentation equates to 2,500 ppm zinc in feed. The nutritional maximum for zinc in complete feed for piglets was, separately, 150 mg/kg. The ratio between the two — 16.7 times — is the size of the hole that a prohibition creates.
The Committee for Medicinal Products for Veterinary Use concluded on 16 March 2017 that the benefit-risk balance for orally administered zinc oxide in pigs was negative, because the benefits in preventing diarrhoea did not outweigh the environmental risks from zinc accumulation in soil, and because the risk of co-selection for antimicrobial resistance could not be excluded. The Commission adopted Implementing Decision C(2017) 4529 on 26 June 2017. Article 1 required Member States to withdraw the marketing authorisations, and permitted deferral where immediate withdrawal would cause adverse impact given the lack of available alternatives — with a deferral period not exceeding five years from the date of adoption. The medicinal route to 2,500 ppm closed by 26 June 2022. The nutritional ceiling of 150 mg/kg stayed.
The decision’s own recital 4 is the most commercially consequential sentence in this report. It records the need to allow time to develop alternatives that are available and affordable and change pig farming practices without increasing the use of antimicrobials. The regulator named the substitution market it was creating, and named the risk it was trying to avoid: that removing zinc would push farmers back onto antibiotics.
Act three: 20 January 2026
The third act is the test of whether the substitution market works, and it is only months old.
Commission Implementing Regulation (EU) 2026/119 of 20 January 2026 denies authorisation of a preparation of carvacrol as a feed additive in the zootechnical category for weaned piglets. Carvacrol is a monoterpenoid phenol and the principal active in oregano essential oil — the archetypal botanical alternative to zinc oxide. The refusal is not on safety. It is on efficacy evidence: the Authority could accept two long-term efficacy trials showing significant effects, and Regulation (EC) No 429/2008 and the Authority’s guidance require three. Two further trials were set aside for high diarrhoea incidence and high mortality. The applicant’s attempt to remove data from one of those studies was held not duly justified.
The three acts together describe a closed loop. In 2003 the Union legislated a substitution market into existence and allowed time for it. In 2017 it removed the medicine and again allowed time for alternatives. In 2026 it refused the leading botanical alternative because the evidence bar could not be met in commercial field conditions. The category that was created by regulation is now constrained by regulation, and the constraint is evidentiary rather than commercial.
The scope matters and should not be over-read: 2026/119 denies the zootechnical claim for weaned piglets. It is not a prohibition of the substance, and it does not by itself remove carvacrol from every other use that other legislation governs.
The United States chose the other lever
The FDA’s approach was described in its own fact sheet and timeline. Under Guidance for Industry #213 and the Veterinary Feed Directive final rule, the agency moved to eliminate production uses of medically important antimicrobials in feed and water and to bring remaining therapeutic uses under veterinary supervision. The implementation record is precise: of 292 new animal drug applications initially affected, 84 were completely withdrawn; of the remaining 208, 93 oral products intended for use in water were converted from over-the-counter to prescription status and 115 products intended for use in feed were converted from over-the-counter to veterinary feed directive status; and production, including growth promotion, indications were withdrawn from all 31 applications that included such indications. In January 2017 the agency reported that every affected application had either aligned with GFI #213 or had its approval voluntarily withdrawn.
The FDA did not ban the molecules. It removed the claim that made them worth buying for growth and put the rest under a veterinarian’s signature. Compare the two: the European Union removed the substance and defined it out of the category; the United States kept the substance and deleted the indication. Both jurisdictions made the claim the regulated object.
What the model does and does not resolve
This report models the European Union and United States regimes from primary documents because they are the two that bind the largest share of value and the two that set the template other regulators copy. It does not publish an approval-pathway comparison for other jurisdictions, because we have not verified registration timelines and evidence standards in those markets to the standard applied here, and a comparative table built on secondary summaries would be worse than no table.
The practical consequence for a reader is a boundary. The regulatory complexity level for this market is high and the approval pathway is license based, because in the two markets that matter most, the right to make a claim is granted, scoped and can be withdrawn. That is the asset this market trades on.
Frequently Asked Questions
How large is the global feed additives market and how fast is it growing?
USD 43,500.0 million in 2025, reaching USD 62,900.0 million in 2033 at a compound annual growth rate of 4.72 per cent. That is USD 19,400.0 million of new revenue. Underneath the headline, amino acids are the largest single category at USD 14,200.0 million growing at 3.43 per cent, while gut-health and zootechnical additives are the fastest large category at 8.65 per cent. Compound feed tonnage grows only 1.20 per cent, so most of the growth is more additive value per tonne of feed rather than more feed. The value base is a construct with a disclosed band of USD 39,000–48,500 million, because no jurisdiction requires a feed-additive revenue disclosure.
Which categories of feed additive are growing fastest, and why?
Gut health and zootechnical additives at 8.65 per cent and enzymes at 7.07 per cent, against a market at 4.72. Together they hold 26.0 per cent of the 2025 market and deliver 50.0 per cent of the growth. Neither is growing because of a technology breakthrough. Phytase grows because it displaces an inorganic phosphate cost line; gut health grows because the European Union banned antibiotic growth promoters from 1 January 2006 and withdrew medicinal zinc oxide from 2022, and something had to fill the gap. Demand created by a prohibition behaves differently from demand created by an efficiency calculation, and that difference is the reason the growth rates diverge so sharply.
What happened to the carvacrol feed additive authorisation in the European Union?
On 20 January 2026 the Commission adopted Implementing Regulation (EU) 2026/119 denying authorisation of a carvacrol preparation as a zootechnical additive for weaned piglets. EFSA's opinion of 17 March 2020 and its follow-up opinion of 31 January 2024 could not conclude on efficacy: only two long-term efficacy studies showed statistically significant effects, and Regulation (EC) No 429/2008 and the Authority's guidance require three. Two further studies were set aside because of high diarrhoea incidence and mortality in the piglets. Carvacrol is the archetypal post-zinc-oxide gut-health product, so the refusal matters well beyond one applicant. Note the scope: the denial is of the zootechnical claim for weaned piglets, not of the substance.
How do European and United States feed additive regulations differ?
They remove different things. Regulation (EC) No 1831/2003 took antibiotic growth promoters out of the feed additive category altogether from 1 January 2006, and its recital 26 required time to be allowed for alternative products to be developed. The United States did not withdraw the molecules: FDA Guidance for Industry #213 withdrew production and growth-promotion indications from all 31 applications that carried them, moved 115 feed products to veterinary feed directive status and 93 water products to prescription, and saw 84 applications withdrawn outright. The commercial consequence is the same in both systems — what is regulated is the claim, and the claim is where the value is.