
Editorial Article
London Enforces Parking at 37.9 Per Cent and the Rest of England at 63.7 — Same Statute, Same Penalty Bands
English local authorities reported GBP 1,376 million of on-street parking income against GBP 631 million of on-street expenditure in 2024-25. That is a 45.9 per cent cost ratio and a surplus of GBP 745 million, and on its own it reads like a business with excellent operating leverage.
The average is the least interesting number in it. London ran the same activity at 37.9 per cent. The rest of England ran it at 63.7 per cent. Same statute, same penalty bands, same national framework for civil enforcement — and a 25.8-point gap between two groups of authorities doing an identical job under identical rules. London produced 69.5 per cent of English on-street income and 79.6 per cent of the surplus; Westminster alone ran at 30.0 per cent.
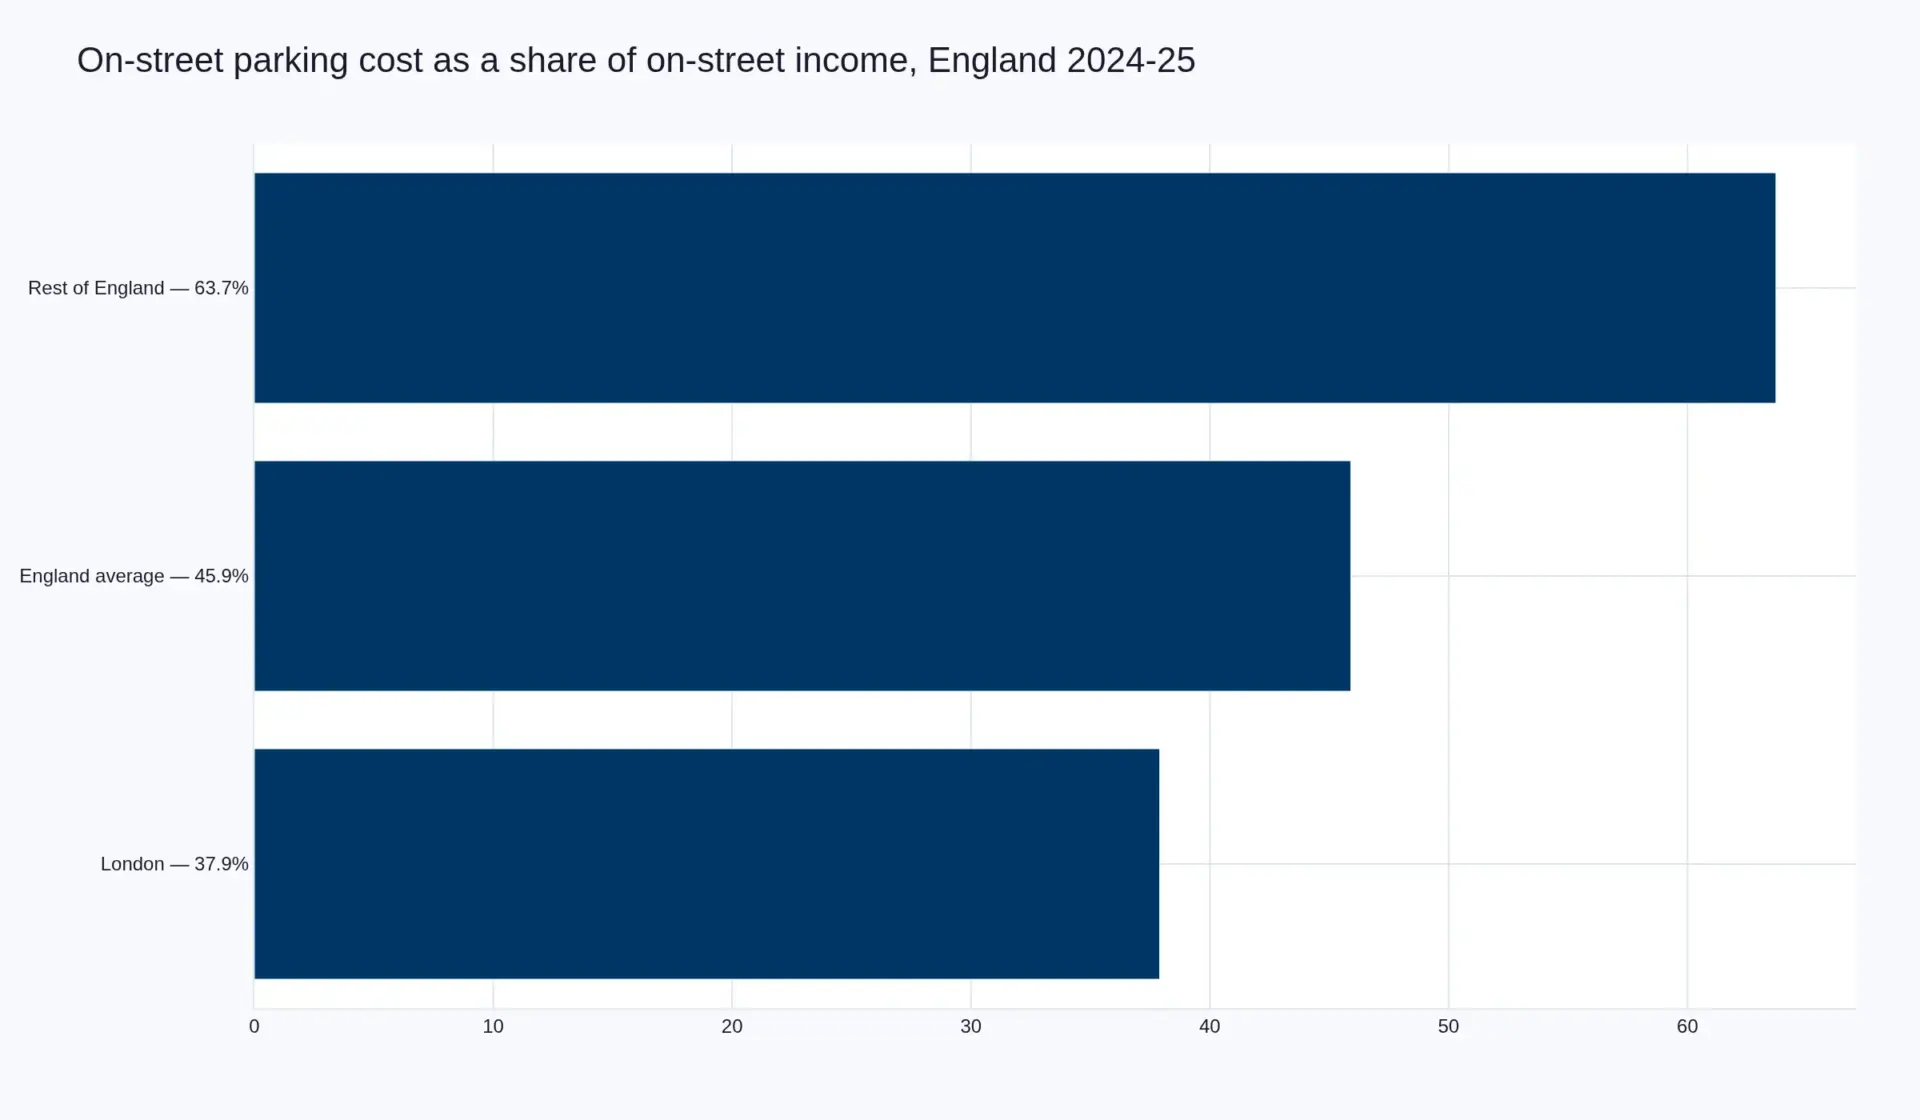
That gap is the finding. It says the unit economics of enforcement are set by the geometry and turnover of the kerb rather than by the quality of the technology pointed at it — and everything else in this market follows from that.
| Measure | London | Rest of England | England |
|---|---|---|---|
| On-street cost ratio | 37.9% | 63.7% | 45.9% |
| Share of England on-street income | 69.5% | Not published separately | 100% |
| Share of England on-street surplus | 79.6% | Not published separately | 100% |
| Lowest reported authority ratio | Westminster, 30.0% | — | — |
The RAC Foundation publishes regional cost ratios and shares of the national totals, not regional income and expenditure totals. The regional totals are therefore absent above deliberately: deriving them would reconcile neatly and would be our arithmetic wearing their attribution.
Why density decides the ratio
Two variables drive the ratio and only one of them is controllable.
Income per bay depends on how many vehicles occupy and vacate a bay per hour, and on the probability that a contravention is observed while it is happening. A dense, high-turnover kerb in central London supplies both: more transactions per hour, and more observation per patrol hour, because the officer walks a short beat that refills behind them. A dispersed kerb across a shire district supplies neither. The same patrol hour covers a fraction of the transactions and finds fewer contraventions — and the cost of that hour is set by the wage market, not by the parking market.
Cost, meanwhile, scales with geography. Patrol cost is a function of kerb length, street count and travel time between them. Revenue is a function of transactions per unit of kerb. Put the two together and the only route to a better ratio is more transactions behind a fixed cost base, which is a property of the place, not of the product.
This is why the technology story misleads. Handhelds, vehicle-mounted capture and back-office automation all lower the cost of recording a contravention. None of them increases the number of contraventions available to observe, and none of them moves a dispersed kerb closer to a dense one. A 20 per cent improvement in capture efficiency applied to a district at 63.7 per cent moves the ratio toward 58; the same improvement in London starts from 37.9. The tool is identical. The gradient it operates on is not.
For the wider market this matters because it sets the ceiling on what an authority will pay. The buyer is not purchasing contraventions; it is purchasing a ratio, and the ratio is largely determined before any supplier arrives. That is also why the curb management market resolves to a scheduling problem rather than a parking one — a kerb is worth what its turnover says it is worth, and the schedule is how that value is allocated.
The direction of travel is adverse, and it is set by policy
In 2024-25 English on-street income rose 9.6 per cent while on-street expenditure rose 13.1 per cent. The surplus still grew, because the base is large, but the ratio deteriorated. That is what a statutory cap on the penalty does when enforcement costs track wages: the revenue ceiling is fixed in nominal terms by policy, the cost floor rises with the labour market, and the space between them narrows mechanically.
Which means the most consequential variable in this market is not a product decision. It is whether a council raises the penalty band, and how often. No supplier can influence that, and every supplier’s contract value sits downstream of it.
The ring-fence is why enforcement behaves like a revenue instrument
British parking is not merely decriminalised; it is fiscal. Most parking contraventions are civil matters handled by the local authority under the Traffic Management Act 2004, and the authority retains the penalty while usually contracting patrol capacity to a supplier. On-street surpluses must by law be applied to transport purposes, and the RAC Foundation calculates that without the parking contribution, net local transport expenditure would have been 20.0 per cent lower in 2024-25.
Total English parking income — on-street and off-street together — was GBP 2,163 million against expenditure of GBP 1,070 million, a surplus of GBP 1,094 million. That ring-fence is the most underrated commercial fact in this market. A supplier selling into this budget is selling into a line that is protected by statute and reported annually, which is materially better than selling into a discretionary one. It is also why the activity behaves like a revenue instrument rather than a compliance service: the surplus is not a by-product of the operation, it is the purpose of it.
The contrast with the recognition-led American model is stark, and it explains a difference in behaviour that is otherwise hard to account for. An English authority defends a measured annual number. A private operator defends a notice population, and a notice population is what a statutory damages provision multiplies.
Los Angeles is not a comparable, and the report says so
The American figures that circulate alongside these are measuring something narrower. Los Angeles reported about USD 94 million of citation revenue in FY2021 against roughly USD 8.6 million of annual processing cost — a 9.1 per cent cost ratio, which looks an order of magnitude better than any English authority and is not comparable to one. The English ratio carries the patrol hour, the adjudication and the collection. The Los Angeles figure carries the processing of a citation that has already been issued. Set them side by side as efficiency measures and the conclusion is that American enforcement is five times more efficient, which is a definitional artefact rather than a finding.
There is a second, subtler trap in the same data, and it is worth naming because our own report fell into it. Santa Monica’s roughly USD 1.6 million across about 300,000 citations is USD 5.33 per notice. Los Angeles’s USD 8.6 million across roughly three million citations is USD 2.87 per notice. Our report’s prose described the two as a unit-cost gradient of 1.86 times. They are not the same quantity. USD 5.33 is revenue per notice; USD 2.87 is cost per notice. The gap measures what a citation is worth in Santa Monica against what it costs to process one in Los Angeles — a pricing-and-turnover finding, not an efficiency one, and it belongs to the density argument rather than the productivity one. The press release issued with the report states the correction; the parent report still carries the looser phrasing, and that sentence is on the list to fix.
Where the value moves, and why
The global market for on-street enforcement and digital permitting is USD 4,020.0 million in 2025 and reaches USD 8,760.0 million in 2033 at 10.23 per cent. The useful detail is the split rather than the total.
| Arm | 2025 (USD m) | 2033 (USD m) | CAGR | Share 2025 | Share 2033 | Share of increment |
|---|---|---|---|---|---|---|
| Field enforcement | 1,650.0 | 2,980.0 | 7.67% | 41.0% | 34.0% | 28.1% |
| Citation processing, adjudication and collections | 1,480.0 | 3,240.0 | 10.29% | 36.8% | 37.0% | 37.1% |
| Digital permitting | 890.0 | 2,540.0 | 14.01% | 22.1% | 29.0% | 34.8% |
| Total | 4,020.0 | 8,760.0 | 10.23% | 100% | 100% | 100% |
The people on the street are the largest cost line and the smallest opportunity. Field enforcement holds 41.0 per cent of today’s value, falls to 34.0 per cent by 2033, and supplies 28.1 per cent of the USD 4,740.0 million of growth to 2033. The register and the back office take the rest: processing 37.1 per cent of the increment, permitting 34.8 per cent.
Volume tells the same story from the other side. Covered spaces grow from 41.2 million to 63.8 million — 5.62 per cent — while revenue per covered space rises from USD 97.6 to USD 137.3, 4.36 per cent. So this market does not grow mainly because more of the world’s kerb comes under formal enforcement. It grows because each covered space is asked to carry more: a permit, a session, a notice, an appeal, a payment plan.
That is why permitting is the arm to watch, and it is the same logic as the airport pre-booking market, where a perishable bay becomes an asset the moment it is sold forward. A citation is an event: it happens, it is contested, it is collected or written off, and the relationship ends. A permit is an annual relationship with a renewal date, a data asset attached and a switching cost. It is the only arm growing above 14 per cent, and the only one where the supplier’s revenue recurs while the authority’s cost does not.
Three falsifiers, and the one that matters
Our base case is priced against three alternatives. If digital permitting grows at the field-enforcement rate of 7.67 per cent rather than 14.01, the 2033 market is USD 7,827.5 million at 8.69 per cent. If citation processing grows at 7.67 per cent rather than 10.29, it is USD 8,193.1 million at 9.31 per cent. And if revenue per covered space escalates at 1.5 per cent rather than 4.36 — the assumption most exposed to ordinary budget pressure — the market is USD 7,014.8 million at 7.21 per cent.
The third is the most probable and the most damaging, because nothing has to fail for it to happen. Covered spaces still grow at 5.62 per cent, the physical penetration of enforcement and permitting proceeds exactly as forecast, and the buyer simply declines to pay more per space each year. No technology reversal, no legal judgment, no political withdrawal — just flat budgets against rising volumes, which is the ordinary condition of local government finance.
One caveat, stated rather than buried
The 41.2 million covered spaces is a Pheonix construction. It has no single published source. It is anchored on reported controlled on-street space counts in the markets covered by our interview programme, scaled by urban population and extended to a global estimate, and it is documented here so that anyone who needs to audit it knows precisely what they are auditing and can conclude that they cannot. The USD 97.6 revenue per covered space is a derived ratio of two constructed numbers. Directional confidence in both is moderate; precision is not claimed.
What a supplier should take from this
Sell into the record, not into the patrol hour. The arms that scale are asset-light, recurring and attached to a data asset. Patrol has no switching cost, no recurring data asset and no defensible margin, and buying it buys labour at market rate. The concession market reached the same conclusion from a different direction — the contract form decides the margin — and the access and revenue control market shows it again, where the gate stopped being a product and became a transaction. So does the occupancy sensing market, where the sensor that gets bought is the one that isn’t installed, and the credential market, where the box is priced per door and the credential per person.
Which leaves the density finding where it started. A supplier cannot move a district from 63.7 per cent to 37.9 per cent by selling better capture. It can only choose which authorities to serve, and price the ratio it is walking into.
Sources and method
The primary research programme behind this analysis comprised 27 semi-structured interviews across six markets, nine conference-floor interviews, one closed roundtable with revenue officers from four authorities, and 41 survey responses. Estimates drawn from that programme are labelled where they appear in the underlying report: enforcement technology at 6 to 11 per cent of field enforcement cost, top-ten concentration at 18 to 22 per cent, and enforcement and patrol contracts transacting at 6 to 9 times EBITDA. No third-party market research is cited in this piece.
References
- RAC Foundation, Local Authority Parking Finances in England 2024-25, 5 November 2025, compiled from MHCLG returns.
- Traffic Management Act 2004, Part 6, civil enforcement of parking contraventions.
- Los Angeles Department of Transportation, council memoranda and contract record C-124676.
- City of Santa Monica, council reports on citation processing and payment plans.
- Conduent, transportation segment fact sheet.
- Verra Mobility, fiscal 2025 results release, 24 February 2026.
- Metropolis Technologies, financing notice, November 2025.
- Pheonix Research, Global On-Street Parking Enforcement & Digital Permitting Market, Size, Share and Forecast 2026–2033.