
Editorial Article
The Same Bay Earns 32.0 Per Cent on a Lease and 8.8 Per Cent on a Fee — and the Paper Is the Difference
Two parking operators disclosed their results in the same period, in the same business, serving the same kind of customer. Q-Park reported EUR 943.0 million of net revenue and EUR 302.0 million of operating result — a 32.0 per cent operating margin. SP+ reported USD 883.2 million of services revenue before reimbursed management-type contract revenue, and USD 77.5 million of GAAP operating income — 8.8 per cent.
The gap is not three and a half percentage points. It is a factor of 3.6, and it has nothing to do with technology, geography or the quality of the management. It is the paper each company signs.
Put differently: an agency operator has to turn over three and a half times the revenue a leaseholder turns over to bank the same operating profit. That single sentence explains most of the strategic behaviour in this industry — why operators chase concessions they may not be able to service, why owners cling to their own car parks, and why a technology company with no car parks can now afford to buy one of the largest operators in the world.
What the revenue line confesses
Read the two disclosures carefully and the business models separate before any margin is calculated. SP+ reports services revenue before reimbursed management-type contract revenue. Reimbursed revenue is the owner’s tariff: cash the operator collects and hands back, which inflates turnover without ever being the operator’s money. Stripping it out is the honest treatment, and it is also a confession. At those sites SP+ is not the merchant. It is the merchant’s agent, paid a fee for collecting somebody else’s revenue.
Q-Park’s revenue requires no such adjustment because there is nothing to strip. It leases the car park, pays the owner a rent, and keeps the tariff. Its revenue is gross parking income and the cost line that decides the year is the rent it has promised.
So these are not two versions of the same company at different quality tiers. They are two parties standing on opposite sides of one transaction at the same address. One owns the price and survives whatever the volume turns out to be. The other collects the price and survives the owner.
Three papers, three risk transfers
Every operator in this market signs one of three instruments, and the instrument — not the technology stack, not the location quality, not the brand above the entrance — sets the ceiling on what the margin can be.
- Lease and concession. The operator pays the owner for the right to the revenue: a fixed rent, or a minimum guarantee with a revenue share above a threshold. It keeps the tariff and carries the volume risk. Good years are very good. A bad year belongs to the operator.
- Management and agency. The owner keeps the revenue and the volume risk. The operator supplies labour, systems, compliance and collection and is paid a fee — typically a percentage of gross, sometimes with a performance element attached. Pheonix estimates fee bands at 3–6 per cent of gross across the contracts in our interview programme.
- Ancillary and technology-attached. Neither of the above. Revenue from recognition, reservation, validation, charging, enforcement integration and the transaction data those produce. It attaches to the transaction rather than to the tenancy, which is why it can grow on a site where the operator holds no lease at all.
The three are growing at very different rates. In our model, lease and concession goes from USD 20,140 million in 2025 to USD 31,560 million in 2033 at 5.78 per cent. Management and agency goes from USD 16,160 million to USD 28,040 million at 7.13 per cent. Ancillary and technology-attached goes from USD 7,480 million to USD 19,300 million at 12.58 per cent, lifting its share of the pool from 17.1 per cent to 24.5 per cent and supplying 33.7 per cent of all incremental value in a market compounding at 7.64 per cent to USD 78,900 million.
That is an awkward result for anyone who assumed the leases were where the money lives. The highest-margin instrument is also the slowest-growing one, for a reason that is structural rather than cyclical: a lease is a promise about volume made before the volume is known, and the number of owners willing to accept a bid is finite. Every additional concession has to be won from a council, a fund or a family that already has an opinion about its car park.
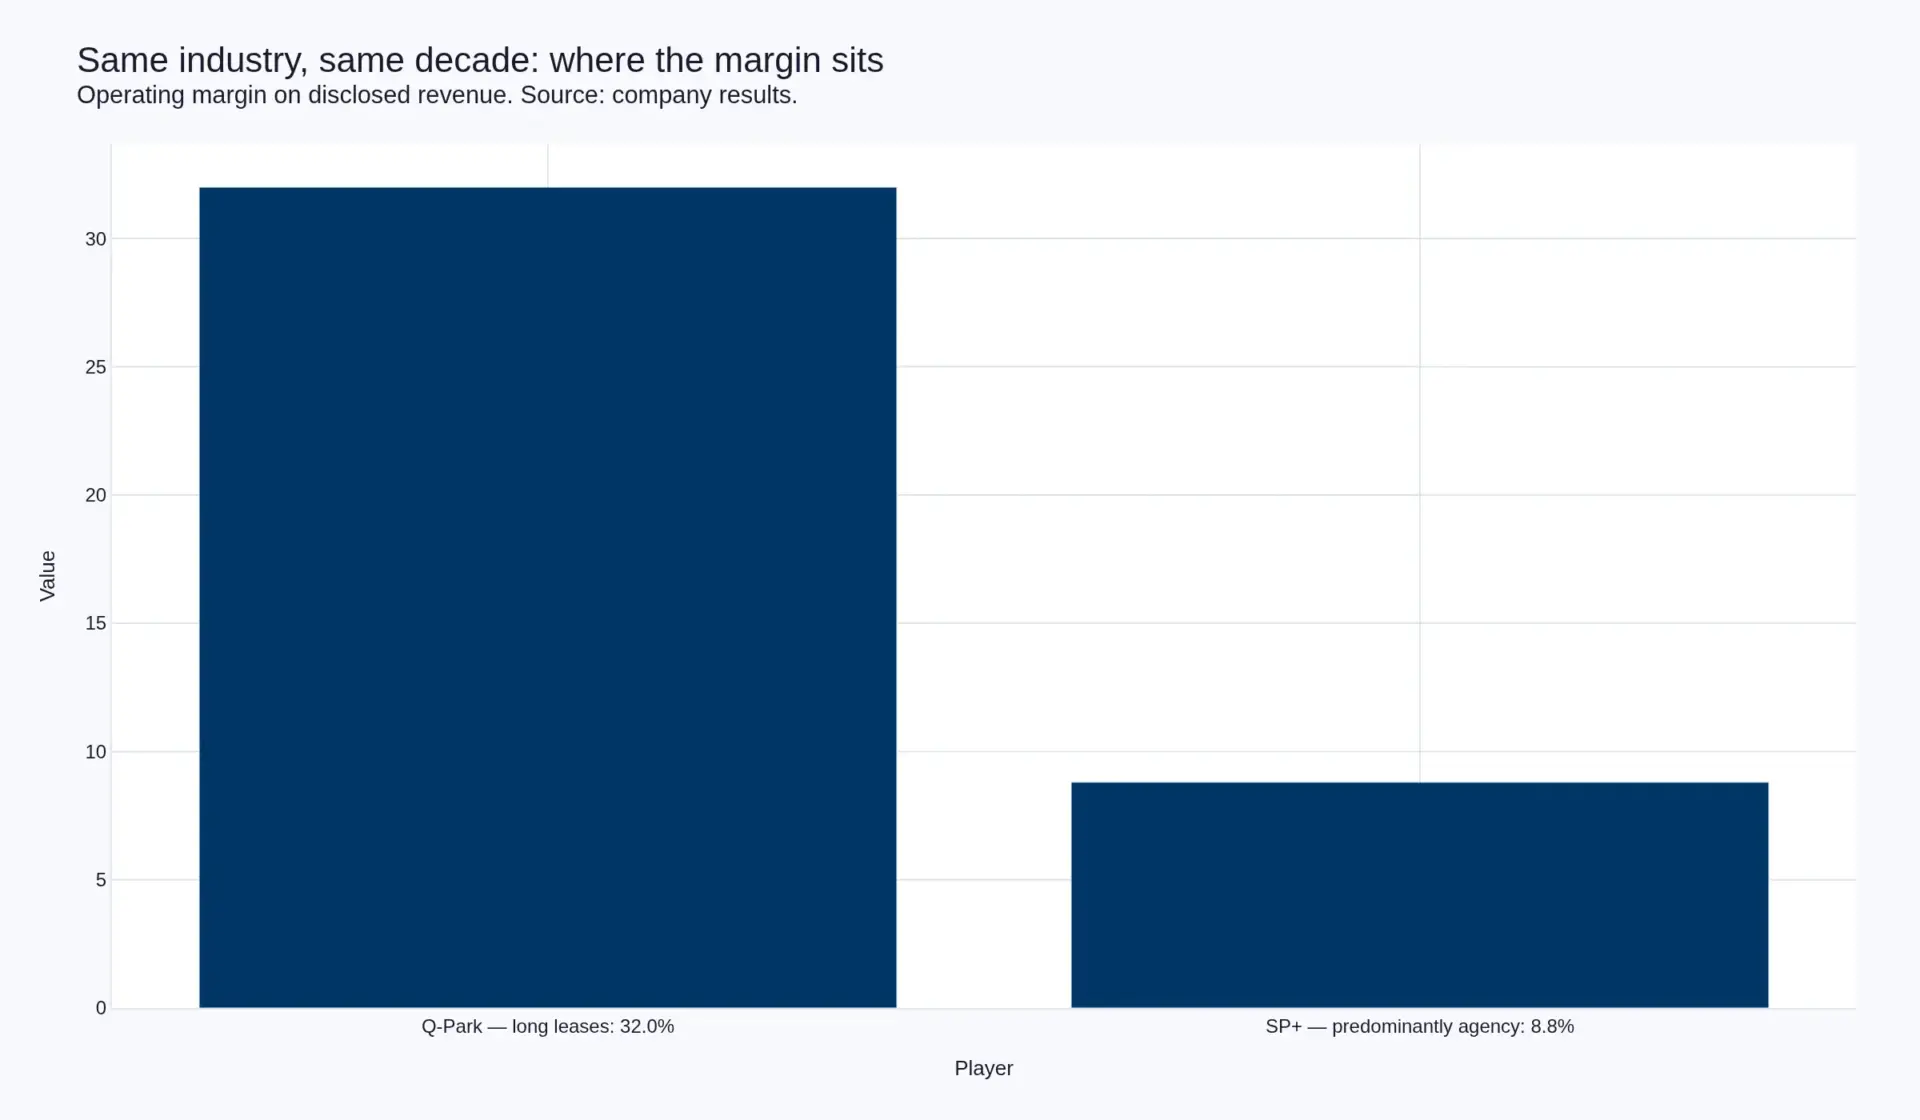
The margin is bought with a rent, not earned with a system
This is where most industry commentary goes wrong. It treats operating margin as a measure of how well a company runs a car park — the efficiency of its labour schedule, the sophistication of its revenue management, the reach of its technology platform. In this market those things are real, and they are second order.
What decides the margin is whether the operator holds the price. A pound of additional revenue under a lease falls through to operating profit at close to its full marginal value once the rent has been covered. The same pound under a management contract generates a fee of a few pence and nothing more, because the rest was never the operator’s. Every improvement an operator makes to a managed site — better scheduling, dynamic pricing, tighter reconciliation — accrues mostly to the owner, and the operator is compensated for the improvement at the contractual rate rather than at its value.
Which produces the counter-intuitive position this industry rarely states plainly: automation in parking is worth more to the party that pays the wage bill than to the party paid to manage it. SP+ disclosed 5.9 people per commercial location before its aviation business. Pheonix estimates labour at 42–58 per cent of controllable site cost. Under a lease, cutting that cost is margin. Under a fee, cutting it is a service improvement delivered at cost and priced at a percentage.
What a concession actually costs
The arithmetic of the other side is best seen in a public record rather than a private one. On 4 December 2008 the City of Chicago transferred the operation of 36,000 metered spaces and 18 parking lots for USD 1,156,500,000. Read as a price per space it looks extraordinary. Read as a lease it is simply the rent, paid forward in a single instalment — an owner converting an uncertain annual revenue stream into a certain one, and selling the difference to whoever believed they could price the asset better.
That is the whole concession model in one transaction, and it explains why cities keep doing it and why operators keep bidding. The owner is not selling a car park. The owner is selling the variance. The operator’s margin is the price it charges for absorbing that variance, and it is only a margin if the operator’s forecast of occupancy turns out to be better than the owner’s.
Where the growth is actually coming from
The market grows from USD 43,780 million in 2025 to USD 78,900 million in 2033, but the aggregate number hides the mechanism. Managed bays go from 96.4 million to 132.7 million at 4.08 per cent, while revenue per managed bay goes from USD 454 to USD 595 at 3.42 per cent. (The bay count is a Pheonix construction rather than a published series; the method and its anchors are set out in the full report.)
So the pool is not mainly growing because more car parks come under professional management. It is growing because each managed bay now carries more: recognition at the entry and exit, reservation ahead of arrival, validation inside the tenancy, charging on the slab, and a contract form that lets the operator keep part of the tariff instead of a fee for collecting it.
Two sensitivities define how much of that survives. If ancillary and technology-attached revenue grows at the lease arm’s 5.78 per cent instead of 12.58 per cent, the market lands at 6.29 per cent and USD 71,321 million rather than USD 78,900 million. If revenue per bay flattens to 1.5 per cent — if operators win volume but cannot reprice it — the market lands at 5.63 per cent and USD 67,876 million. Both are within the range of outcomes a single contract cycle could produce, which is the point of publishing them.
The decision rule this implies
For an operator allocating capital, the three instruments are not interchangeable and the choice is not primarily a matter of appetite. It follows from what the operator knows about the site and what the owner is willing to sign.
- Take the lease when occupancy is stable, the catchment is understood, and the owner will accept a term long enough to amortise the fit-out. That is where the 32 per cent lives, and it is where the volume risk is genuinely priceable.
- Take the agency contract when volume is volatile, when the asset is contested or when the owner will not part with the revenue line. Accept the 8.8 per cent as the price of not carrying a rent through a downturn — and be clear that it is a services business with services margins.
- Build the ancillary line regardless of which paper you signed. It attaches to the transaction, not to the tenancy, and it is the only arm growing at double digits.
The mistake the industry keeps making is signing an agency contract and then running it as though the margin were a lease margin — staffing it for the service level a lease would justify, investing in revenue management that accrues to somebody else, and reporting the result as an operating problem rather than a structural one.
How this was researched
This analysis rests on 70 per cent secondary research and 30 per cent primary research conducted by Pheonix. The primary programme comprised 38 semi-structured interviews across seven markets, 11 conference-floor interviews, two asset-owner roundtables and a 64-response operator survey, conducted between 2024 and 2026. The fee bands, the labour share of controllable cost and the payback ranges quoted above are Pheonix estimates derived from that programme rather than figures disclosed by any company; they are labelled as such where they appear. Everything else traces to a published company or public-authority record.
References
- Q-Park, Annual CSR Report 2024 — net revenue, operating result, capex funded from operating cash flow.
- SP+, Form 10-K and Q4/FY2023 results release — services revenue before reimbursed management-type contract revenue, GAAP operating income, 5.9 people per commercial location, 120 standalone technology deployments, 94 per cent location retention.
- Park24, FY10/2024 Data Book — domestic and overseas bay counts.
- City of Chicago, published concession record, 4 December 2008 — 36,000 metered spaces and 18 lots, USD 1,156,500,000.
- US Census Bureau, Annual Integrated Economic Survey, NAICS 812930 — US parking revenue.
- Directive (EU) 2024/1275, Article 14 — recharging and ducting requirements for non-residential car parks from 1 January 2027.
- Pheonix Research, Global Parking Management & Concession Operations Market, 2026–2033 — the model, contract-form split, regional analysis and sensitivities summarised here.